TLDR: A record 81.8 million Americans traveled for Thanksgiving 2025, with 73 million driving. That 90% car mode share isn’t just a holiday quirk; it’s the clearest annual snapshot of how the country actually moves.
Seventy-three million Americans got in their cars this Thanksgiving, a record, and the number that matters isn’t total travelers but mode share: nearly 90% drove.
Thanksgiving functions as America’s annual mobility stress test. It’s the one week when discretionary long-distance travel peaks across every demographic, when infrastructure gets pushed to capacity, and when consumer preferences reveal themselves at scale. The data from AAA’s 2025 forecast settles any debate about whether American car culture is fading.
|
||||||||||||||||||||||
The Car Dominance Numbers
The 73 million drivers represent 1.3 million more than 2024, a 1.8% increase that pushed road travel to its highest recorded level. Air travel grew just 2%, reaching 6.1 million passengers. Buses, trains, and cruises combined for 2.5 million, an 8.5% jump that still amounts to just 3% of total holiday travel.
The ratios tell the story. For every person who flew, more than 12 drove. For every bus, train, or cruise passenger, 29 drove. Stable fuel prices ($3.07 per gallon, essentially flat from 2024) and 15% cheaper car rentals created a structural bias toward road travel that alternatives couldn’t overcome.
What the Roads Actually Looked Like
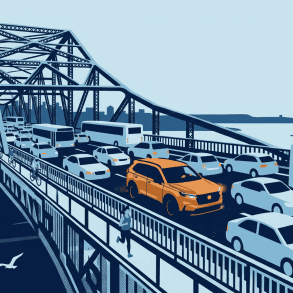
INRIX traffic data reveals the predictable patterns. Tuesday and Wednesday afternoons saw the worst congestion, with some corridors experiencing delays more than double normal conditions. The Washington D.C. to Baltimore corridor via Baltimore-Washington Parkway peaked at 166% above typical travel times. New York to the Hamptons hit 163%.
These bottlenecks aren’t temporary inconveniences; they’re structural capacity constraints that reveal how completely the transportation system flexes around the automobile. Mode-shift alternatives don’t meaningfully dent demand because the infrastructure, the geography, and the cultural expectations all assume cars.
Thanksgiving Day itself remained relatively clear. The crush came Sunday as travelers returned home, with heavy traffic expected from late morning through evening across most major metros. Weather complicated the return: a significant winter storm brought blizzard conditions to the Upper Midwest and Great Lakes, with Michigan’s Upper Peninsula seeing two to three feet of snow through Friday. The National Weather Service warned that travel could be “impossible at times” in the worst-affected areas.
The Behavioral Reality
Holiday driving isn’t just high-volume; it’s high-risk. According to Insurify and Cambridge Mobile Telematics data, drivers spend 68% more time speeding on Thanksgiving compared to typical Thursdays. Distracted driving increases 11%. The combination of unfamiliar routes, longer distances, and time pressure creates measurably worse behavior behind the wheel.
The historical data reinforces the pattern. November 2023 had the highest total crash rate of any month, at 207.92 crashes per 100 million vehicle miles traveled. Between 2019 and 2023, 868 people died in drunk-driving crashes during Thanksgiving festivities, more than one-third of all holiday traffic fatalities. Last Thanksgiving, AAA responded to nearly 600,000 emergency roadside assistance calls.
This is the risk profile of a mobility system where nearly everyone drives. The danger isn’t despite car dependence; it’s a function of it.
What This Means for the Industry
Americans aren’t just driving; they’re driving bigger. SUVs now account for 52% of new vehicle sales, up from 38% in 2016. Pickup trucks captured over 25% of Q3 2025 sales. Consumer preference has shifted decisively toward larger vehicles even as fuel costs and environmental concerns remain part of the national conversation.
The holiday data also contextualizes the EV infrastructure challenge. Seventy-three million vehicles on the road in a single week stress every system: gas stations, rest stops, charging networks. The difference is that gas stations can refuel a vehicle in five minutes. DC fast chargers need 20 to 45 minutes for a meaningful charge. Holiday surge capacity is the stress test EV infrastructure hasn’t yet passed, and it’s the test that matters most to consumers weighing range anxiety against environmental aspiration.
The Outlook
AAA projects cruise passengers will reach 21.7 million in 2026, up from 20.7 million this year. Air travel grows incrementally. But nothing in the trend lines suggests cars are losing their grip on American travel.
The 81.8 million Thanksgiving travelers set a record. The 73 million drivers set a record. The 90% mode share held steady. These numbers aren’t just travel statistics; they’re infrastructure commitments, consumer preferences, and cultural choices that compound over decades.
America built its geography around the automobile. One week of data per year won’t prove that’s permanent, but it does prove that’s still true.