
Volkswagen Sales Data, Trends, Analysis & Current Lineup for the U.S Automotive Market
This is your hub for all of the Volkswagen sales data for the U.S market. Volkswagen is a case of “how long can they go before they finally crack it?”. The brand that vies for the top spot in worldwide sales alongside Toyota has been making a hash of selling in the American market for decades, first by relying on the Beetle for way too long, then by subjecting its customers to the awful production quality of the US-produced Golf/Jetta in the 1980s, then relying on its too-expensive European range of cars through the 1990s and early 2000s, until finally developing US-centric Jetta and Passat models in the late 2000s.
While the new Jetta and Passat models met with early high demand, their conservative style quickly started turning customers off, as did the old-fashioned engine technology and so-so reliability. The one bright spot for VW USA was the relative success of its Clean Diesel cars, until in the fall of 2015 it emerged that they were not as clean as claimed, sending the company into damage-limitation mode. What does the future hold?
On the plus side, VW USA finally got the US-made 7-seat SUV Atlas that its dealers have been begging for a long time, as well as a 5- and 7-seat version of the new, larger Tiguan which is doing well. However, only time will tell how much customer had been turned off by the Diesel scandal…
Volkswagen traces its roots from 1937 when it was established by German Labor Front (Deutsche Arbeitsfront) in Berlin to produce affordable cars. Cars were considered a luxury by Germans in the 1930s and the majority of them could only afford motorcycle. The first car manufactured by the company was the Volkswagen Bettle which they started producing in 1938 until 2003. Since then, Volkswagen has gone on to produce a number of different cars. Today, Volkswagen is renowned as a world-leading auto manufacturer. It was even the considered as the world’s largest automobile manufacturer in 2016 and 2017 until was overtook by Toyota. Volkswagen-brand vehicles are known for their sound German engineering principles and a passion for design that favors performance.
Volkswagen U.S Sales Figures & Recent Highlights
Even though it is the number two largest automobile manufacturer in the world when it comes to production volume, Volkswagen’s following in the US is not that great as compared to other car manufacturers such as Toyota, Ford, and GM. Sales are hovering around 340,000 to 360,000 mark over the last five years which is considered to be a drop after selling over 400,000 units from 2012 to 2013. Volkswagen’s current best sellers in the United States are the Tiguan crossover and the Jetta sedan.
Volkswagen of America (VWoA) reported Q2 2023 sales of 76,934, down 1.7% year-over-year. Year-to-date sales stand at 144,787, which is one percent more than a year ago. The ID.4 was VWoA’s best-selling model in Q2 2023, with sales of 15,879, up 24.4% year-over-year. The Taos was the second best-selling model, with sales of 14,108, up 4.5% year-over-year. The Tiguan was the third best-selling model, with sales of 11,813, down 11.4% year-over-year.
In March 2023, VWoA announced that it would invest $7.1 billion in the US over the next five years to electrify its lineup and build electric vehicles in the US. In May 2023, VWoA started production of the ID.4 at its Chattanooga, Tennessee plant. In June 2023, VWoA announced that it would offer a 10-year/100,000-mile battery warranty on all of its electric vehicles in the US.
Volkswagen Monthly Sales Data in the U.S
Below we have a table that shows Volkswagen sales for the United States automotive market, but this time it is broken out by month. This is on a unit basis. This is Volkswagen new vehicle sales in the US.
Volkswagen Annual Sales, Growth & Market Share in the United States
Below we have a table that shows total Volkswagen sales volumes for the US automotive market, broken out by year. This data captures all Volkswagen vehicle sales for the entire United States automotive market.
| Year | Sales | YOY Change | US Marketshare | Marketshare Change |
|---|---|---|---|---|
| 1950 | 2 | 0.00 | 100.00 | 0.00 |
| 1951 | 50 | 2,400.00 | 100.00 | 0.00 |
| 1952 | 93 | 86.00 | 100.00 | 0.00 |
| 1953 | 75 | -19.35 | 100.00 | 0.00 |
| 1954 | 827 | 1,002.67 | 100.00 | 0.00 |
| 1955 | 3,189 | 285.61 | 100.00 | 0.00 |
| 1956 | 7,375 | 131.26 | 100.00 | 0.00 |
| 1957 | 19,118 | 159.23 | 100.00 | 0.00 |
| 1958 | 25,036 | 30.96 | 100.00 | 0.00 |
| 1959 | 32,133 | 28.35 | 100.00 | 0.00 |
| 1960 | 35,697 | 11.09 | 100.00 | 0.00 |
| 1961 | 22,754 | -36.26 | 100.00 | 0.00 |
| 1962 | 32,514 | 42.89 | 100.00 | 0.00 |
| 1963 | 39,383 | 21.13 | 100.00 | 0.00 |
| 1964 | 41,051 | 4.24 | 100.00 | 0.00 |
| 1965 | 34,054 | -17.04 | 100.00 | 0.00 |
| 1966 | 40,198 | 18.04 | 100.00 | 0.00 |
| 1967 | 29,049 | -27.74 | 100.00 | 0.00 |
| 1968 | 57,862 | 99.19 | 99.43 | -0.57 |
| 1969 | 54,985 | -4.97 | 95.81 | -3.78 |
| 1970 | 72,515 | 31.88 | 92.84 | -3.19 |
| 1971 | 68,561 | -5.45 | 61.71 | -50.45 |
| 1972 | 48,178 | -29.73 | 36.48 | -69.14 |
| 1973 | 43,533 | -9.64 | 19.82 | -84.10 |
| 1974 | 30,501 | -29.94 | 17.28 | -14.67 |
| 1975 | 33,787 | 10.77 | 15.08 | -14.59 |
| 1976 | 36,251 | 7.29 | 14.63 | -3.09 |
| 1977 | 50,995 | 40.67 | 14.60 | -0.18 |
| 1978 | 54,154 | 6.19 | 14.23 | -2.64 |
| 1979 | 37,944 | -29.93 | 8.14 | -74.88 |
| 1980 | 60,930 | 60.58 | 6.14 | -32.47 |
| 1981 | 64,568 | 5.97 | 5.01 | -22.50 |
| 1982 | 47,009 | -27.19 | 3.84 | -30.42 |
| 1983 | 49,834 | 6.01 | 3.02 | -27.19 |
| 1984 | 56,047 | 12.47 | 2.66 | -13.82 |
| 1985 | 57,985 | 3.46 | 1.56 | -69.83 |
| 1986 | 49,124 | -15.28 | 1.23 | -26.78 |
| 1987 | 77,629 | 58.03 | 2.13 | 42.07 |
| 1988 | 81,686 | 5.23 | 2.12 | -0.53 |
| 1989 | 55,684 | -31.83 | 1.60 | -32.54 |
| 1990 | 42,313 | -24.01 | 1.41 | -13.64 |
| 1991 | 28,201 | -33.35 | 1.03 | -36.61 |
| 1992 | 21,350 | -24.29 | 0.82 | -25.14 |
| 1993 | 12,656 | -40.72 | 0.46 | -78.79 |
| 1994 | 5,349 | -57.74 | 0.22 | -106.96 |
| 1995 | 5,540 | 3.57 | 0.20 | -9.46 |
| 1996 | 5,828 | 5.20 | 0.21 | 3.87 |
| 1997 | 9,538 | 63.66 | 0.33 | 35.69 |
| 1998 | 15,230 | 59.68 | 0.49 | 32.68 |
| 1999 | 11,539 | -24.24 | 0.39 | -25.30 |
| 2000 | 14,133 | 22.48 | 0.50 | 22.79 |
| 2001 | 13,327 | -5.70 | 0.59 | 13.95 |
| 2002 | 8,675 | -34.91 | 0.36 | -60.65 |
| 2003 | 0 | -100.00 | 0.00 | 0.00 |
| 2004 | 0 | 0.00 | 0.00 | 0.00 |
| 2005 | 224,195 | 0.00 | 1.31 | 100.00 |
| 2006 | 223,530 | -0.30 | 1.34 | 2.34 |
| 2007 | 210,526 | -5.82 | 1.30 | -3.35 |
| 2008 | 203,057 | -3.55 | 1.52 | 14.80 |
| 2009 | 205,772 | 1.34 | 1.96 | 22.22 |
| 2010 | 256,218 | 24.52 | 2.19 | 10.42 |
| 2011 | 318,974 | 24.49 | 2.47 | 11.45 |
| 2012 | 467,408 | 46.53 | 2.99 | 17.54 |
| 2013 | 407,703 | -12.77 | 2.60 | -15.07 |
| 2014 | 366,970 | -9.99 | 2.22 | -17.23 |
| 2015 | 349,440 | -4.78 | 2.00 | -11.14 |
| 2016 | 322,948 | -7.58 | 1.84 | -8.79 |
| 2017 | 339,676 | 5.18 | 1.97 | 6.64 |
| 2018 | 354,053 | 4.23 | 2.04 | 3.51 |
| 2019 | 363,322 | 2.62 | 2.13 | 4.37 |
| 2020 | 355,684 | -2.10 | 2.42 | 11.88 |
| 2021 | 366,462 | 3.03 | 2.45 | 1.33 |
| 2022 | 250,661 | -31.60 | 1.83 | -33.82 |
| 2023 | 329,025 | 31.26 | 2.12 | 13.53 |
| 2024 | 82,103 | 0.00 | 2.16 | 0.00 |
Volkswagen U.S Annual Sales Units & Growth Chart
Below is a visual representation of Volkswagen’s U.S sales units over time. We have both the Volkswagen sales units and the growth in the United States market. Click on the items in the legend to see each series by itself.
Volkswagen U.S Growth Rate & Market Share Chart
Below is the annual growth rate for the Volkswagen brand in the United States, shown against the Volkswagen’s marketshare changes in the United States. This gives you a good look into how Volkswagen has faired against the other brands in terms of absolute sales and effect on marketshare. Click on the items in the legend to see each series by itself.
The Best-Selling Volkswagen Cars & SUVs in the United States
- Volkswagen Tiguan (71,085 sold in 2022). The Tiguan is a compact SUV that has been the best-selling Volkswagen model in the US for several years. It is known for its comfortable ride, spacious interior, and fuel-efficiency.
- Volkswagen Taos (50,371 sold in 2022). The Taos is a subcompact SUV that was introduced in 2021. It is smaller than the Tiguan but still offers a comfortable ride and plenty of space.
- Volkswagen Atlas (43,900 sold in 2022).The Atlas is a midsize SUV that is known for its spacious interior and third-row seating. Very practical and great value.
- Volkswagen Jetta (34,032 sold in 2022). The Jetta is a compact car that is known for its fuel-efficiency and sporty handling.
- Volkswagen Atlas Sport (24,666 sold in 2022). The Volkswagen Atlas Cross Sport is a mid-size SUV first introduced in 2020 as a more stylish and coupe-like version of the Volkswagen Atlas.
The Current Volkswagen Model Lineup & Prices in the U.S
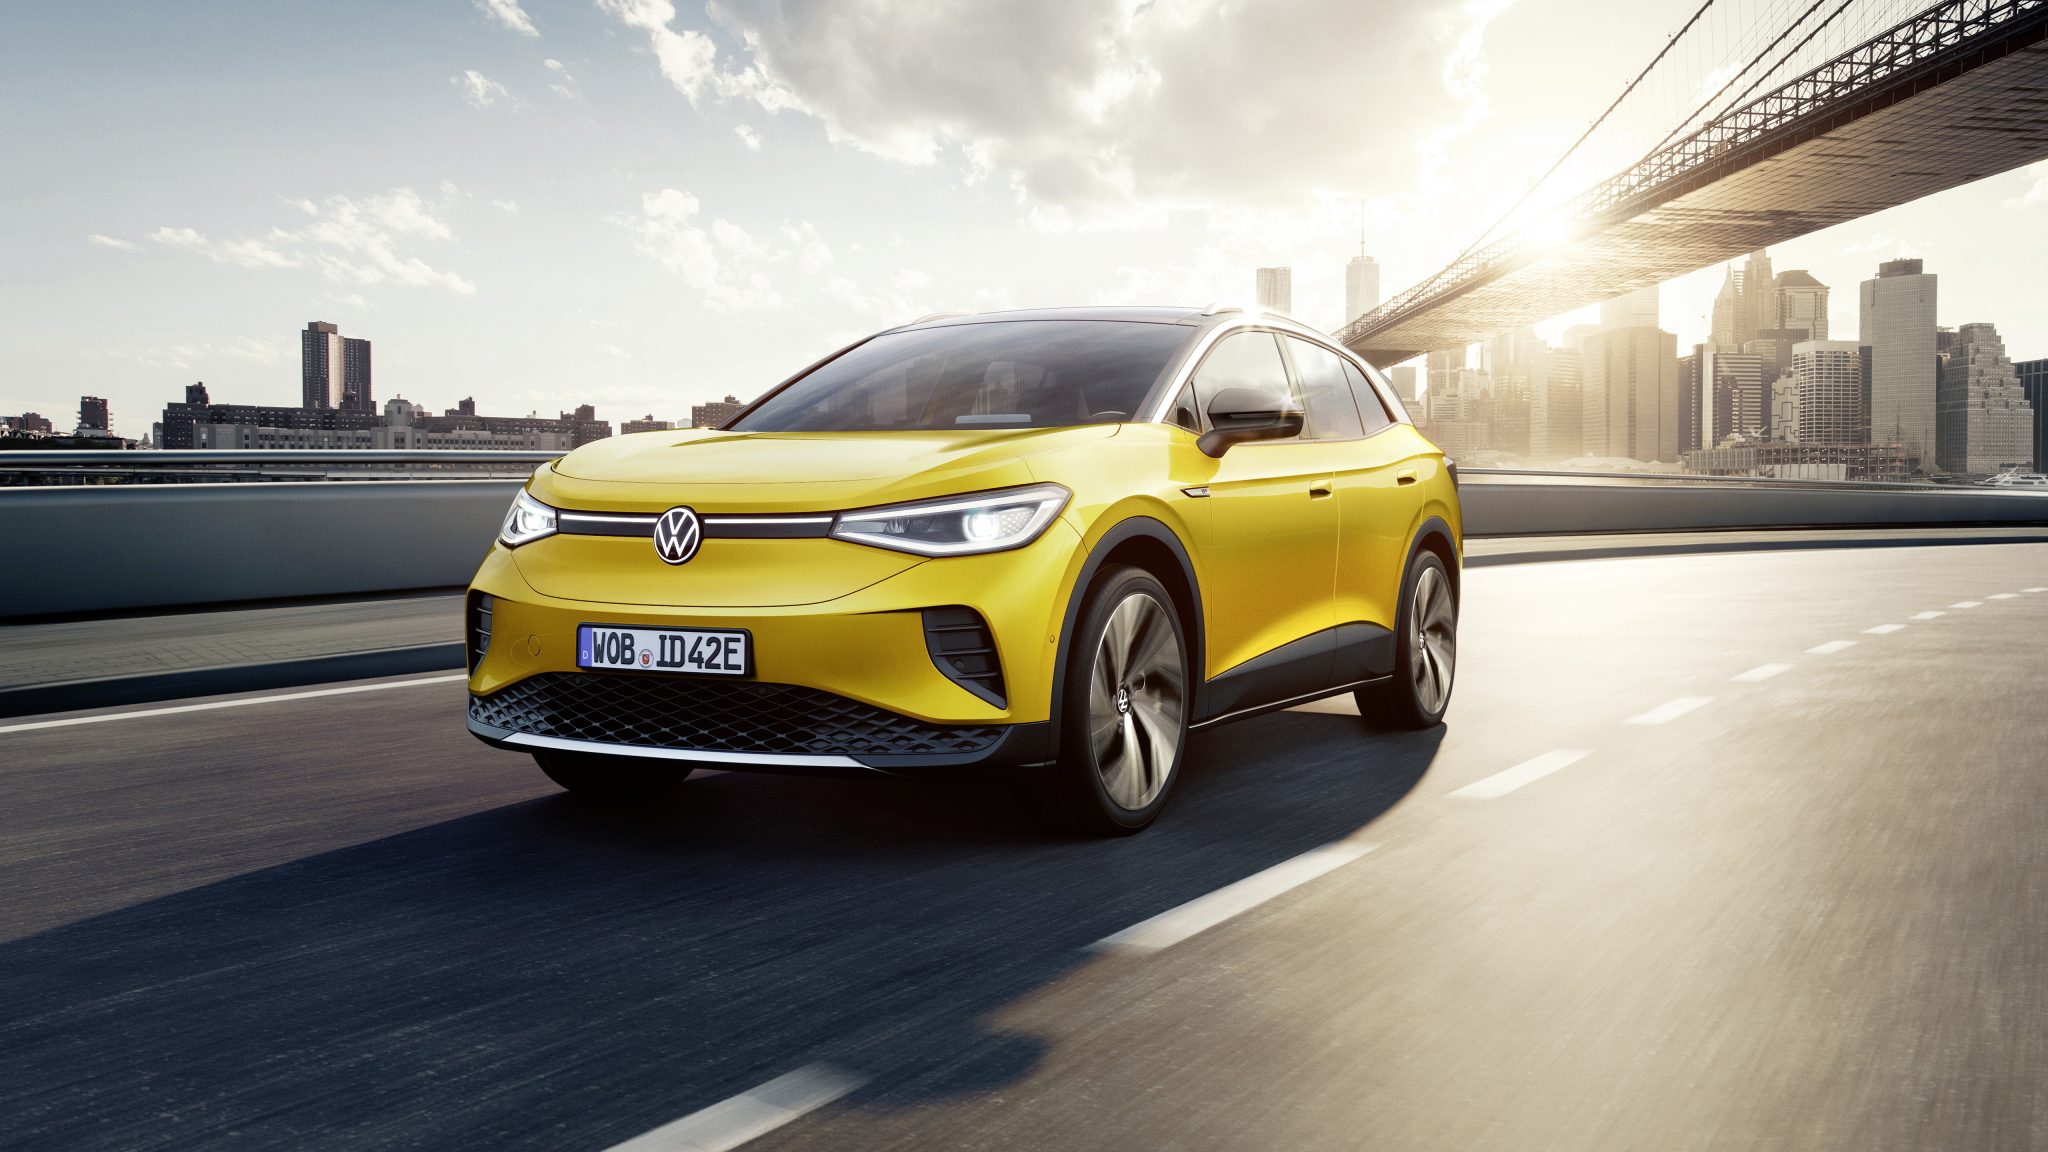
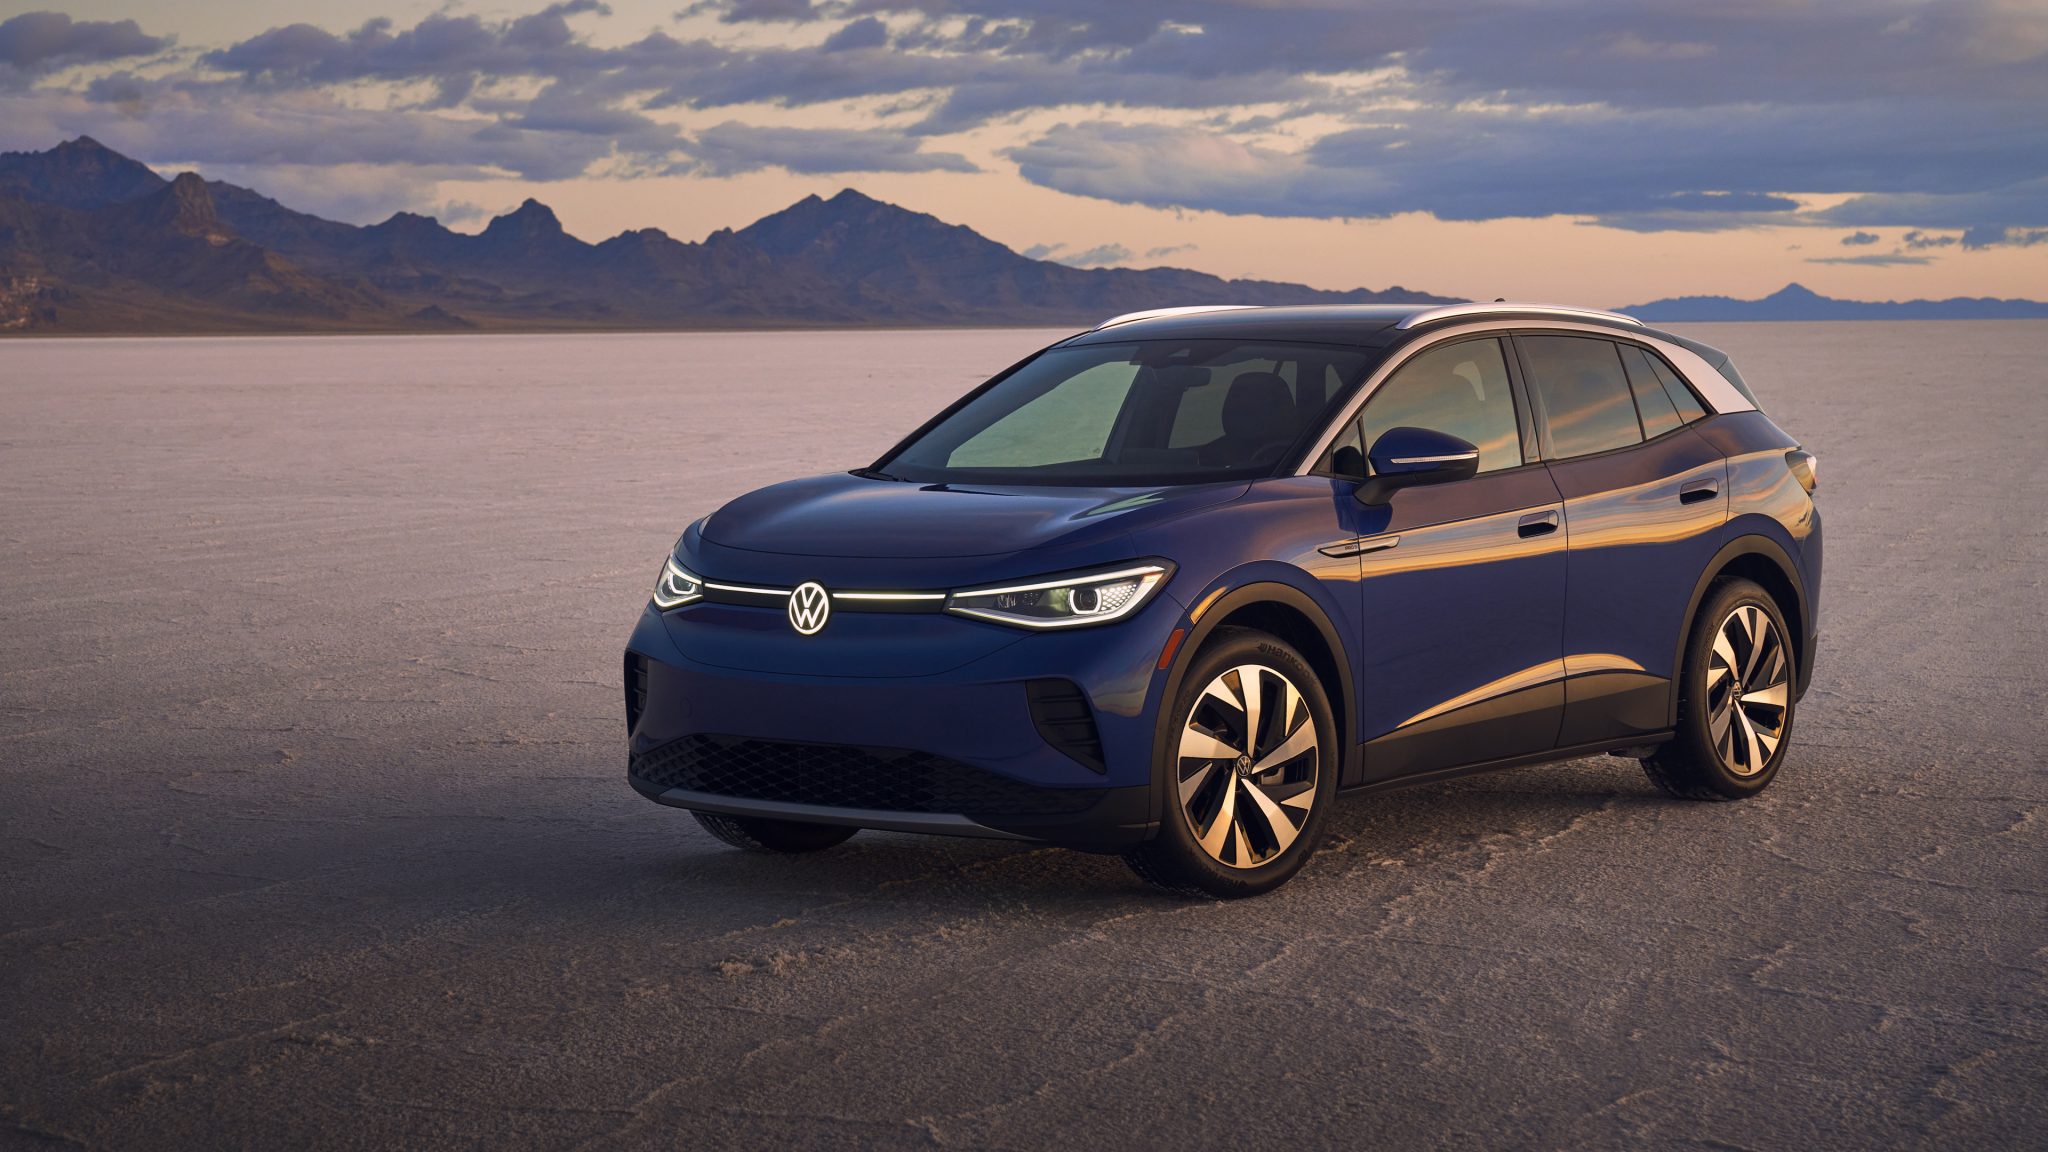
Volkswagen ID.4
Starting at $38,995
The Volkswagen ID.4 is an all-electric SUV that was introduced in 2021. It is Volkswagen’s first mass-market electric vehicle and has been praised for its range and performance. The ID.4 is powered by a 77.4-kWh battery pack that provides an EPA-estimated range of 250 miles. It can be charged from 10% to 80% in about 38 minutes using a DC fast charger.
The ID.4 is available in two trim levels: Pro and Pro S. The Pro starts at $41,190 and the Pro S starts at $45,190. Both trim levels come standard with a 10.25-inch digital instrument cluster, a 10.0-inch touchscreen infotainment system, and a panoramic sunroof. The ID.4 is a spacious SUV that can seat up to five passengers. The cargo space is 30.3 cubic feet behind the rear seats and 64.2 cubic feet with the rear seats folded down. The ID.4 is available with a variety of driver-assistance features, including forward-collision warning with automatic emergency braking, lane departure warning, and adaptive cruise control.
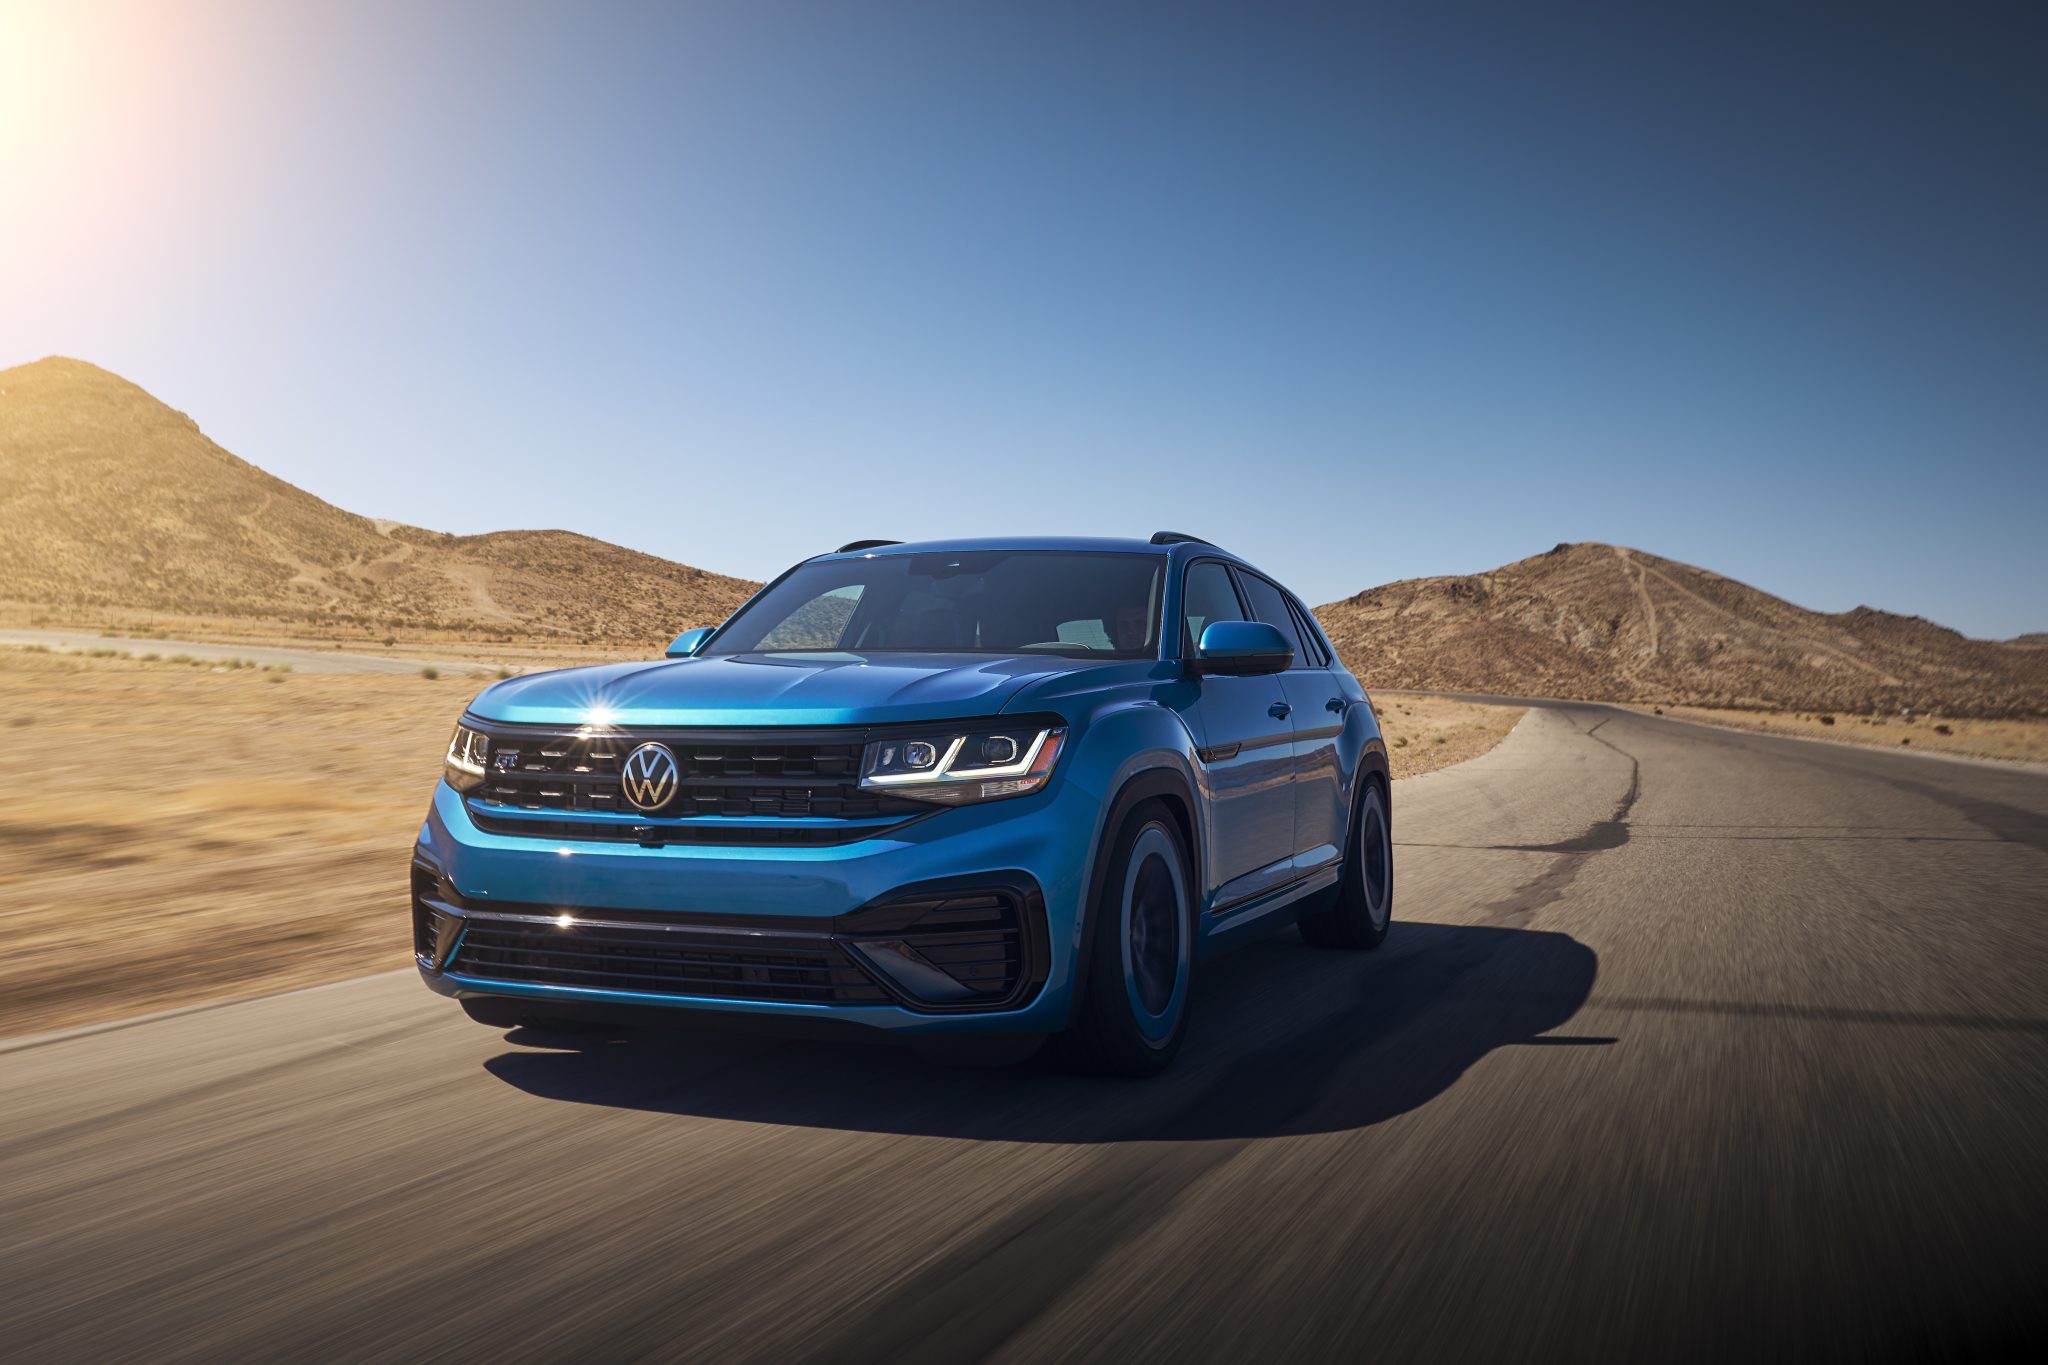
Volkswagen Atlas
Starting at $37,725
The Volkswagen Atlas is a mid-size SUV that was first introduced in 2017. It is the largest SUV in Volkswagen’s lineup and is known for its spacious interior and third-row seating. The Atlas is available in three trim levels: SE, SE with Technology, and SEL Premium. All Atlas models are powered by a 3.6-liter V6 engine that produces 276 horsepower and 266 lb-ft of torque. It is paired with an eight-speed automatic transmission and can tow up to 5,000 pounds. The Atlas has a spacious interior that can seat up to seven passengers. The cargo space is 20.6 cubic feet behind the third row, 77.8 cubic feet with the third row folded down, and 114.1 cubic feet with the second and third rows folded down.
The Atlas comes standard with a variety of features, including a 6.5-inch touchscreen infotainment system, a rearview camera, and Bluetooth connectivity. Available features include a 12.3-inch digital instrument cluster, a 10.25-inch touchscreen infotainment system, a panoramic sunroof, and a JBL sound system. The Atlas is available with a variety of driver-assistance features, including forward-collision warning with automatic emergency braking, lane departure warning, and adaptive cruise control.
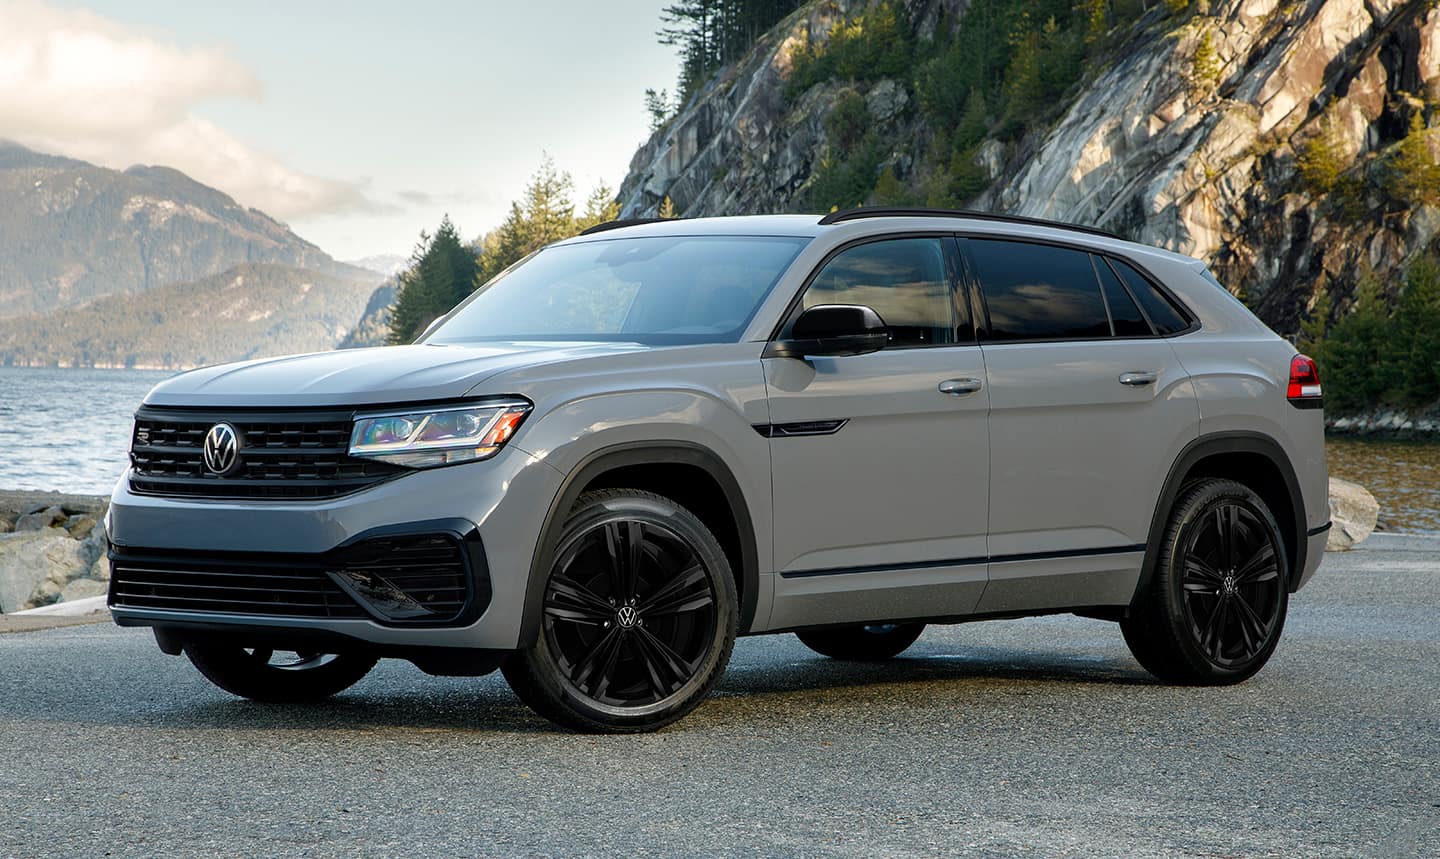
Volkswagen Atlas Cross Sport
Starting at $36,715
The Volkswagen Atlas Cross Sport is a mid-size SUV that was introduced in 2020. It is a more stylish and athletic version of the Atlas SUV. The Atlas Cross Sport is available in three trim levels: SE, SE with Technology, and SEL Premium. All Atlas Cross Sport models are powered by a 2.0-liter turbocharged four-cylinder engine that produces 235 horsepower and 258 lb-ft of torque. It is paired with an eight-speed automatic transmission and can tow up to 2,500 pounds.
The Atlas Cross Sport has a sleeker and more stylish design than the Atlas SUV. It also has a shorter wheelbase, which gives it a more agile feel. The Atlas Cross Sport has a spacious interior that can seat up to seven passengers. The cargo space is 27.2 cubic feet behind the third row, 65.3 cubic feet with the third row folded down, and 101.1 cubic feet with the second and third rows folded down. The Atlas Cross Sport comes standard with a variety of features, including a 6.5-inch touchscreen infotainment system, a rearview camera, and Bluetooth connectivity. Available features include a 10.25-inch touchscreen infotainment system, a panoramic sunroof, and a JBL sound system.

Volkswagen Tiguan
Starting at $26,950
The Volkswagen Tiguan is a compact SUV that was first introduced in 2007. It is the best-selling Volkswagen model in the United States and has been praised for its comfortable ride, spacious interior, and fuel-efficiency. The Tiguan is available in four trim levels: S, SE, SE R-Line, and SEL Premium. The S starts at $26,950, the SE starts at $29,390, the SE R-Line starts at $32,790, and the SEL Premium starts at $37,290. All Tiguan models are powered by a 2.0-liter turbocharged four-cylinder engine that produces 184 horsepower and 221 lb-ft of torque. It is paired with an eight-speed automatic transmission and can tow up to 1,500 pounds.
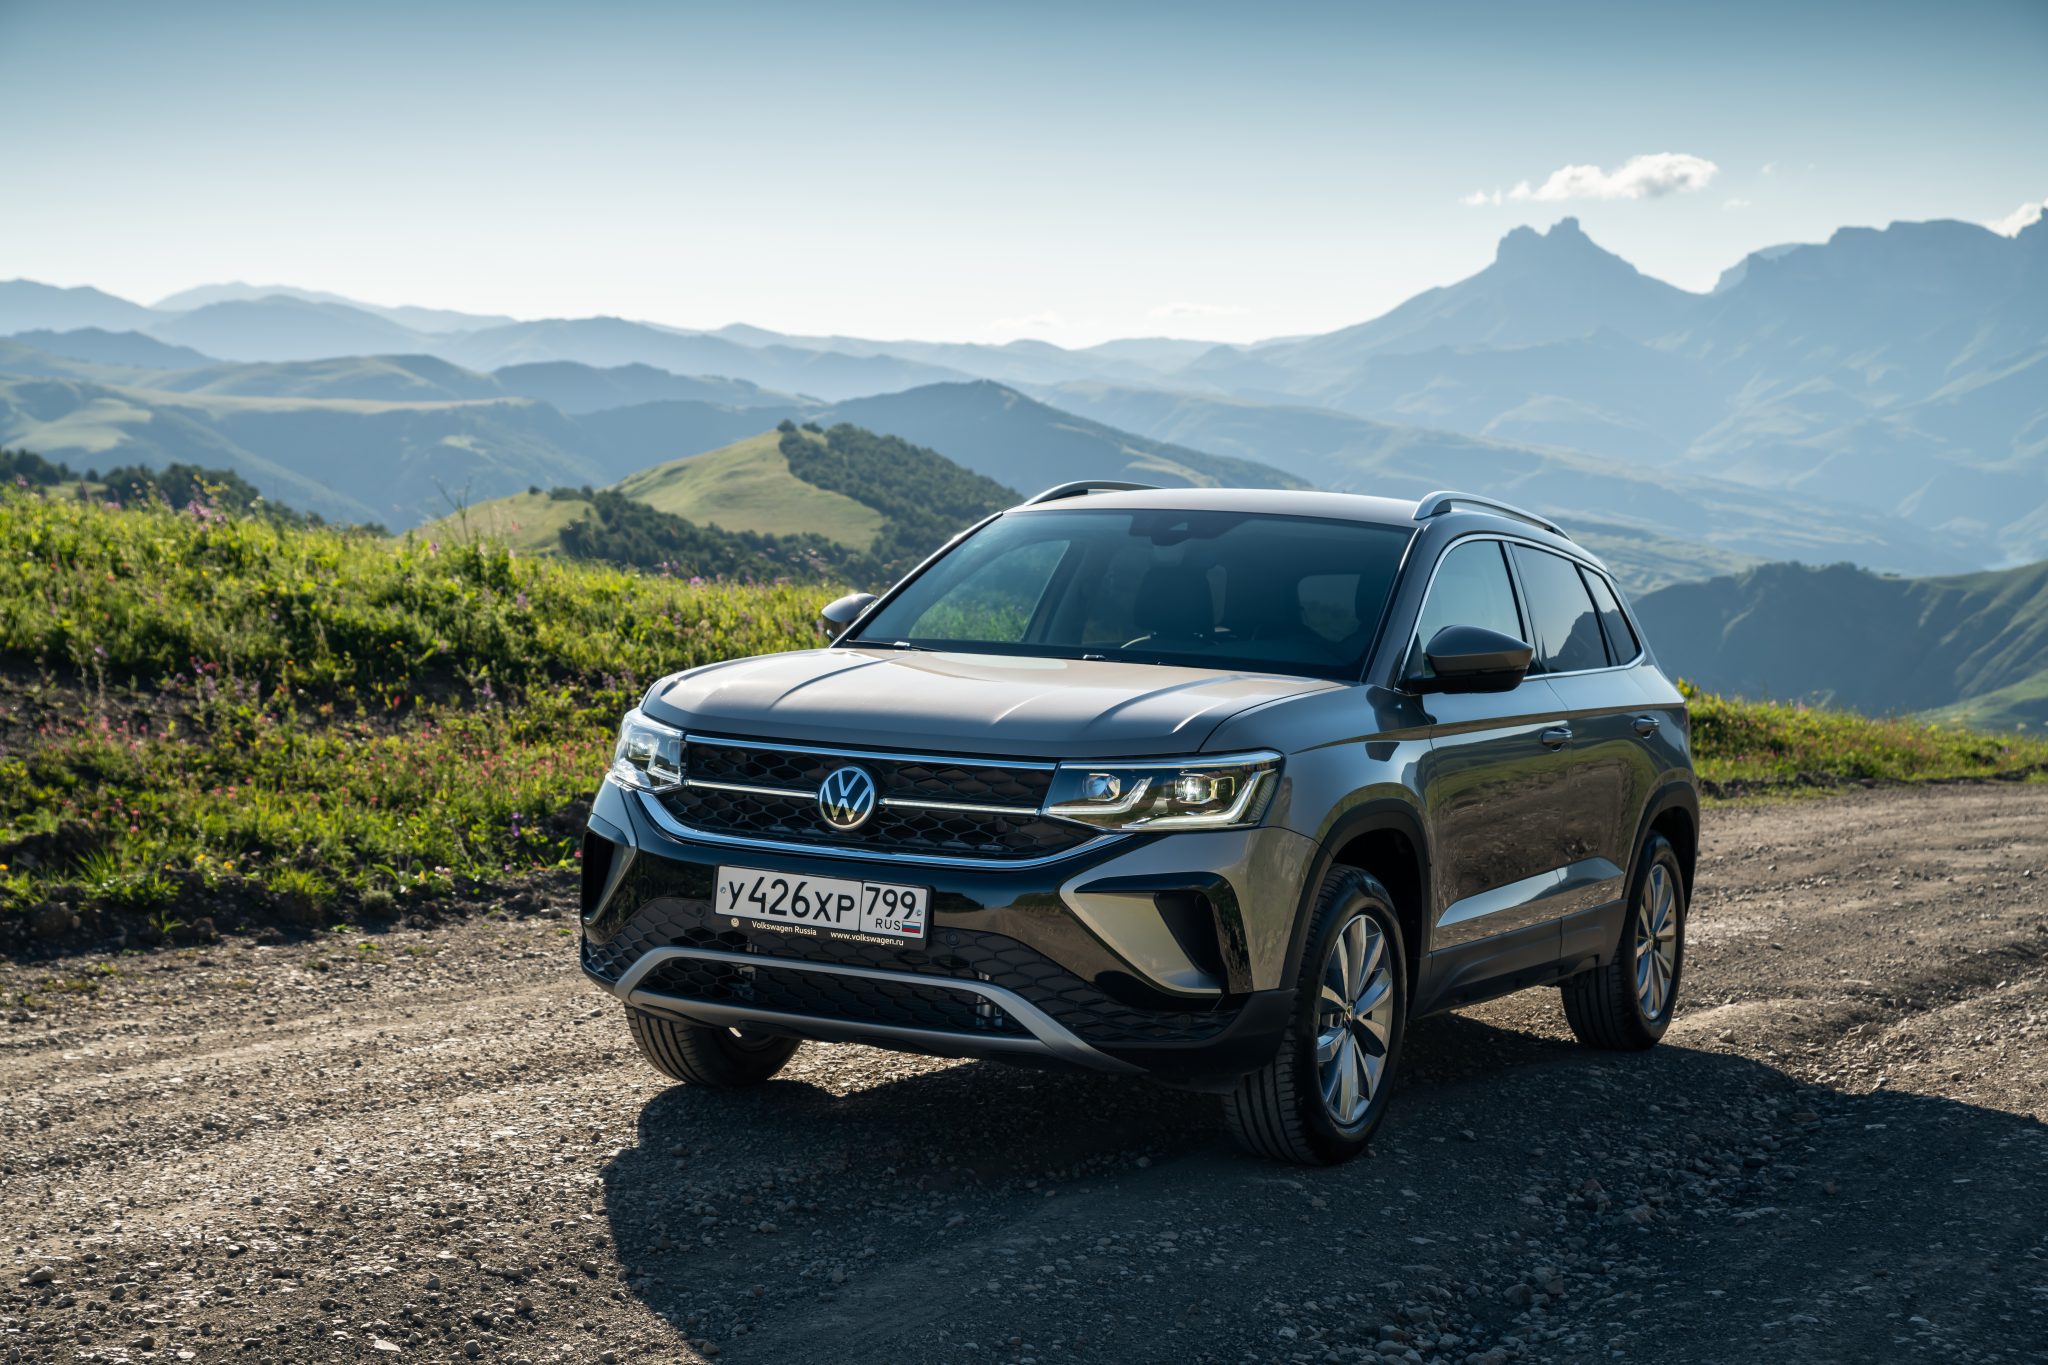
Volkswagen Taos
Starting at $24,155
The Volkswagen Taos is a subcompact SUV that was introduced in 2021. It is the smallest SUV in Volkswagen’s lineup and is known for its comfortable ride, spacious interior, and fuel-efficiency. The Taos is available in three trim levels: S, SE, and SEL. The S starts at $24,155, the SE starts at $26,795, and the SEL starts at $29,995. All Taos models are powered by a 1.5-liter turbocharged four-cylinder engine that produces 158 horsepower and 184 lb-ft of torque. It is paired with an eight-speed automatic transmission and can tow up to 1,500 pounds.
The Taos has a spacious interior that can seat up to five passengers. The cargo space is 27.9 cubic feet behind the rear seats and 65.9 cubic feet with the rear seats folded down. The Taos comes standard with a variety of features, including a 6.5-inch touchscreen infotainment system, a rearview camera, and Bluetooth connectivity. Available features include a 10.25-inch touchscreen infotainment system, a panoramic sunroof, and a JBL sound system. The Taos is available with a variety of driver-assistance features, including forward-collision warning with automatic emergency braking, lane departure warning, and adaptive cruise control.
The Volkswagen Taos is a good choice for those who are looking for a comfortable and spacious SUV. It is also a good value for the price.
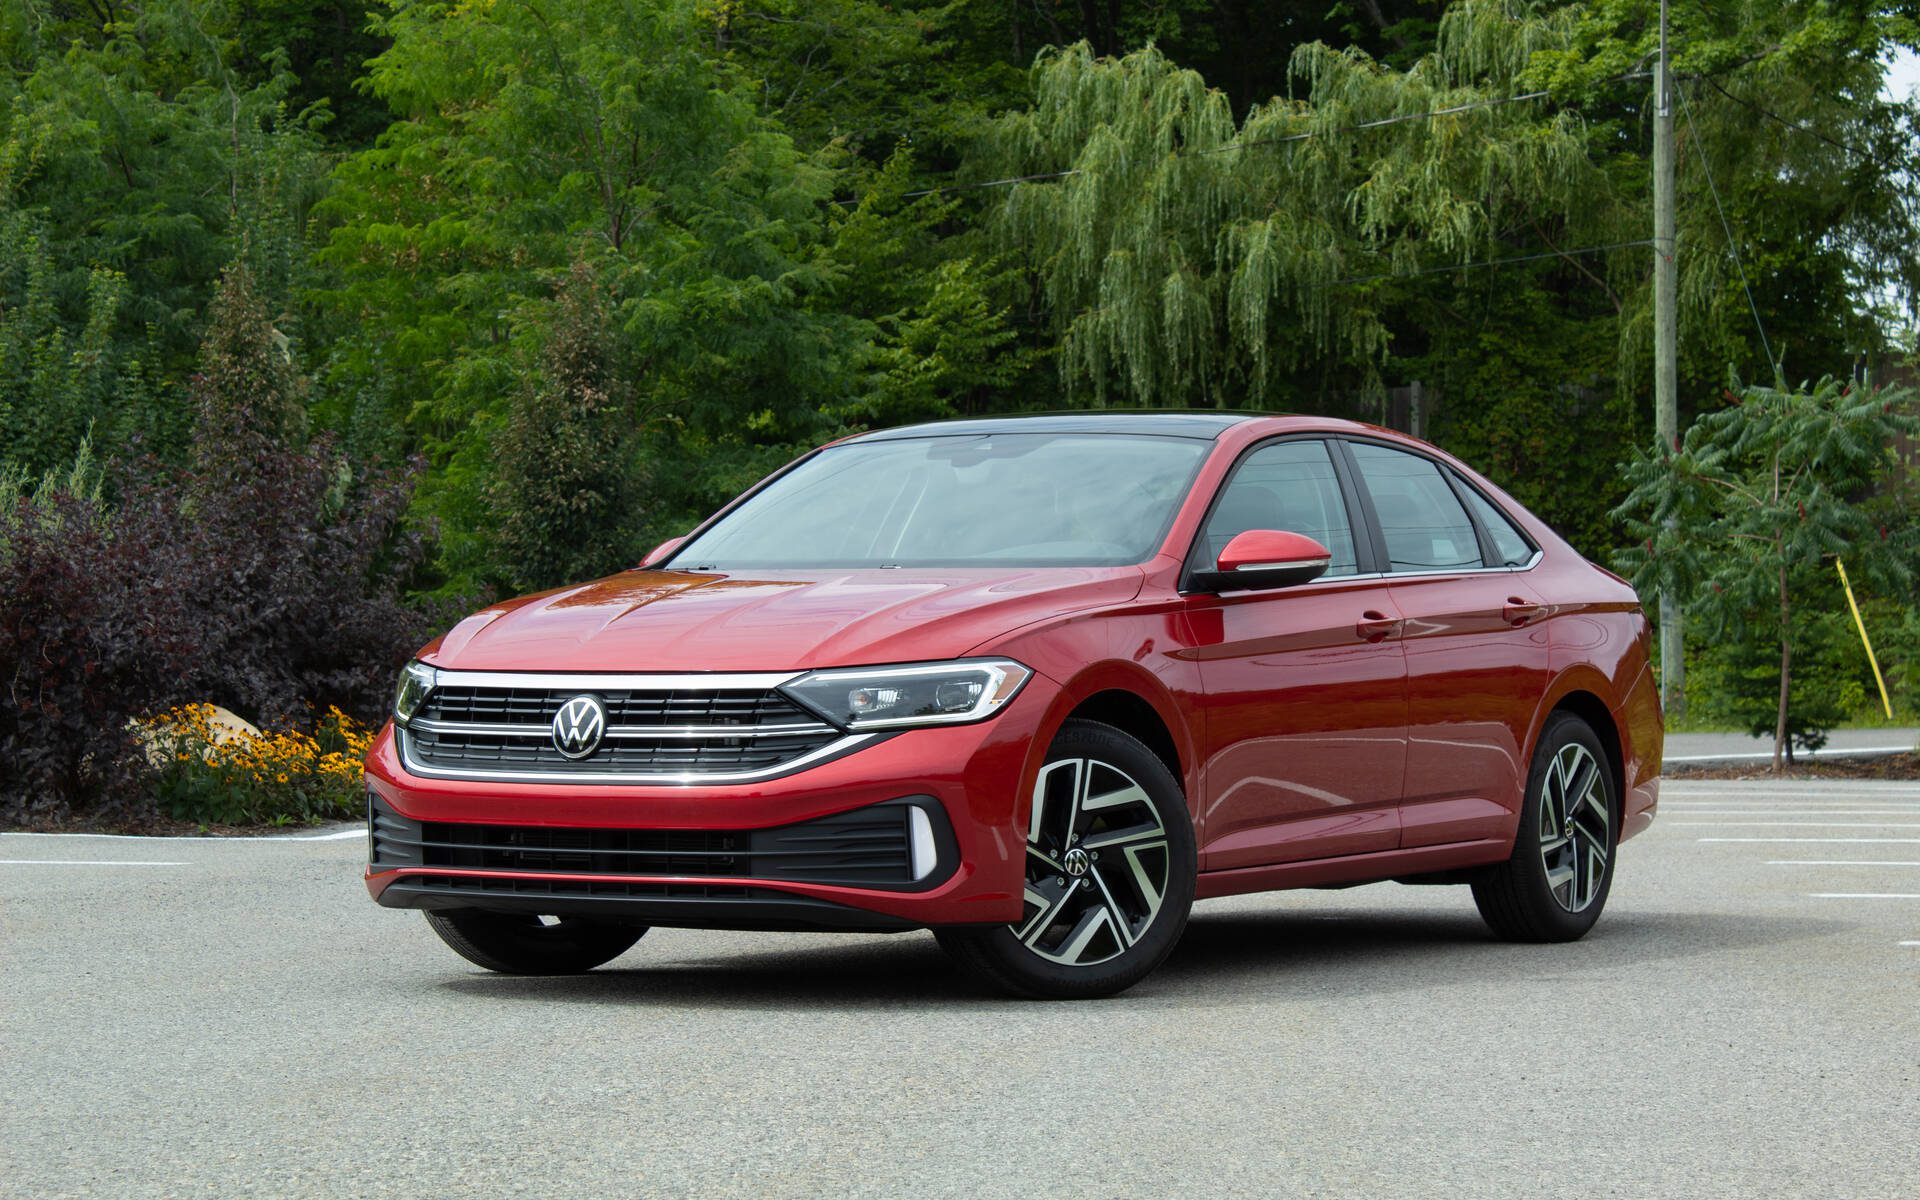
Volkswagen Jetta
Starting at $20,665
The current Volkswagen Jetta is a compact car that was introduced in 2022. It is the eighth generation of the Jetta and is known for its fuel-efficiency and sporty handling. The Jetta is available in three trim levels: S, SE, and GLI. The S starts at $20,655, the SE starts at $23,415, and the GLI starts at $29,995. All Jetta models are powered by a 1.5-liter turbocharged four-cylinder engine that produces 158 horsepower and 184 lb-ft of torque. It is paired with an eight-speed automatic transmission. The Jetta has a comfortable ride and handles well for a car in its class. It also gets good fuel economy, with an EPA-estimated 29 mpg in the city and 42 mpg on the highway.
The Jetta comes standard with a variety of features, including a 6.5-inch touchscreen infotainment system, a rearview camera, and Bluetooth connectivity. Available features include a 10.25-inch touchscreen infotainment system, a panoramic sunroof, and a JBL sound system. The Jetta is available with a variety of driver-assistance features, including forward-collision warning with automatic emergency braking, lane departure warning, and adaptive cruise control. The Volkswagen Jetta is a good choice for those who are looking for a fuel-efficient and sporty car. It is also a good value for the price.
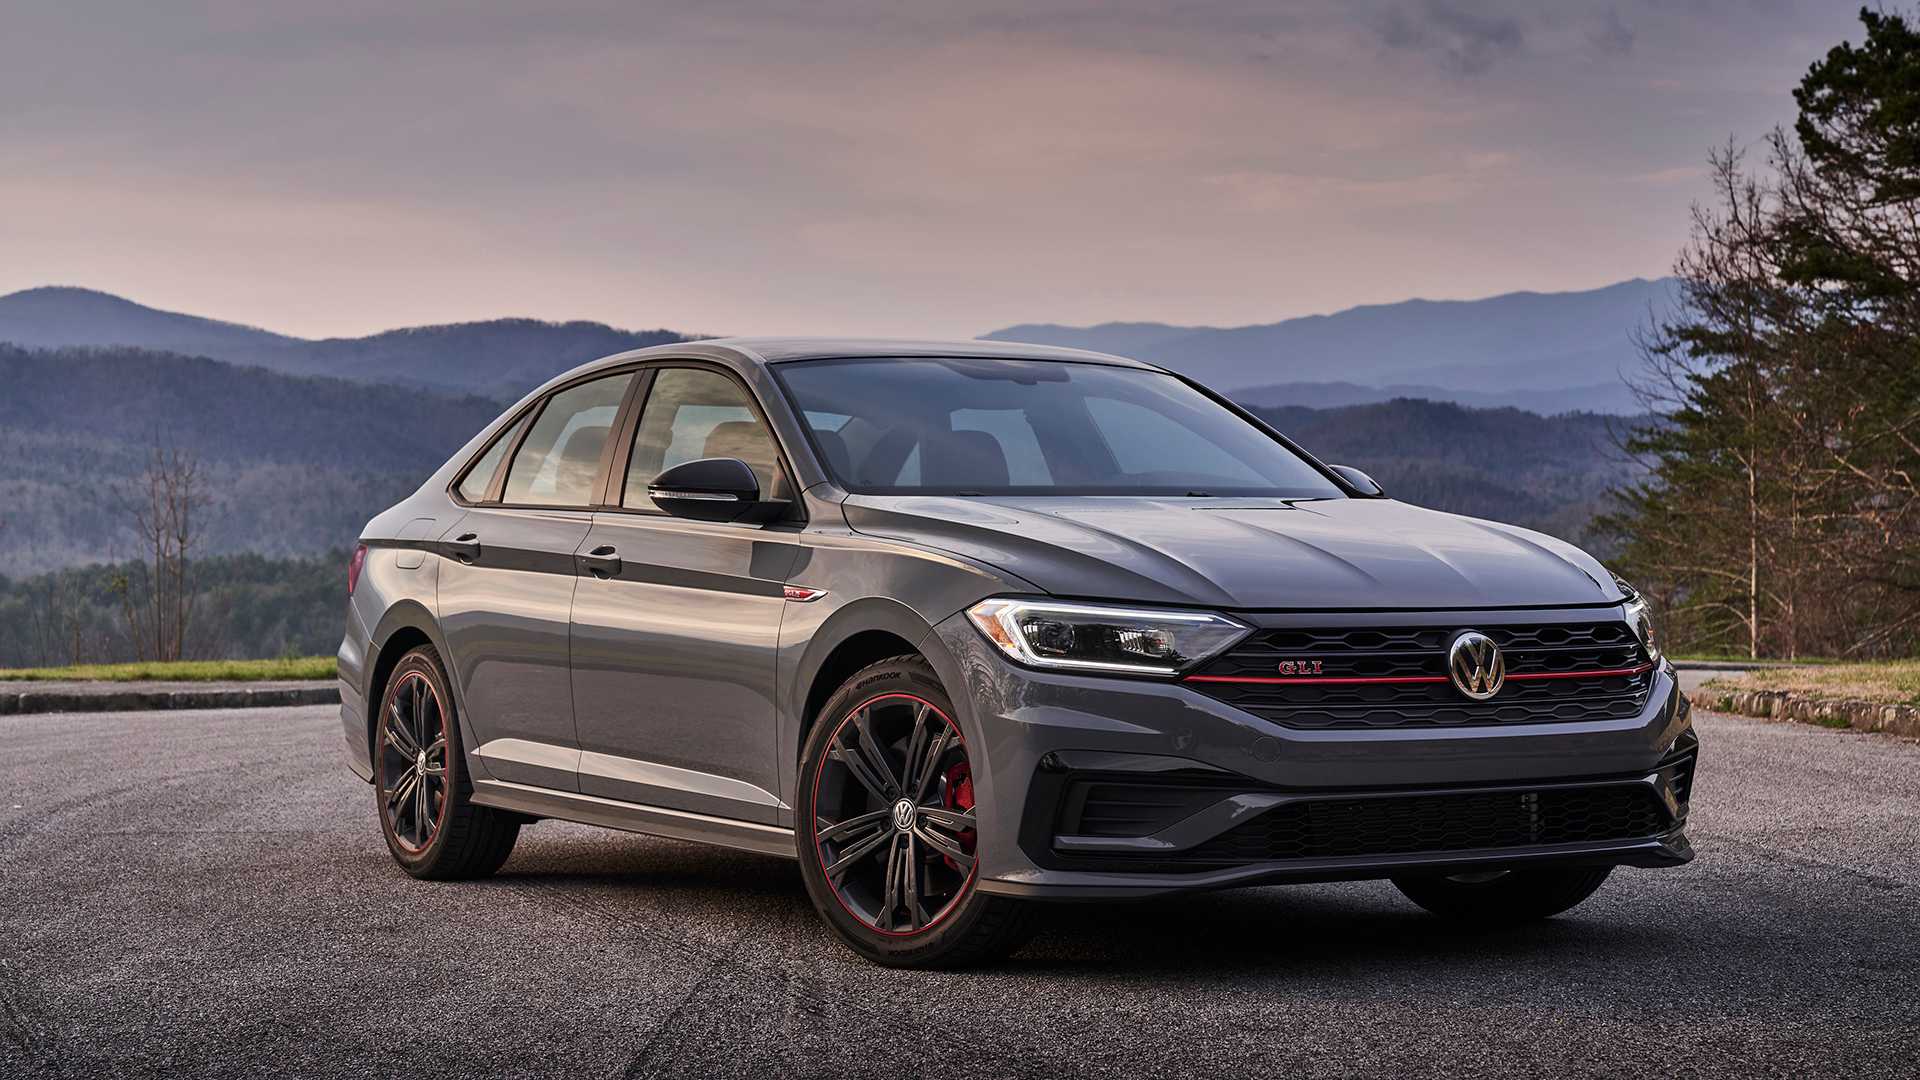
Volkswagen Jetta GLI
Starting at $31,585
The current Volkswagen Jetta GLI is a compact car that was introduced in 2022. It is a performance version of the Jetta that is powered by a turbocharged 2.0-liter four-cylinder engine that produces 228 horsepower and 258 lb-ft of torque. It is paired with a six-speed manual transmission or a seven-speed dual-clutch automatic transmission. The Jetta GLI has a sport-tuned suspension and steering system that give it a more engaging driving experience than the regular Jetta. It also gets slightly better fuel economy, with an EPA-estimated 26 mpg in the city and 37 mpg on the highway. The Volkswagen Jetta GLI is a good choice for those who are looking for a sporty and fuel-efficient car.
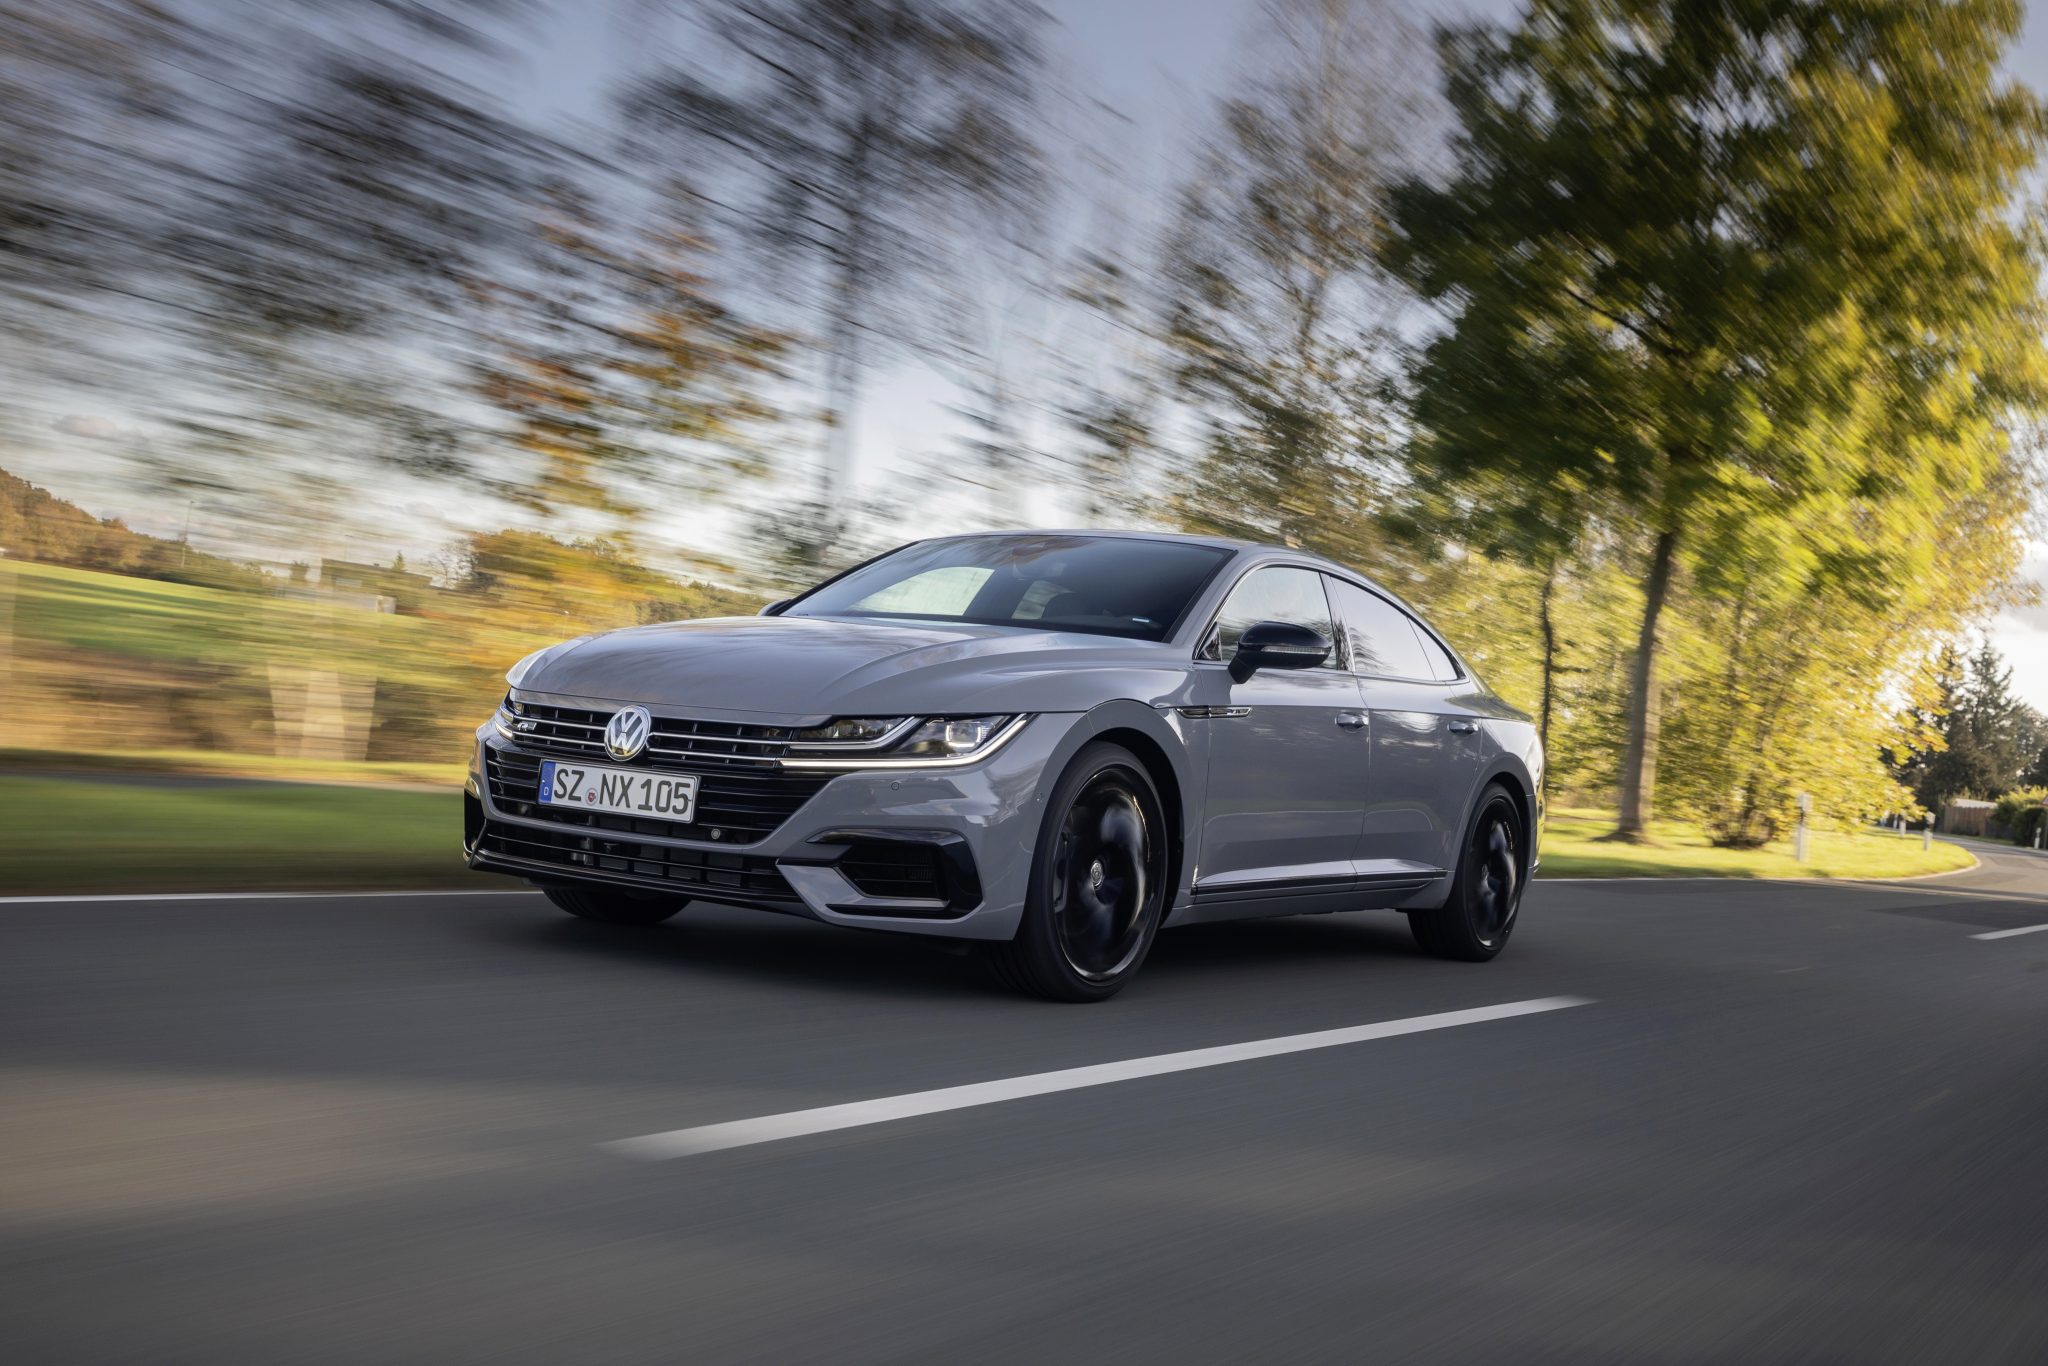
Volkswagen Arteon
Starting at $43,010
The current Volkswagen Arteon is a mid-size fastback that was introduced in 2019. It is the successor to the CC and is known for its stylish design and comfortable ride. The Arteon is available in two trim levels: SE and SEL Premium. The SE starts at $41,245 and the SEL Premium starts at $45,245. All Arteon models are powered by a turbocharged 2.0-liter four-cylinder engine that produces 268 horsepower and 258 lb-ft of torque. It is paired with an eight-speed automatic transmission and can tow up to 1,500 pounds.
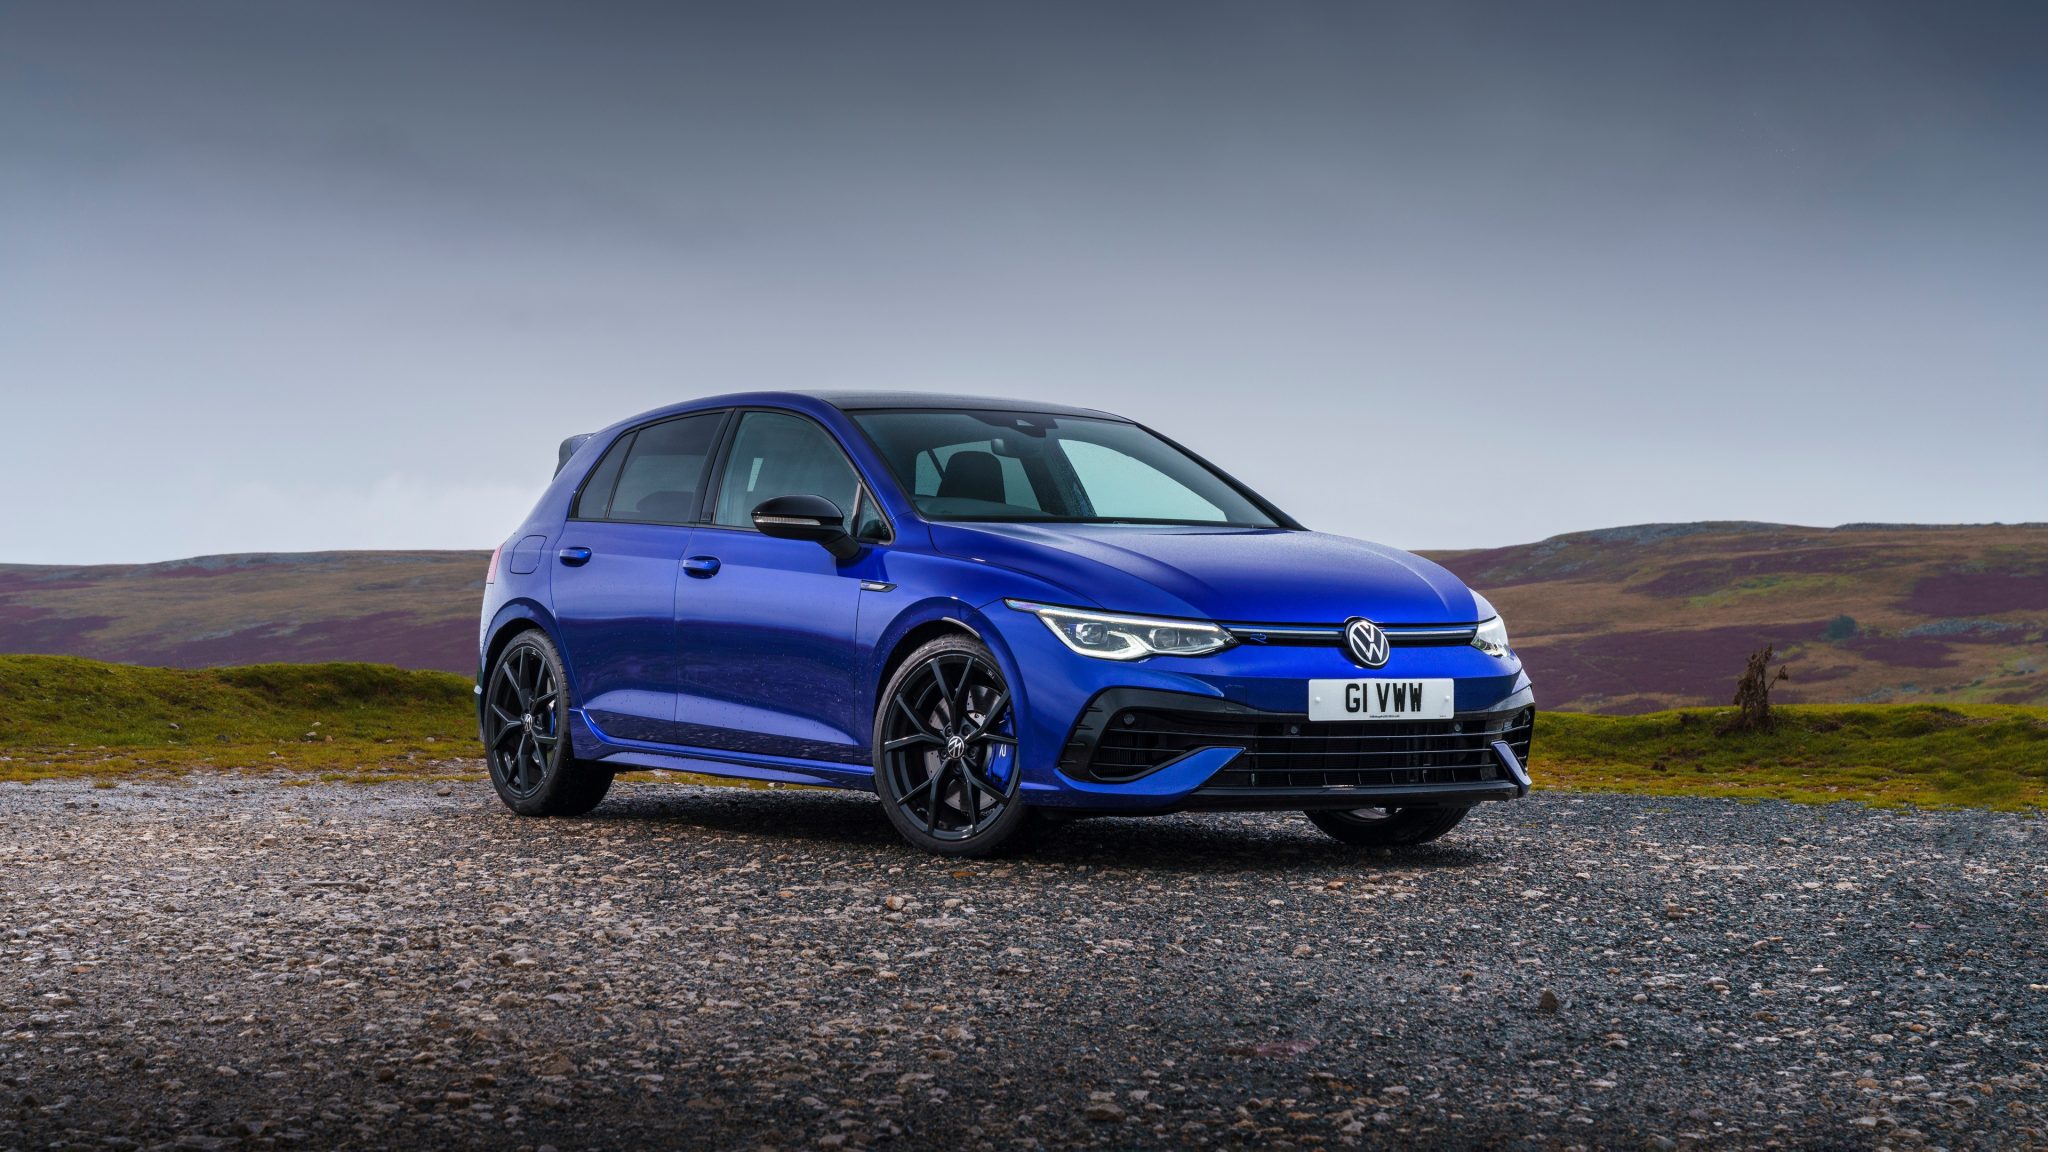
Volkswagen Golf R
Starting at $44,740
The Volkswagen Golf R is a hot hatchback that was introduced in 2022. It is the most powerful and performance-oriented version of the Golf hatchback. The Golf R is powered by a turbocharged 2.0-liter four-cylinder engine that produces 315 horsepower and 295 lb-ft of torque. It is paired with a seven-speed dual-clutch automatic transmission and all-wheel drive. The Golf R can go from 0 to 60 mph in 4.6 seconds and has a top speed of 155 mph. It also has a sport-tuned suspension and steering system that give it a more engaging driving experience than the regular Golf. The Golf R comes standard with a variety of features, including a 10.25-inch touchscreen infotainment system, a rearview camera, and Bluetooth connectivity. Available features include a panoramic sunroof, a JBL sound system, and a head-up display. The name “Golf R” comes from the “R” line of Volkswagen performance vehicles. The “R” line was introduced in 1974 with the Golf GTI, and it has since been applied to a variety of other Volkswagen models, including the Scirocco, Beetle, and Tiguan.
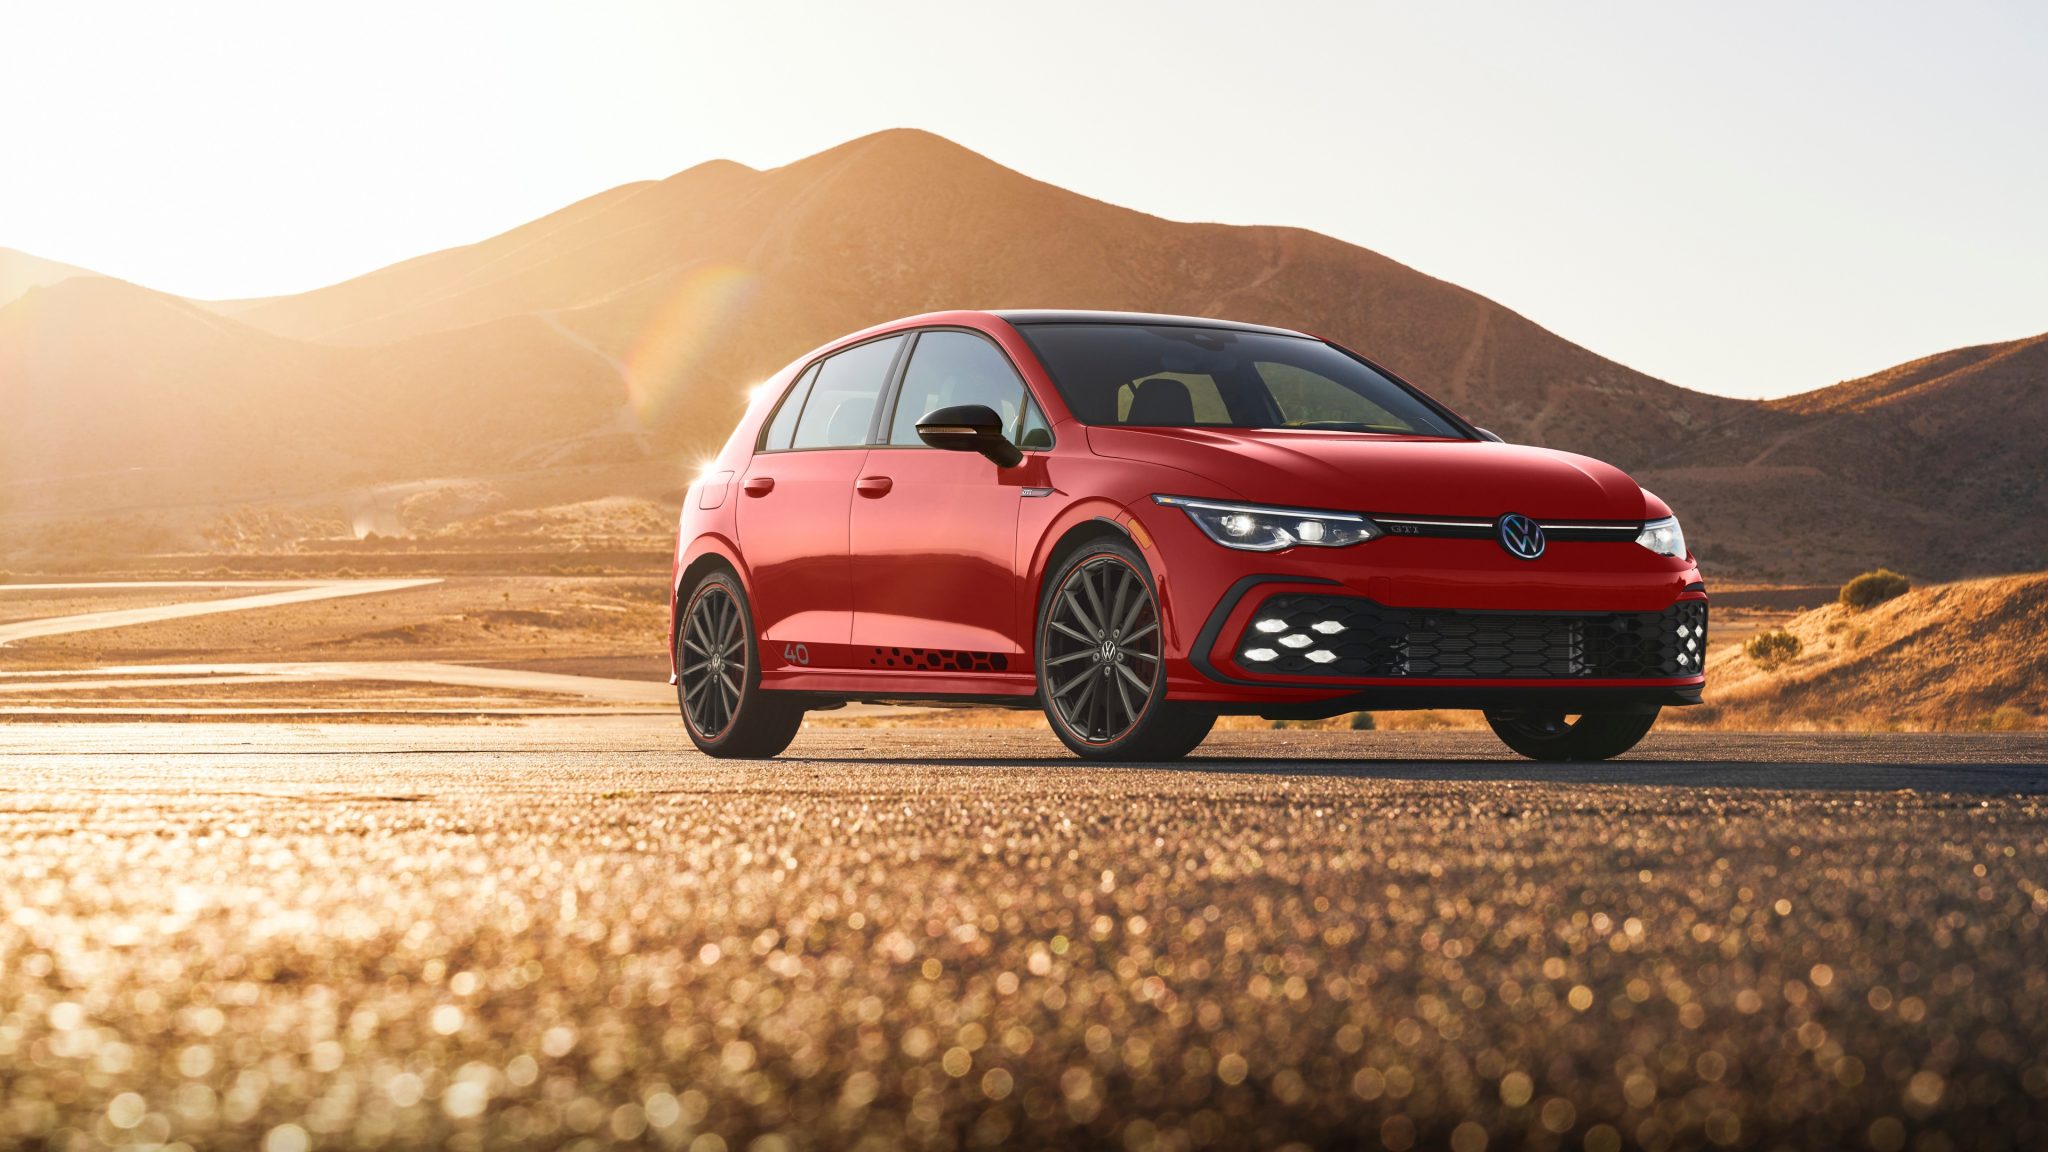
Volkswagen Golf GTI
Starting at $30,530
The Volkswagen Golf GTI is a hot hatchback that was introduced in 1974. It is the most popular and successful version of the Golf hatchback, and it is known for its combination of performance, handling, and fuel efficiency. The Golf GTI is powered by a turbocharged 2.0-liter four-cylinder engine that produces 241 horsepower and 273 lb-ft of torque. It is paired with a six-speed manual transmission or a seven-speed dual-clutch automatic transmission. The Golf GTI can go from 0 to 60 mph in 5.8 seconds and has a top speed of 155 mph. It also has a sport-tuned suspension and steering system that give it a more engaging driving experience than the regular Golf. The name “GTI” stands for “Grand Tourismo Injection”. The GTI was the first mass-produced hot hatchback, and it has inspired a number of other hot hatchbacks, including the Honda Civic Si, the Ford Focus ST, and the Mazda3 Mazdaspeed3.
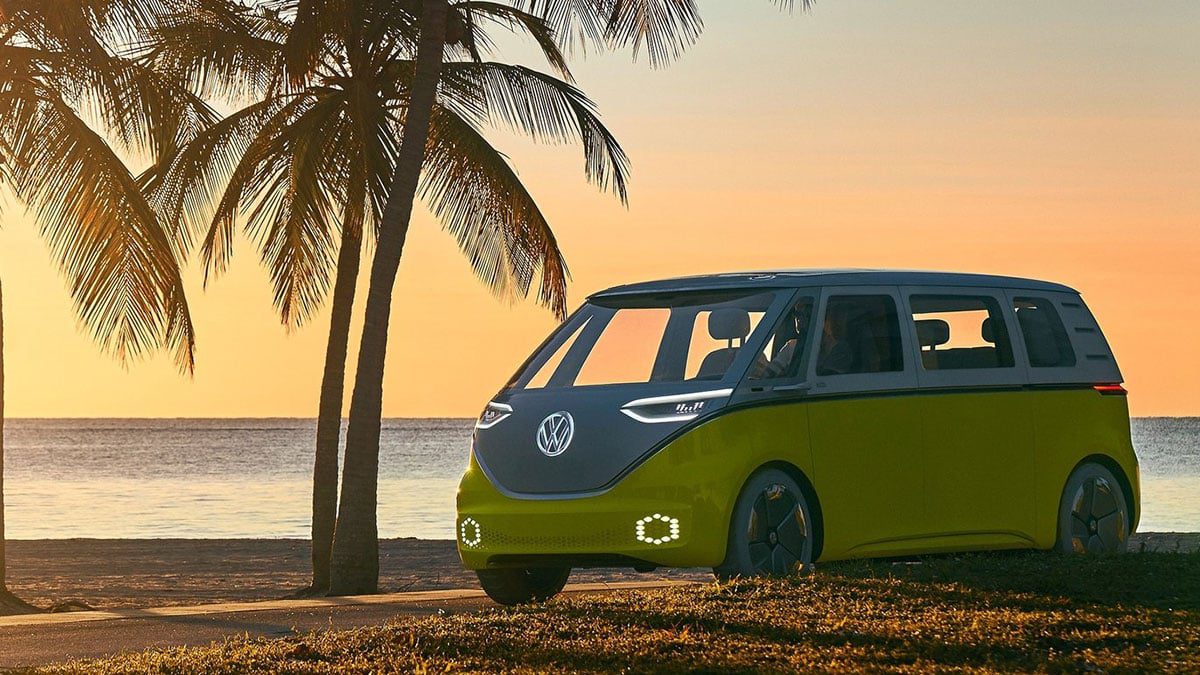
Volkswagen ID. Buzz
Coming 2024
The Volkswagen ID. Buzz is an all-electric van that was introduced in 2022. It is based on the Volkswagen MEB platform, which also underpins the ID.4 SUV. The ID. Buzz is powered by a 77.4-kWh battery pack that provides an EPA-estimated range of 250 miles. It can be charged from 5% to 80% in about 30 minutes using a DC fast charger. The ID. Buzz is available in two body styles: a passenger van and a cargo van. The passenger van can seat up to seven passengers, while the cargo van can hold up to 1,411 cubic feet of cargo. The Volkswagen ID. Buzz is a good choice for those who are looking for an all-electric van with a spacious interior and a long range. It is also a good value for the price. The ID. Buzz is a modern take on the classic Volkswagen Microbus. It has a similar boxy shape and rounded headlights, but it is updated with modern features and technology. The ID. Buzz is also available in a variety of colors, including two-tone combinations.
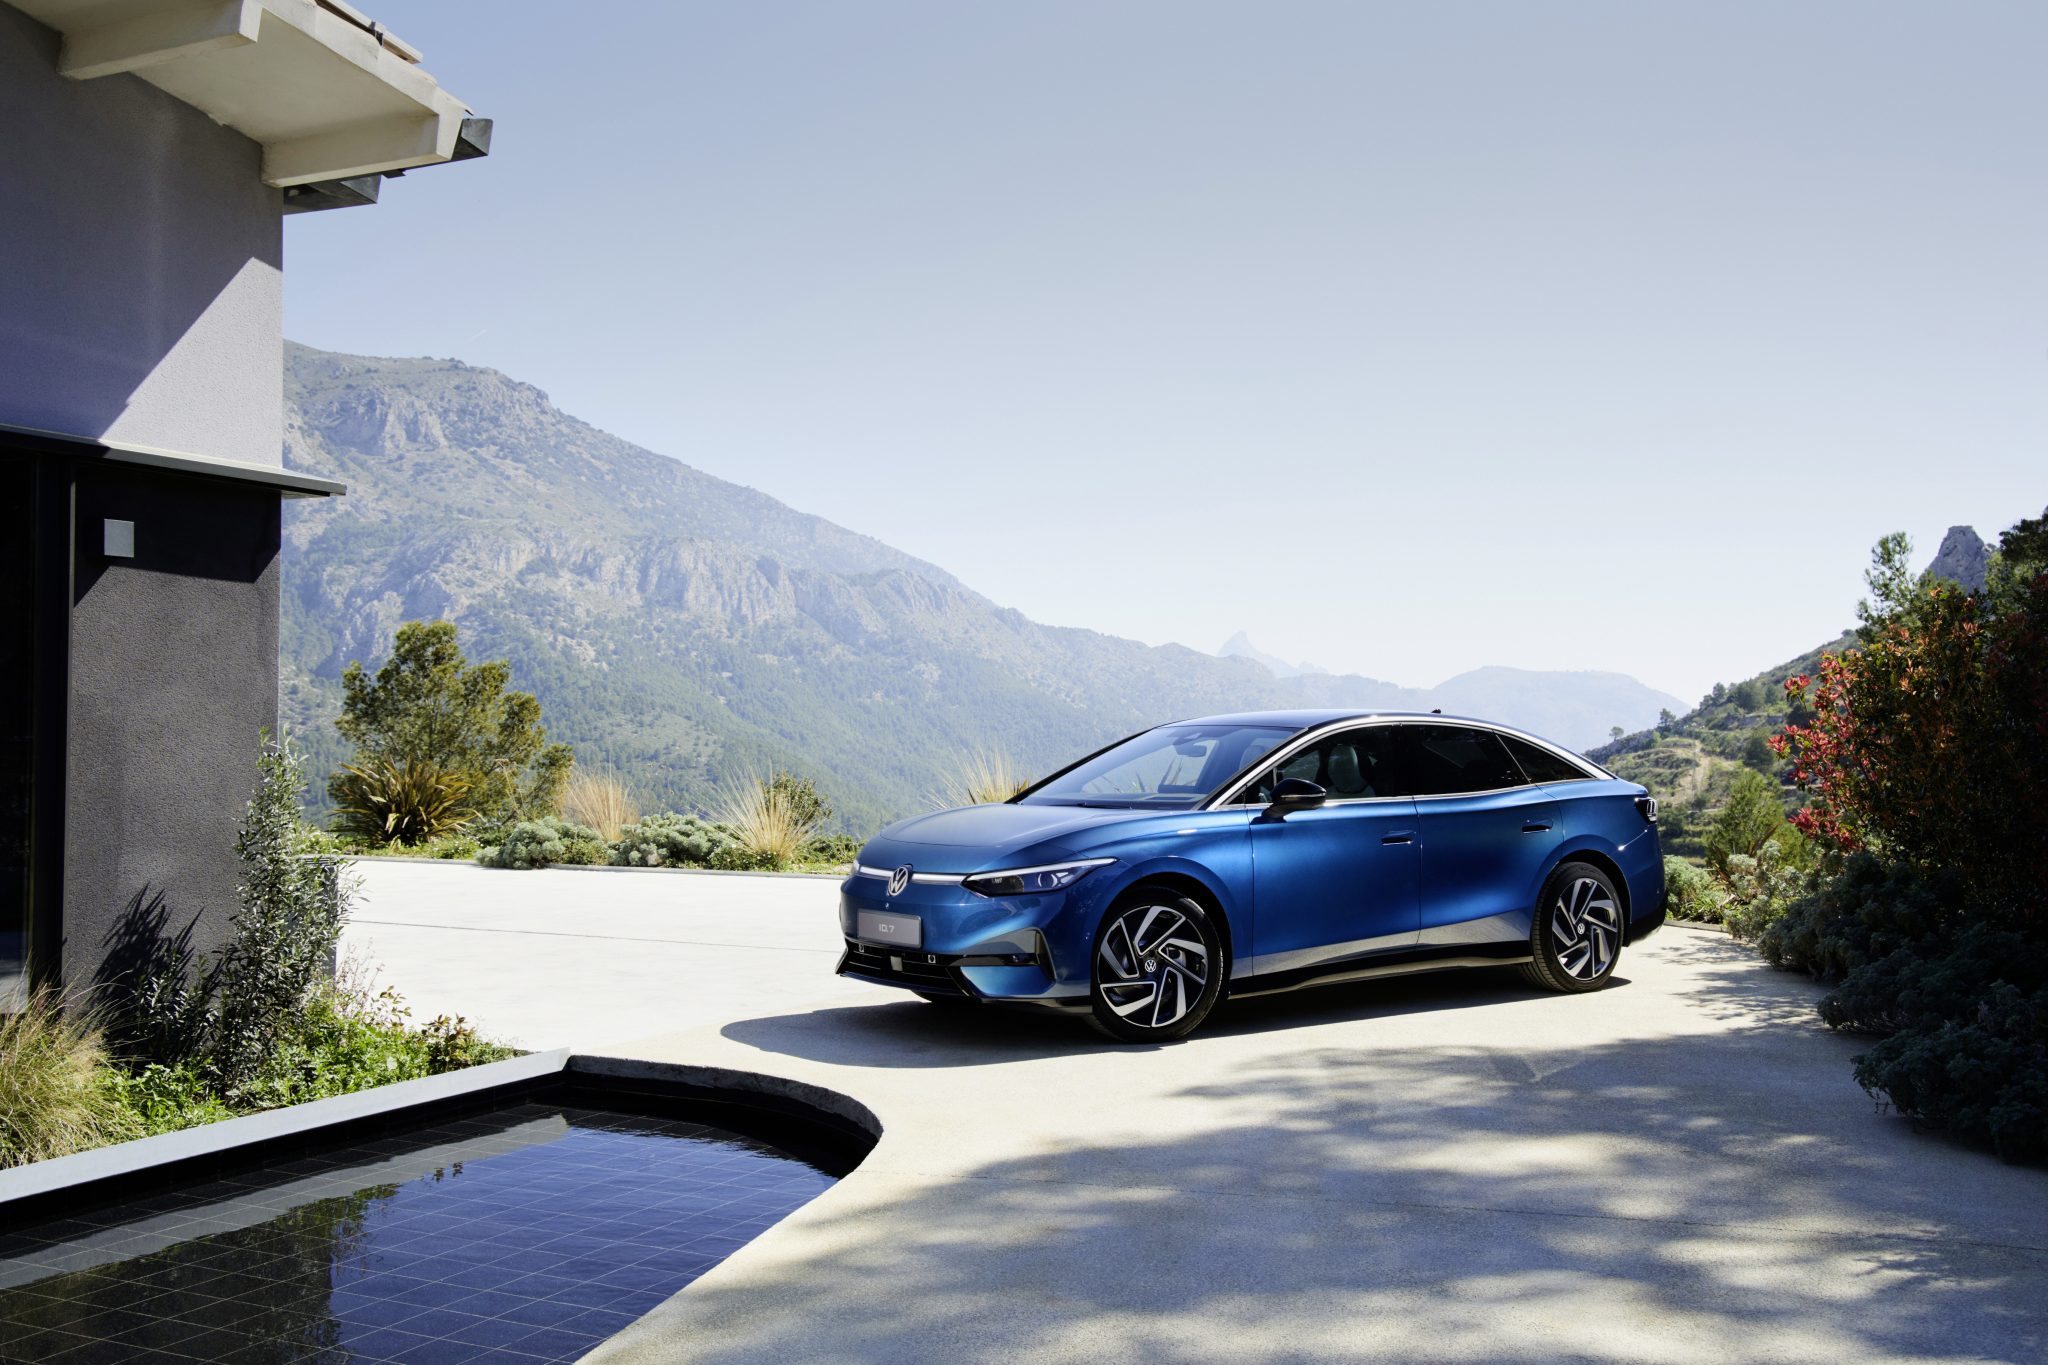
Volkswagen ID. 7
Coming 2024
The Volkswagen ID. 7 is a full-size electric sedan that will be introduced in 2024. It is based on the Volkswagen MEB platform, which also underpins the ID.4 SUV and ID. Buzz van. The ID. 7 will be available in two versions: a rear-wheel-drive version with a 77.4-kWh battery pack and a dual-motor all-wheel-drive version with a 107.8-kWh battery pack. The rear-wheel-drive version is expected to have an EPA-estimated range of 330 miles, while the dual-motor all-wheel-drive version is expected to have an EPA-estimated range of 280 miles.
The ID. 7 will be available in two body styles: a fastback and a wagon. The fastback will have a sloping roofline, while the wagon will have a more traditional roofline. Both body styles will have a spacious interior and a long wheelbase. Overall, the Volkswagen ID. 7 is a good choice for those who are looking for a spacious and comfortable electric sedan. It is also a good value for the price.
The ID. 7 is a modern take on the classic Volkswagen Phaeton. It has a similar long and sleek shape, but it is updated with modern features and technology. The ID. 7 is also available in a variety of colors, including two-tone combinations.


