
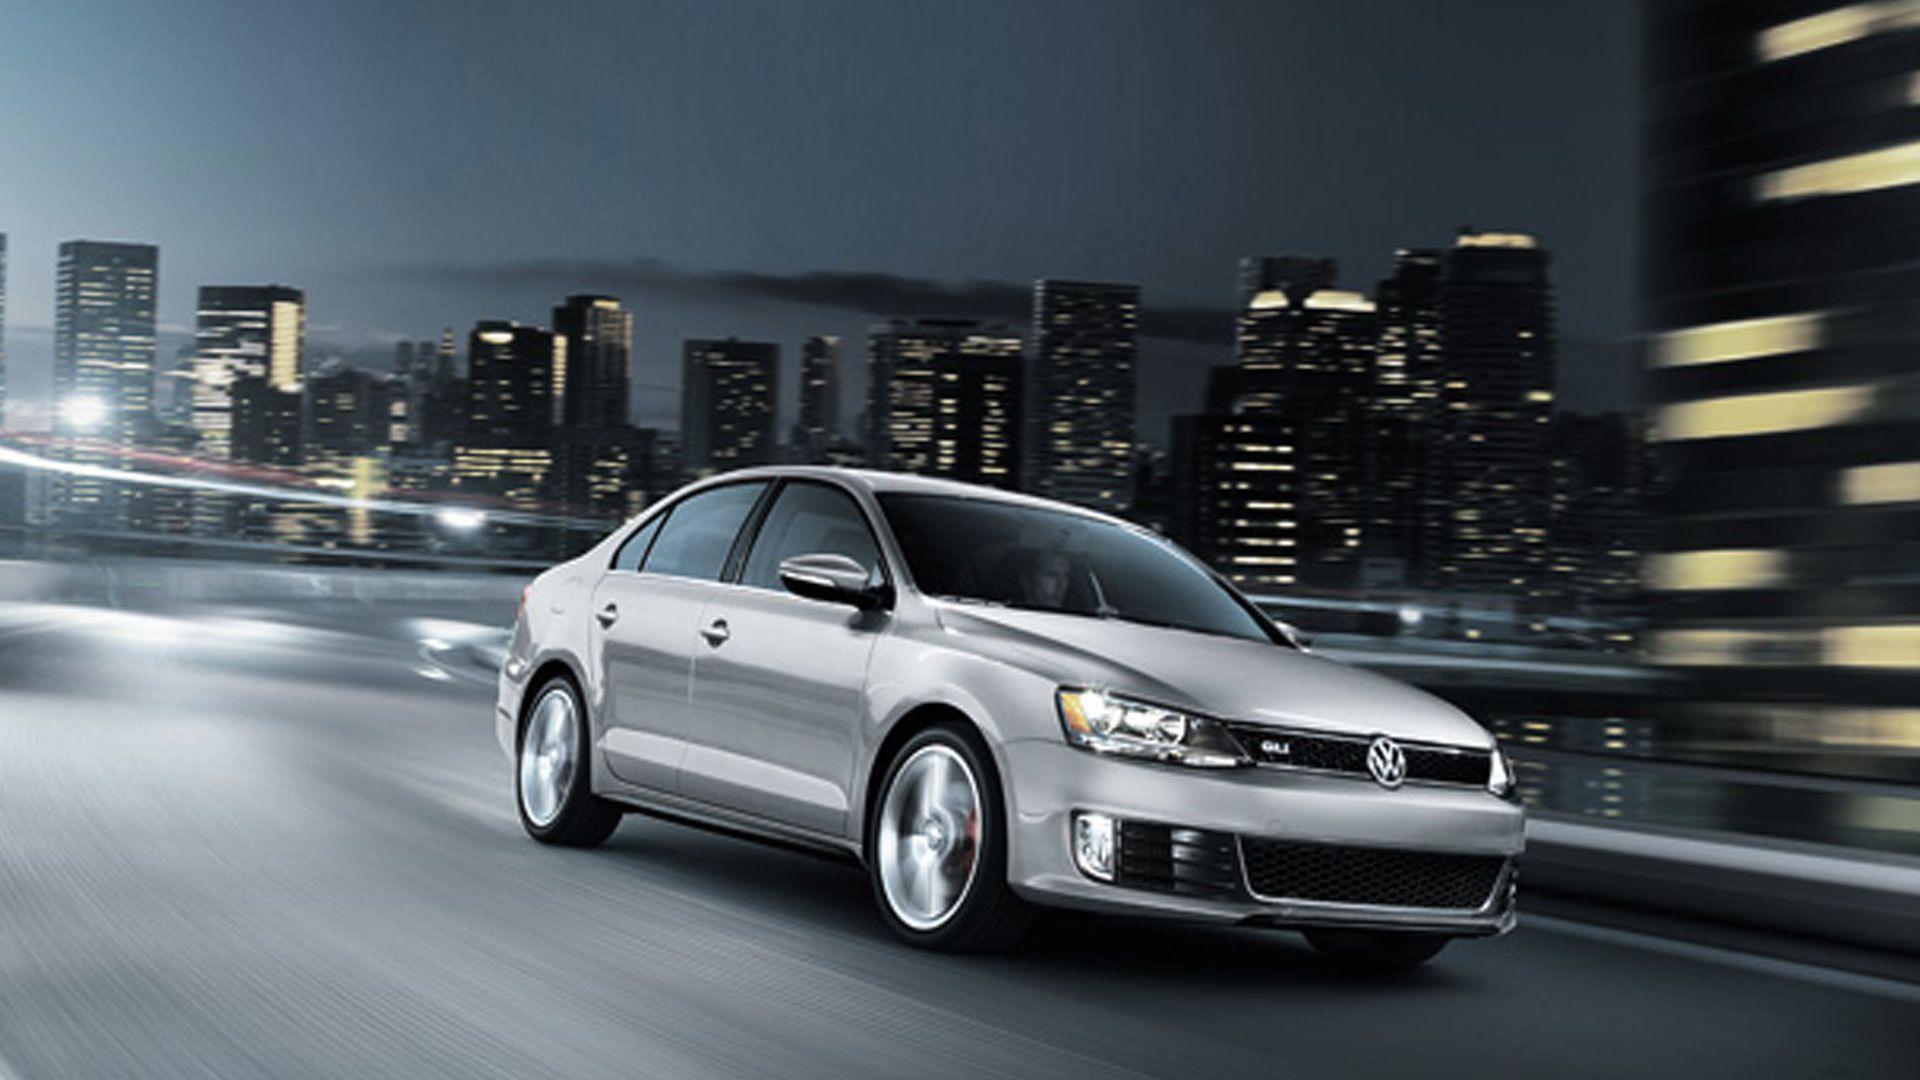
Volkswagen Jetta
The Volkswagen Jetta is a compact sedan that has long been one of Volkswagen’s best-selling models in North America, in effect a Golf with a trunk aimed at buyers who prefer a traditional three-box shape. Here you will find yearly and monthly United States and Canadian sales figures for the Jetta. The current Jetta arrived for the 2019 model year and was refreshed for 2022 and again for 2025, while the sportier Jetta GLI serves as the line’s performance variant.
- Class: Compact sedan
- Base engine: 1.5L turbocharged TSI four-cylinder producing 158 horsepower and 184 lb-ft of torque
- GLI engine: 2.0L turbocharged TSI four-cylinder producing 228 horsepower and 258 lb-ft of torque
- Transmission: 6-speed manual or 8-speed automatic (Jetta); 6-speed manual or 7-speed DSG (GLI)
- Drivetrain: Front-wheel drive
- Seating: 5 passengers
- EPA fuel economy: Up to 31 city / 41 highway / 35 combined mpg (Jetta automatic)
- Chief rivals: Honda Civic, Toyota Corolla, and Hyundai Elantra
Volkswagen Jetta Sales in the United States
The Jetta has been a fixture of the United States compact-sedan market for two decades. Volume swelled during the small-car boom of the early 2010s, reaching a peak of 183,262 units in 2012, then trended lower across the decade as buyers shifted toward crossovers. After bottoming at 34,032 in 2022, the Jetta rebounded to 47,407 in 2023 and 71,830 in 2024 before easing to 53,927 in 2025. Through June 2026 Volkswagen had delivered 27,514 Jettas, running about 15 percent behind the same point in 2025.
Volkswagen Jetta, United States calendar-year unit sales, 2005–2026. 2026 is January–Jun (partial).
Annual sales
| Year | Units | YoY |
|---|---|---|
| 2005 | 104,063 | — |
| 2006 | 103,331 | ▼ 0.7% |
| 2007 | 98,951 | ▼ 4.2% |
| 2008 | 97,461 | ▼ 1.5% |
| 2009 | 108,427 | ▲ 11.3% |
| 2010 | 123,213 | ▲ 13.6% |
| 2011 | 177,358 | ▲ 43.9% |
| 2012 | 183,262 | ▲ 3.3% |
| 2013 | 163,793 | ▼ 10.6% |
| 2014 | 160,873 | ▼ 1.8% |
| 2015 | 131,109 | ▼ 18.5% |
| 2016 | 121,107 | ▼ 7.6% |
| 2017 | 115,807 | ▼ 4.4% |
| 2018 | 90,794 | ▼ 21.6% |
| 2019 | 100,453 | ▲ 10.6% |
| 2020 | 90,829 | ▼ 9.6% |
| 2021 | 55,113 | ▼ 39.3% |
| 2022 | 34,032 | ▼ 38.3% |
| 2023 | 47,407 | ▲ 39.3% |
| 2024 | 71,830 | ▲ 51.5% |
| 2025 | 53,927 | ▼ 24.9% |
| 2026 (Jan–Jun) | 27,514 | ▼ 14.9% YTD |
Monthly sales
| Year | Jan | Feb | Mar | Apr | May | Jun | Jul | Aug | Sep | Oct | Nov | Dec | Total |
|---|---|---|---|---|---|---|---|---|---|---|---|---|---|
| 2005 | 5,433 | 6,116 | 7,653 | 8,347 | 7,912 | 9,414 | 10,699 | 10,277 | 9,778 | 7,549 | 8,743 | 12,142 | 104,063 |
| 2006 | 7,436 | 6,763 | 9,588 | 9,930 | 11,027 | 8,601 | 9,712 | 9,870 | 7,383 | 5,580 | 7,188 | 10,253 | 103,331 |
| 2007 | 7,700 | 6,652 | 7,212 | 8,234 | 10,371 | 9,804 | 8,057 | 8,714 | 7,715 | 7,771 | 7,781 | 8,940 | 98,951 |
| 2008 | 6,488 | 6,823 | 8,630 | 7,171 | 8,303 | 8,973 | 9,245 | 11,217 | 8,817 | 7,259 | 6,472 | 8,063 | 97,461 |
| 2009 | 6,238 | 5,983 | 7,391 | 6,021 | 10,597 | 10,413 | 12,078 | 12,872 | 9,568 | 9,076 | 7,957 | 10,233 | 108,427 |
| 2010 | 8,893 | 7,828 | 9,196 | 9,742 | 10,514 | 9,085 | 10,413 | 10,667 | 10,769 | 11,958 | 11,153 | 12,995 | 123,213 |
| 2011 | 11,460 | 12,591 | 16,969 | 16,955 | 16,671 | 17,105 | 15,713 | 14,500 | 15,023 | 13,058 | 12,891 | 14,422 | 177,358 |
| 2012 | 10,962 | 25,676 | 14,966 | 15,658 | 15,175 | 13,604 | 13,629 | 15,446 | 14,750 | 13,476 | 14,259 | 15,661 | 183,262 |
| 2013 | 10,522 | 11,968 | 15,005 | 13,078 | 15,910 | 14,813 | 13,388 | 16,280 | 13,309 | 11,710 | 12,417 | 15,393 | 163,793 |
| 2014 | 9,768 | 11,908 | 15,692 | 12,934 | 13,915 | 12,090 | 13,142 | 15,361 | 10,245 | 14,607 | 15,633 | 15,578 | 160,873 |
| 2015 | 8,969 | 10,811 | 11,583 | 11,700 | 12,875 | 11,080 | 11,562 | 11,112 | 7,773 | 8,549 | 11,022 | 14,073 | 131,109 |
| 2016 | 8,177 | 9,375 | 10,471 | 10,694 | 10,945 | 8,617 | 11,450 | 11,720 | 8,299 | 8,068 | 10,212 | 13,079 | 121,107 |
| 2017 | 6,846 | 8,017 | 9,700 | 9,398 | 11,535 | 9,999 | 11,053 | 12,409 | 12,038 | 9,217 | 8,362 | 7,233 | 115,807 |
| 2018 | 4,531 | 4,592 | 5,527 | 4,302 | 6,821 | 7,239 | 6,938 | 10,597 | 10,631 | 10,148 | 9,207 | 10,261 | 90,794 |
| 2019 | 6,875 | 7,109 | 9,105 | 7,745 | 9,653 | 8,486 | 8,086 | 9,592 | 8,090 | 8,582 | 8,966 | 8,164 | 100,453 |
| 2020 | 6,945 | 8,992 | 13,623 | 2,875 | 6,388 | 6,708 | 7,054 | 6,270 | 6,792 | 8,495 | 6,978 | 9,709 | 90,829 |
| 2021 | 7,268 | 7,268 | 8,177 | 6,853 | 6,589 | — | 3,278 | 3,156 | 3,278 | 3,082 | 3,082 | 3,082 | 55,113 |
| 2022 | 3,481 | 3,481 | 3,916 | 4,413 | 4,250 | 4,250 | 3,026 | 3,142 | 3,026 | 349 | 335 | 363 | 34,032 |
| 2023 | 1,505 | 1,444 | 1,625 | 3,934 | 3,782 | 3,934 | 4,594 | 4,961 | 4,777 | 5,543 | 5,543 | 5,765 | 47,407 |
| 2024 | 4,284 | 4,284 | 4,456 | 6,658 | 6,925 | 6,925 | 6,375 | 7,140 | 5,865 | 5,578 | 6,549 | 6,791 | 71,830 |
| 2025 | 5,926 | 5,689 | 6,163 | 4,911 | 5,100 | 4,534 | 3,871 | 3,386 | 3,666 | 3,338 | 3,388 | 3,955 | 53,927 |
| 2026 | 3,956 | 3,652 | 3,957 | 5,181 | 5,636 | 5,132 | — | — | — | — | — | — | 27,514 |
Volkswagen Jetta Sales in Canada
In Canada the Jetta has historically been one of Volkswagen’s volume leaders, peaking at 31,042 units in 2014. Sales fell through the late 2010s and dropped to 5,745 in 2022, but the nameplate has since recovered steadily, rising to 8,153 in 2023, 11,769 in 2024, and 15,849 in 2025, its best result in several years.
Volkswagen Jetta, Canada calendar-year unit sales, 2004–2026. 2026 is January–Jun (partial).
Annual sales
| Year | Units | YoY |
|---|---|---|
| 2004 | 15,826 | — |
| 2005 | 18,202 | ▲ 15.0% |
| 2006 | 19,251 | ▲ 5.8% |
| 2007 | 14,665 | ▼ 23.8% |
| 2008 | 13,915 | ▼ 5.1% |
| 2009 | 13,970 | ▲ 0.4% |
| 2010 | 14,758 | ▲ 5.6% |
| 2011 | 26,749 | ▲ 81.3% |
| 2012 | 26,904 | ▲ 0.6% |
| 2013 | 30,413 | ▲ 13.0% |
| 2014 | 31,042 | ▲ 2.1% |
| 2015 | 27,719 | ▼ 10.7% |
| 2016 | 20,954 | ▼ 24.4% |
| 2017 | 17,483 | ▼ 16.6% |
| 2018 | 15,129 | ▼ 13.5% |
| 2019 | 17,260 | ▲ 14.1% |
| 2020 | 10,552 | ▼ 38.9% |
| 2021 | 12,585 | ▲ 19.3% |
| 2022 | 5,745 | ▼ 54.4% |
| 2023 | 8,153 | ▲ 41.9% |
| 2024 | 11,769 | ▲ 44.4% |
| 2025 | 15,849 | ▲ 34.7% |
| 2026 (Jan–Jun) | 8,271 | ▼ 2.9% YTD |
Monthly sales
| Year | Jan | Feb | Mar | Apr | May | Jun | Jul | Aug | Sep | Oct | Nov | Dec | Total |
|---|---|---|---|---|---|---|---|---|---|---|---|---|---|
| 2004 | 658 | 771 | 1,123 | 1,430 | 1,983 | 1,916 | 1,478 | 1,379 | 1,486 | 1,468 | 1,247 | 887 | 15,826 |
| 2005 | 606 | 1,084 | 1,773 | 1,848 | 1,661 | 1,683 | 1,393 | 1,634 | 1,651 | 1,711 | 1,671 | 1,487 | 18,202 |
| 2006 | 1,166 | 1,208 | 1,812 | 1,672 | 1,988 | 1,524 | 1,697 | 2,150 | 1,792 | 1,688 | 1,206 | 1,348 | 19,251 |
| 2007 | 878 | 903 | 1,745 | 1,476 | 1,575 | 1,478 | 1,339 | 1,442 | 1,009 | 1,166 | 1,044 | 610 | 14,665 |
| 2008 | 538 | 654 | 1,003 | 870 | 1,144 | 983 | 1,248 | 1,444 | 1,579 | 1,793 | 1,385 | 1,274 | 13,915 |
| 2009 | 817 | 758 | 1,326 | 1,169 | 1,384 | 1,622 | 1,563 | 1,309 | 1,375 | 971 | 783 | 893 | 13,970 |
| 2010 | 567 | 685 | 870 | 1,091 | 1,118 | 1,135 | 1,206 | 739 | 867 | 2,234 | 2,086 | 2,160 | 14,758 |
| 2011 | 1,471 | 1,548 | 2,445 | 3,058 | 2,964 | 2,582 | 2,323 | 2,176 | 2,402 | 2,318 | 1,855 | 1,607 | 26,749 |
| 2012 | 1,513 | 1,543 | 1,940 | 2,397 | 2,611 | 2,381 | 2,097 | 2,531 | 2,677 | 2,821 | 2,420 | 1,973 | 26,904 |
| 2013 | 1,805 | 2,218 | 3,001 | 2,814 | 2,858 | 2,541 | 2,347 | 2,708 | 3,006 | 3,267 | 2,290 | 1,558 | 30,413 |
| 2014 | 1,891 | 2,081 | 2,207 | 3,761 | 3,412 | 3,087 | 3,639 | 2,757 | 2,381 | 2,235 | 1,874 | 1,717 | 31,042 |
| 2015 | 1,662 | 1,767 | 3,012 | 2,996 | 3,043 | 2,573 | 2,631 | 2,801 | 2,088 | 2,078 | 1,657 | 1,411 | 27,719 |
| 2016 | 1,171 | 1,073 | 1,667 | 2,912 | 2,233 | 1,693 | 2,287 | 2,185 | 1,887 | 1,850 | 1,360 | 636 | 20,954 |
| 2017 | 764 | 972 | 1,196 | 1,784 | 1,878 | 1,908 | 2,054 | 2,154 | 1,738 | 1,365 | 1,072 | 598 | 17,483 |
| 2018 | 454 | 405 | 418 | 516 | 2,073 | 1,869 | 1,699 | 1,744 | 1,545 | 1,480 | 1,391 | 1,535 | 15,129 |
| 2019 | 1,131 | 1,028 | 1,081 | 1,789 | 1,789 | 1,629 | 1,656 | 1,656 | 1,508 | 1,434 | 1,247 | 1,312 | 17,260 |
| 2020 | 903 | 821 | 904 | 710 | 645 | 711 | 1,188 | 1,134 | 1,134 | 825 | 750 | 827 | 10,552 |
| 2021 | 822 | 822 | 947 | 1,040 | 946 | 1,042 | 1,425 | 1,493 | 1,427 | 860 | 860 | 901 | 12,585 |
| 2022 | 117 | 112 | 130 | 622 | 622 | 653 | 746 | 858 | 786 | 366 | 366 | 367 | 5,745 |
| 2023 | 466 | 423 | 488 | 594 | 654 | 655 | 715 | 822 | 717 | 914 | 873 | 832 | 8,153 |
| 2024 | 646 | 617 | 618 | 1,375 | 1,375 | 1,251 | 965 | 965 | 879 | 1,106 | 961 | 1,011 | 11,769 |
| 2025 | 998 | 907 | 953 | 1,945 | 1,856 | 1,858 | 1,609 | 1,536 | 1,538 | 951 | 786 | 912 | 15,849 |
| 2026 | 1,081 | 967 | 1,062 | 1,680 | 1,804 | 1,677 | — | — | — | — | — | — | 8,271 |







Hi, this and other pages show they were updated in 2011 while showing sales figures for 2012, can this be updated?
Costa, this and other pages show 2012 YTD sales info where the 2012 sales info belongs, and earlier data elsewhere. What's the issue?
Yeah, that's just the original publish date. If we alter that each time then the RSS feed would be way too big (most of the 250 or so models are updated on the same day) and, even if the feed didn't get too big, subscribers would have 250 new posts arriving in their inboxes. In the end, you'll just have to scroll to the bottom of the post where you'll see how recently it was updated.
FYI, the U.S. information is almost always updated on the 1st of the month (unless the 1st is on a weekend) and the Canadian info is mostly updated the same day, with the remaining Canadian bits (Honda, Audi, BMW, Mercedes-Benz, Subaru and a few others) filled in about 10 days later. April info was updated May 1st, with the remaining data input today, May 12th.
Okay, thanks very much.