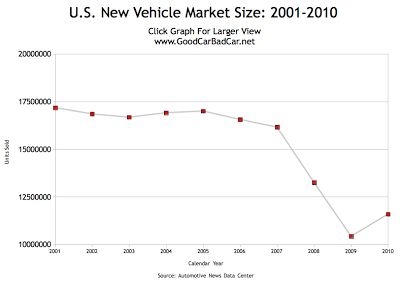
Over the last few years, automobile manufacturers and their dealers have absorbed the U.S. economy’s secondary whiplash after a massive housing and banking crisis crippled the system. This is clearly manifested in the first Graph below, one which shows the market falling from decade highs in 2001 and 2005 to a decade low in 2009 before slight recovery took place in 2010. When glancing at the lack of red in GoodCarBadCar.net’s monthly U.S. Auto Sales By Brand post, one would be inclined to believe that automakers had recovered. But that would be to ignore the fact that just about anything looks good after a garbage year.
In this second chart, passenger car sales are contrasted with light truck sales. Described as a percentage of the overall market, cars have obviously become the more likely purchase in the last three years, but not by a significant measure. Remember, “light trucks” isn’t just a reference to pickups like the 2011 Ford F-150 or 2011 Dodge Ram but to vehicles like the new 2011 Ford Explorer and minivans like the revamped 2011 Dodge Grand Caravan.
No Membership? You’re missing out
Get immediate ad-free access to all our premium content.