GM Sells More Of These Than They Do Camaros, Which Wasn’t The Case In 2012 |
To understand the impact SUVs and crossovers are having in the United States, it’s useful to view all their sales figures in one place. That’s what we do here, where 91 different utility vehicle nameplates are organized in the order of their 2013 U.S. sales totals. (Thankfully, the list is sortable, so you can rank them by 2012 sales, by year-over-year improvement, by December numbers, or by name.)
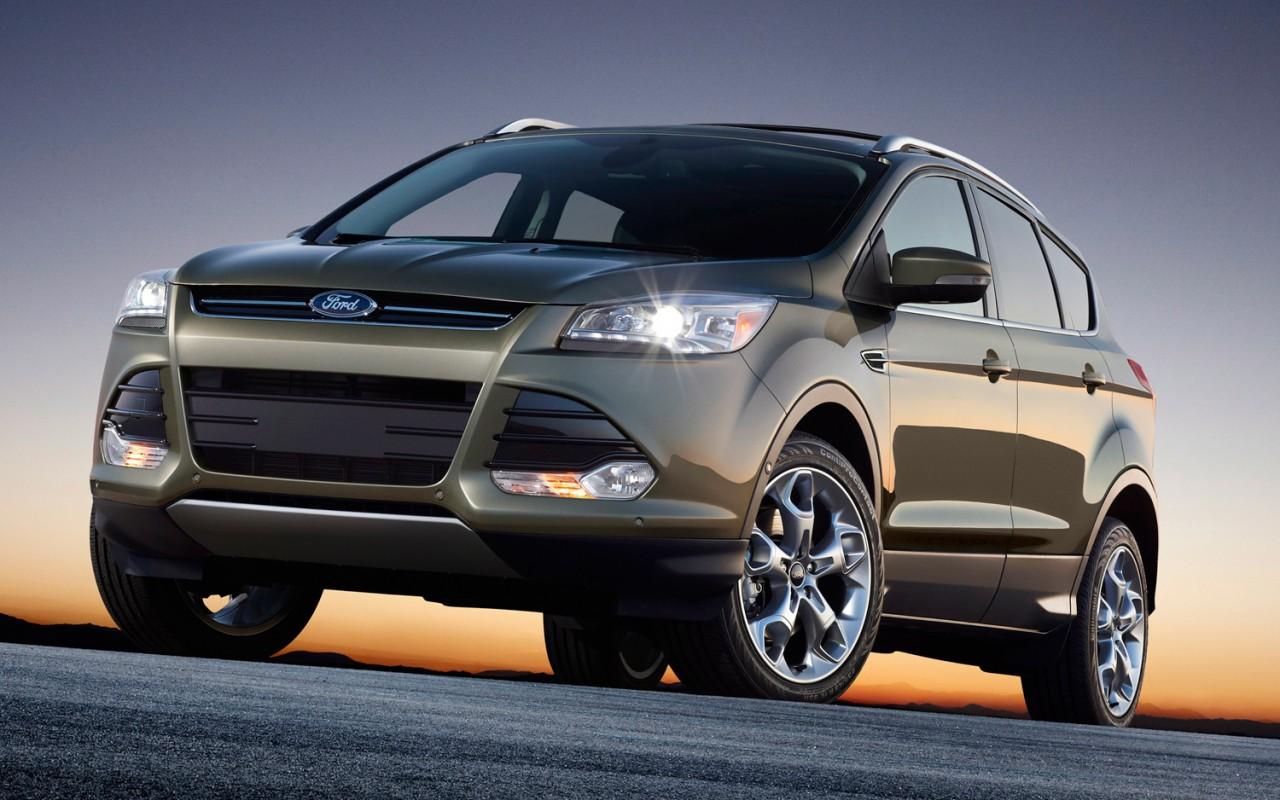
But if we really want to see how SUVs and crossovers are selling, GCBC’s all vehicle rankings post – the one we published a few minutes ago – also provides a great deal of assistance.
Six Out Of Every Ten Acuras Sold Is Either An MDX Or RDX |
That’s where we see that the second-best-selling SUV in America, Ford’s Escape, added 34,985 sales in 2013 to continue outselling Ford’s own resurgent midsize sedan, the Fusion. The Escape’s main rival, the CR-V, became the first utility vehicle since the Ford Explorer (in 2004) to find more than 300,000 U.S. buyers in a calendar year.
That put the CR-V ahead of popular small cars like the Chevrolet Cruze and Hyundai Elantra. As we saw last Friday, a push in the latter half of the year made the Honda CR-V America’s top-selling SUV in 2013, the second straight year the CR-V has accomplished that feat and the sixth time in seven years.
• All 158 Cars Ranked By 2013 Year End & December U.S. Sales
Land Rover Sales Are Triple What Jaguar USA Accomplishes, Jaguar Sales Were 29% Better A Decade Ago |
The Chevrolet Equinox is GM’s fourth-best-selling model, 37,598 sales ahead of the Malibu in 2013. Toyota’s RAV4 is the brand’s third-ranked model – it, too, outsold the Malibu in 2013, as well as the Sonata, Jetta, and Prius/Prius Plug-In. Not loved by the automotive press, Jeep’s Patriot still managed to sell better than ever in 2013, better than Ford’s Fiesta or the fast-rising Toyota Avalon.
It’s not just small crossovers that are surging in popularity. The top-selling premium brand utility vehicle in 2013, as it was in 2013, was the Lexus RX. But in 2012, the RX was outsold by, for example, the Dodge Avenger and GMC Terrain. That wasn’t the case in 2013. The Audi Q5 outsells all Audis, even the A4 (Allroad not included.) Acura sells as many MDXs as Honda does Fit subcompacts. The Acura RDX, up 52% this year, outsold the Mazda 6, up 29% in 2013. The BMW X5 and Ford Expedition both found more buyers last year than the Cadillac ATS. The Mercedes-Benz GLK is slightly more popular than the Lincoln MKZ. More new GMC Yukon XLs were sold in 2013 than new Volkswagen Golfs.
This is a simplified look at the rising popularity of SUVs and crossovers in America. So think of it this way: in an overall market that produced a 7.5% year-over-year improvement, SUV and crossover sales were up 11.6%.
There were meaningful improvements introduced in October’s ranking of vehicle sales. Prior year figures now include the actual numbers from last year, not just the percentage increase from last year. As a result, we’ve also included vehicles like the Suzuki XL7 and Dodge Nitro, nameplates which collected sales in 2012 but not this year. At any time, click the Rank column to return to the original format. If you’re on a mobile device, you may need to choose the full version of the site (at the bottom of the page) in order to use the sortable function.
Reminder: these are 2013 year end rankings, but you can sort SUVs and crossovers by December volume by clicking the December 2013 column header, or you can rank them by improvements or declines using the % columns. Or, most importantly, you can list automakers together by selecting the SUV/Crossover column header. Just remember, the list is horizontally flipped from the norm: YTD on the left, monthly data on the right.
As always, you can find historical monthly and yearly sales figures for any of these vehicles by selecting a make and model at GCBC’s Sales Stats page.
Click Column Headers To Sort • December 2014 • January 2014 • November 2013
Rank
|
SUV/Crossover
|
2013
|
2012
|
%
Change |
December
2013 |
December
2012 |
% Change
|
---|---|---|---|---|---|---|---|
#1
|
Honda CR-V
|
303,904
|
281,652
|
7.9%
|
28,759
|
25,733
|
11.8%
|
#2
|
Ford Escape
|
295,993
|
261,008
|
13.4%
|
24,462
|
20,131
|
21.5%
|
#3
|
Chevrolet Equinox
|
238,192
|
218,621
|
9.0%
|
17,212
|
19,551
|
-12.0%
|
#4
|
Toyota RAV4
|
218,249
|
171,877
|
27.0%
|
20,970
|
14,351
|
46.1%
|
#5
|
Ford Explorer
|
192,397
|
164,207
|
17.2%
|
16,907
|
17,244
|
-2.0%
|
#5.1
|
Ford Explorer *
|
178,311
|
158,344
|
12.6%
|
15,660
|
16,695
|
-6.2%
|
#5.2
|
Ford Explorer Police Interceptor *
|
14,086
|
5,863
|
140%
|
1,247
|
549
|
127%
|
#6
|
Jeep Grand Cherokee
|
174,275
|
154,734
|
12.6%
|
16,517
|
17,121
|
-3.5%
|
#7
|
Nissan Rogue
|
162,751
|
142,349
|
14.3%
|
14,676
|
11,488
|
27.8%
|
#8
|
Jeep Wrangler
|
155,502
|
141,669
|
9.8%
|
12,028
|
11,545
|
4.2%
|
#9
|
Ford Edge
|
129,109
|
127,969
|
0.9%
|
12,078
|
12,434
|
-2.9%
|
#10
|
Toyota Highlander
|
127,572
|
121,055
|
5.4%
|
12,344
|
12,191
|
1.3%
|
#11
|
Honda Pilot
|
126,678
|
114,848
|
10.3%
|
8,971
|
11,366
|
-21.1%
|
#12
|
Subaru Forester
|
123,592
|
76,347
|
61.9%
|
13,229
|
8,764
|
50.9%
|
#13
|
Kia Sorento
|
105,649
|
119,597
|
-11.7%
|
7,482
|
10,967
|
-31.8%
|
#14
|
Lexus RX
|
103,920
|
95,381
|
9.0%
|
13,169
|
12,534
|
5.1%
|
#15
|
GMC Terrain
|
99,525
|
97,786
|
1.8%
|
7,998
|
11,516
|
-30.5%
|
#16
|
Chevrolet Traverse
|
96,467
|
85,606
|
12.7%
|
7,802
|
7,430
|
5.0%
|
#17
|
GMC Acadia
|
89,793
|
78,280
|
14.7%
|
7,923
|
5,179
|
53.0%
|
#18
|
Hyundai Santa Fe
|
88,844
|
71,016
|
25.1%
|
8,249
|
7,279
|
13.3%
|
#19
|
Nissan Pathfinder
|
88,632
|
42,621
|
108%
|
6,675
|
7,939
|
-15.9%
|
#20
|
Dodge Journey
|
83,933
|
79,563
|
5.5%
|
7,616
|
7,688
|
-0.9%
|
#21
|
Chevrolet Tahoe
|
83,502
|
68,904
|
21.2%
|
8,646
|
8,602
|
0.5%
|
#22
|
Mazda CX-5
|
79,544
|
43,319
|
83.6%
|
6,720
|
5,956
|
12.8%
|
#23
|
Jeep Patriot
|
75,797
|
62,010
|
22.2%
|
6,158
|
4,566
|
34.9%
|
#24
|
Dodge Durango
|
60,727
|
42,589
|
42.6%
|
5,376
|
5,216
|
3.1%
|
#25
|
Buick Enclave
|
60,534
|
56,703
|
6.8%
|
4,819
|
6,052
|
-20.4%
|
#26
|
Cadillac SRX
|
56,776
|
57,485
|
-1.2%
|
6,074
|
6,400
|
-5.1%
|
#27
|
Acura MDX
|
53,040
|
50,854
|
4.3%
|
6,538
|
5,069
|
29.0%
|
#28
|
Jeep Compass
|
52,993
|
40,235
|
31.7%
|
3,534
|
3,131
|
12.9%
|
#29
|
Toyota 4Runner
|
51,625
|
48,755
|
5.9%
|
5,100
|
5,224
|
-2.4%
|
#30
|
Chevrolet Suburban
|
51,260
|
48,116
|
6.5%
|
5,820
|
5,956
|
-2.3%
|
#31
|
Chevrolet Captiva Sport
|
47,600
|
36,935
|
28.9%
|
2,634
|
2,707
|
-2.7%
|
#32
|
Acura RDX
|
44,750
|
29,520
|
51.6%
|
4,215
|
4,024
|
4.7%
|
#33
|
Nissan Murano
|
44,684
|
51,675
|
-13.5%
|
4,684
|
3,999
|
17.1%
|
#34
|
Hyundai Tucson
|
41,906
|
48,878
|
-14.3%
|
3,714
|
3,745
|
-0.8%
|
#35
|
Mercedes-Benz M-Class
|
41,326
|
38,101
|
8.5%
|
4,485
|
4,241
|
5.8%
|
#36
|
Audi Q5
|
40,355
|
28,671
|
40.8%
|
4,794
|
3,626
|
32.2%
|
#37
|
BMW X5
|
39,818
|
44,445
|
-10.4%
|
1,953
|
5,722
|
-65.9%
|
#38
|
Ford Expedition
|
38,350
|
38,062
|
0.8%
|
4,325
|
4,061
|
6.5%
|
#39
|
Nissan Juke
|
38,157
|
36,358
|
4.9%
|
3,076
|
2,739
|
12.3%
|
#40
|
Kia Sportage
|
32,965
|
36,357
|
-9.3%
|
2,527
|
1,696
|
49.0%
|
#41
|
Mercedes-Benz GLK-Class
|
32,553
|
29,364
|
10.9%
|
3,229
|
3,004
|
7.5%
|
#42
|
Buick Encore
|
31,956
|
—
|
— |
2,761
|
—
|
— |
#43
|
Infiniti JX/QX60
|
31,602
|
21,674
|
45.8%
|
3,744
|
2,708
|
38.3%
|
#44
|
GMC Yukon XL
|
31,258
|
23,427
|
33.4%
|
3,158
|
2,929
|
7.8%
|
#45
|
BMW X3
|
30,623
|
35,173
|
-12.9%
|
3,707
|
5,162
|
-28.2%
|
#46
|
Volkswagen Tiguan
|
30,002
|
31,731
|
-5.4%
|
2,464
|
3,310
|
-25.6%
|
#47
|
Mercedes-Benz GL-Class
|
29,912
|
26,042
|
14.9%
|
2,239
|
3,111
|
-28.0%
|
#48
|
GMC Yukon
|
28,302
|
27,818
|
1.7%
|
3,597
|
3,942
|
-8.8%
|
#49
|
BMW X1
|
26,512
|
8,947
|
196%
|
2,741
|
2,806
|
-2.3%
|
#50
|
Ford Flex
|
25,953
|
28,224
|
-8.0%
|
2,378
|
2,172
|
9.5%
|
#51
|
Jeep Cherokee
|
25,786
|
—
|
— |
15,038
|
—
|
— |
#52
|
Mitsubishi Outlander Sport
|
24,951
|
18,091
|
37.9%
|
2,358
|
1,770
|
33.2%
|
#53
|
Mazda CX-9
|
24,628
|
24,442
|
0.8%
|
1,539
|
3,353
|
-54.1%
|
#54
|
Lincoln MKX
|
23,913
|
25,107
|
-4.8%
|
2,547
|
2,617
|
-2.7%
|
#55
|
Mini Countryman
|
21,325
|
21,012
|
1.5%
|
2,055
|
2,224
|
-7.6%
|
#56
|
Cadillac Escalade ^
|
20,542
|
20,698
|
-0.8%
|
2,245
|
2,298
|
-2.3%
|
#56.1
|
Cadillac Escalade *
|
12,592
|
12,615
|
-0.2%
|
1,470
|
1,371
|
7.2%
|
#56.2
|
Cadillac Escalade ESV *
|
7,950
|
8,083
|
-1.6%
|
775
|
927
|
-16.4%
|
#57
|
Volvo XC60
|
19,766
|
19,139
|
3.3%
|
1,581
|
1,760
|
-10.2%
|
#58
|
Porsche Cayenne
|
18,507
|
15,545
|
19.1%
|
1,379
|
1,565
|
-11.9%
|
#59
|
Nissan Xterra
|
17,766
|
17,222
|
3.2%
|
1,588
|
1,379
|
15.2%
|
#60
|
Audi Q7
|
15,978
|
11,008
|
45.1%
|
2,279
|
1,493
|
52.6%
|
#61
|
Land Rover Range Rover Sport
|
15,976
|
16,491
|
-3.1%
|
2,305
|
2,003
|
15.1%
|
#62
|
Nissan Armada
|
14,383
|
18,072
|
-20.4%
|
1,463
|
2,134
|
-31.4%
|
#63
|
Toyota Sequoia
|
13,811
|
13,151
|
5.0%
|
1,382
|
1,533
|
-9.8%
|
#64
|
Infiniti QX56/QX80
|
13,148
|
15,310
|
-14.1%
|
1,750
|
2,232
|
-21.6%
|
#65
|
Toyota FJ Cruiser
|
13,131
|
13,656
|
-3.8%
|
1,305
|
1,511
|
-13.6%
|
#66
|
Mitsubishi Outlander
|
12,287
|
7,750
|
58.5%
|
1,289
|
638
|
102%
|
#67
|
Land Rover Range Rover
|
12,221
|
7,843
|
55.8%
|
1,340
|
1,034
|
29.6%
|
#68
|
Lexus GX460
|
12,136
|
11,039
|
9.9%
|
1,830
|
1,407
|
30.1%
|
#69
|
Land Rover Range Rover Evoque
|
11,405
|
8,901
|
28.1%
|
1,186
|
1,117
|
6.2%
|
#70
|
Lincoln Navigator
|
8,613
|
8,371
|
2.9%
|
942
|
1,082
|
-12.9%
|
#71
|
Volkswagen Touareg
|
8,233
|
10,553
|
-22.0%
|
818
|
1,408
|
-41.9%
|
#72
|
Land Rover LR4
|
7,093
|
7,316
|
-3.0%
|
548
|
774
|
-29.2%
|
#73
|
Volvo XC90
|
6,845
|
9,513
|
-28.0%
|
688
|
873
|
-21.2%
|
#74
|
Infiniti FX/QX70
|
6,380
|
10,424
|
-38.8%
|
586
|
988
|
-40.7%
|
#75
|
Jeep Liberty
|
6,101
|
75,483
|
-91.9%
|
—
|
3,508
|
-100%
|
#76
|
Lincoln MKT
|
6,014
|
7,094
|
-15.2%
|
598
|
653
|
-8.4%
|
#77
|
BMW X6
|
5,549
|
6,749
|
-17.8%
|
722
|
1,039
|
-30.5%
|
#78
|
Lexus LX570
|
4,625
|
5,005
|
-7.6%
|
675
|
494
|
36.6%
|
#79
|
Land Rover LR2
|
3,315
|
3,113
|
6.5%
|
385
|
246
|
56.5%
|
#80
|
Mini Paceman
|
3,262
|
— | — |
650
|
— | — |
#81
|
Toyota Land Cruiser
|
3,082
|
2,895
|
6.5%
|
326
|
316
|
3.2%
|
#82
|
Mercedes-Benz G-Class
|
2,494
|
1,330
|
87.5%
|
199
|
168
|
18.5%
|
#83
|
Infiniti EX/QX50
|
2,164
|
3,495
|
-38.1%
|
295
|
334
|
-11.7%
|
#84
|
Subaru Tribeca
|
1,598
|
2,075
|
-23.0%
|
143
|
189
|
-24.3%
|
#85
|
Suzuki Grand Vitara
|
1,037
|
4,954
|
-79.1%
|
—
|
338
|
-100%
|
#86
|
Acura ZDX
|
361
|
775
|
-53.4%
|
14
|
50
|
-72.0%
|
#87
|
Hyundai Veracruz
|
175
|
8,232
|
-97.9%
|
—
|
58
|
-100%
|
#88
|
Mitsubishi Endeavor
|
24
|
501
|
-95.2%
|
—
|
8
|
-100%
|
#89
|
Honda Element
|
2
|
3
|
-33.3%
|
—
|
—
|
— |
T90
|
Mazda Tribute
|
1
|
501
|
-99.8%
|
—
|
—
|
— |
T90
|
Mazda CX-7
|
1
|
11,326
|
-99.99%
|
—
|
—
|
— |
#272
|
Dodge Nitro
|
—
|
3,269
|
-100%
|
—
|
—
|
— |
#277
|
Suzuki XL7
|
—
|
10
|
-100%
|
—
|
—
|
— |
—
|
Total
|
4,747,988 | 4,254,022 | 11.6% | 444,325 | 418,921 | 6.1% |
—
|
—
|
— | — | — | — | — | — |
Source: Automakers & ANDC
* Italicized unranked lines are nothing more than available breakdowns, already included in the model’s total, not in addition to the model’s total.
^ Escalade here does not include sales of the EXT, which is shown with pickup trucks.
Rather than listing the 500L with the Mini Paceman and Countryman in these SUV/crossover rankings, it’s with cars in large part because it is not available with all-wheel-drive. The placement of numerous crossovers often prompts disagreement, but consider the vehicle type’s name: crossover. By its very definition, it crosses over from one category into another. The very act of calling, for example, the Toyota Venza a car or a utility vehicle requires ignorance of the fact that the Venza (or Outback, Crosstour, Encore, Countryman, 500L) is a square peg that can’t be squeezed through a round hole.
RECOMMENDED READING
U.S. SUV/Crossover Sales Rankings By Model – December & 2014 Year End
U.S. SUV Sales Rankings By Model – January 2014
U.S. SUV Sales Rankings By Model – November 2013 YTD
U.S. Vehicle Sales Rankings By Model – 2012 Year End
U.S. Auto Sales Brand Rankings – December 2013 YTD
Minivan Sales Rankings By Model – December 2013 & Year End
Pickup Truck Sales Rankings By Model – December 2013 & Year End
Commercial Van Sales Rankings By Model – December 2013 & Year End
U.S. Car Sales Rankings By Model – December & 2013 Year End