
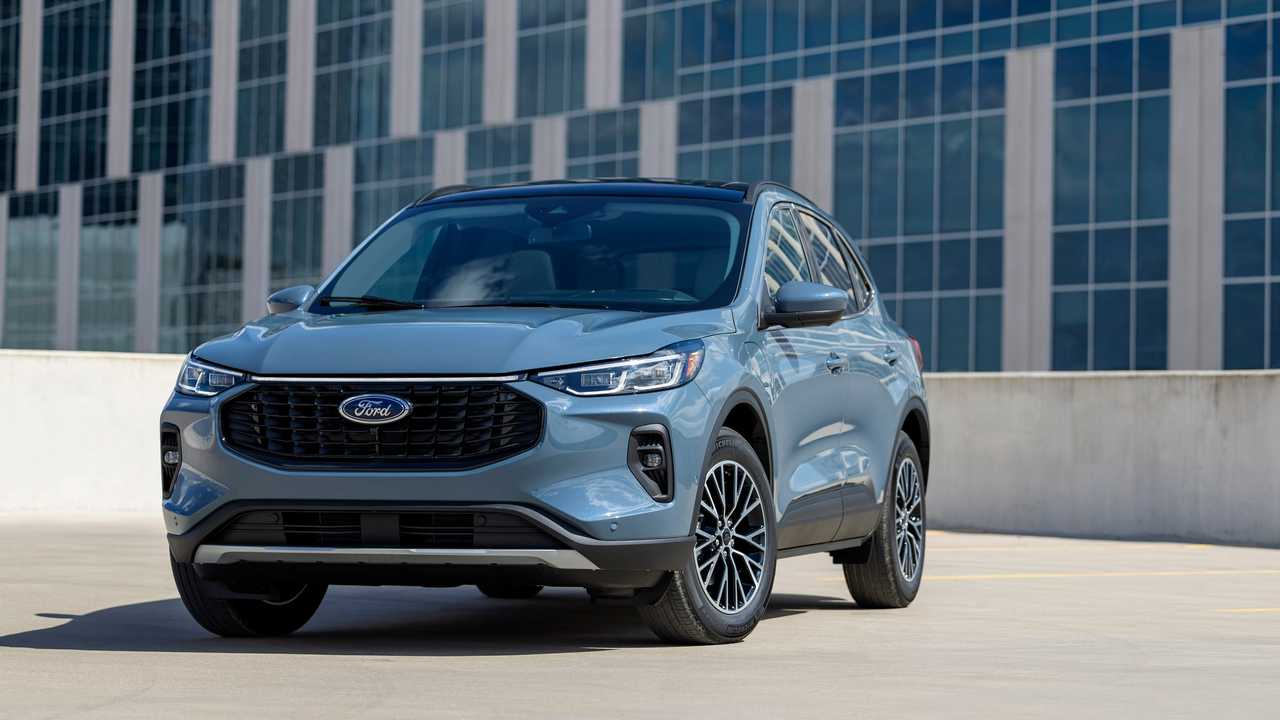
Ford Escape
Here you will find monthly and yearly United States and Canadian sales figures for the Ford Escape. The Escape is Ford’s compact crossover SUV, a longtime staple of one of the most competitive segments in the market, offered over the years with gasoline, hybrid, and plug-in hybrid powertrains. It has competed with the Toyota RAV4, Honda CR-V, Chevrolet Equinox, and Nissan Rogue.
- Class: Compact crossover SUV
- Engines and powertrains: 1.5L EcoBoost (180 horsepower), 2.0L EcoBoost (250 horsepower), 2.5L hybrid (192 total system horsepower), and 2.5L plug-in hybrid (210 total system horsepower)
- Transmission: Eight-speed automatic with the EcoBoost engines, electronic continuously variable transmission with the hybrids
- Drivetrain: Front-wheel drive with available all-wheel drive, front-wheel drive only on the plug-in hybrid
- Trims: Active, ST-Line, ST-Line Select, ST-Line Elite, Platinum, and Plug-In Hybrid
- Chief rivals: Toyota RAV4, Honda CR-V, Chevrolet Equinox, Nissan Rogue
Ford states that the 2026 Escape is not certified to California emissions requirements and so is not sold in California, Massachusetts, Oregon, New York, Washington, or Vermont, and Ford of Canada now lists the nameplate as discontinued.
Ford Escape Sales in the United States
Ford Escape sales in the United States have receded well below their mid-2010s highs. The compact crossover was a segment heavyweight through that decade, topping 300,000 units every year from 2014 through 2017 and reaching 308,296 in 2017. Deliveries then declined steadily, falling to 145,415 by 2021 and hovering near 140,000 in the years that followed, with a brief lift to 157,331 in 2024. Volume settled back to 139,396 in 2025, down about 11 percent year over year. The first half of 2026 brought a much steeper reduction, with 24,112 units delivered through June, well below the 82,589 recorded over the same period in 2025. That drop coincides with a narrower footprint, because Ford has not certified the 2026 Escape to California emissions requirements and therefore does not offer it in the six states that follow those rules.
Ford Escape, United States calendar-year unit sales, 2005–2026. 2026 is January–Aug (partial).
Annual sales
| Year | Units | YoY |
|---|---|---|
| 2005 | 165,122 | — |
| 2006 | 157,395 | ▼ 4.7% |
| 2007 | 165,596 | ▲ 5.2% |
| 2008 | 156,544 | ▼ 5.5% |
| 2009 | 173,044 | ▲ 10.5% |
| 2010 | 191,026 | ▲ 10.4% |
| 2011 | 254,293 | ▲ 33.1% |
| 2012 | 279,674 | ▲ 10.0% |
| 2013 | 295,993 | ▲ 5.8% |
| 2014 | 306,209 | ▲ 3.5% |
| 2015 | 306,492 | ▲ 0.1% |
| 2016 | 307,069 | ▲ 0.2% |
| 2017 | 308,296 | ▲ 0.4% |
| 2018 | 272,228 | ▼ 11.7% |
| 2019 | 241,387 | ▼ 11.3% |
| 2020 | 178,495 | ▼ 26.1% |
| 2021 | 145,415 | ▼ 18.5% |
| 2022 | 137,370 | ▼ 5.5% |
| 2023 | 140,968 | ▲ 2.6% |
| 2024 | 157,331 | ▲ 11.6% |
| 2025 | 139,396 | ▼ 11.4% |
| 2026 (Jan–Aug) | 28,182 | ▼ 73.4% YTD |
Monthly sales
| Year | Jan | Feb | Mar | Apr | May | Jun | Jul | Aug | Sep | Oct | Nov | Dec | Total |
|---|---|---|---|---|---|---|---|---|---|---|---|---|---|
| 2005 | 12,868 | 14,310 | 16,921 | 15,080 | 14,038 | 13,697 | 18,245 | 15,023 | 12,052 | 9,974 | 10,544 | 12,370 | 165,122 |
| 2006 | 11,010 | 15,583 | 15,675 | 16,011 | 16,699 | 14,361 | 12,170 | 11,459 | 10,095 | 9,603 | 10,126 | 14,603 | 157,395 |
| 2007 | 8,408 | 14,388 | 16,521 | 14,788 | 18,953 | 19,147 | 12,440 | 11,960 | 11,132 | 12,174 | 12,383 | 13,302 | 165,596 |
| 2008 | 11,191 | 14,192 | 18,517 | 15,399 | 17,667 | 15,099 | 10,421 | 14,025 | 9,161 | 9,886 | 10,019 | 10,967 | 156,544 |
| 2009 | 8,360 | 10,090 | 12,580 | 13,596 | 16,391 | 15,385 | 20,241 | 20,933 | 8,692 | 12,471 | 15,149 | 19,156 | 173,044 |
| 2010 | 10,753 | 15,156 | 19,182 | 19,146 | 19,203 | 15,540 | 14,689 | 14,838 | 14,313 | 14,578 | 14,937 | 18,691 | 191,026 |
| 2011 | 13,973 | 18,005 | 23,975 | 21,240 | 23,140 | 22,274 | 24,411 | 20,607 | 20,225 | 19,046 | 21,823 | 25,574 | 254,293 |
| 2012 | 17,259 | 37,332 | 22,679 | 16,986 | 23,077 | 28,500 | 21,572 | 28,188 | 23,148 | 19,832 | 20,970 | 20,131 | 279,674 |
| 2013 | 19,939 | 24,110 | 28,934 | 25,826 | 29,123 | 28,694 | 22,343 | 26,714 | 22,607 | 22,253 | 20,988 | 24,462 | 295,993 |
| 2014 | 19,459 | 23,145 | 28,701 | 24,579 | 31,896 | 25,110 | 26,558 | 28,993 | 21,718 | 24,919 | 25,528 | 25,603 | 306,209 |
| 2015 | 20,054 | 20,915 | 26,303 | 25,770 | 29,248 | 24,126 | 29,253 | 28,870 | 28,473 | 24,719 | 20,807 | 27,954 | 306,492 |
| 2016 | 19,219 | 23,854 | 28,521 | 23,920 | 30,861 | 29,003 | 26,260 | 28,061 | 25,065 | 23,505 | 23,012 | 25,788 | 307,069 |
| 2017 | 20,588 | 27,637 | 28,113 | 25,637 | 27,830 | 27,151 | 27,716 | 23,631 | 25,575 | 23,064 | 25,101 | 26,253 | 308,296 |
| 2018 | 18,947 | 21,033 | 27,370 | 21,383 | 26,993 | 28,901 | 20,630 | 24,395 | 20,398 | 20,515 | 21,516 | 20,147 | 272,228 |
| 2019 | 19,968 | 19,169 | 21,565 | 23,529 | 27,149 | 21,719 | 19,967 | 22,364 | 18,370 | 15,669 | 16,249 | 15,669 | 241,387 |
| 2020 | 15,628 | 20,233 | 12,255 | 6,602 | 14,672 | 15,406 | 16,465 | 14,636 | 15,855 | 15,959 | 13,411 | 17,373 | 178,495 |
| 2021 | 11,190 | 11,853 | 17,947 | 15,680 | 19,951 | 8,871 | 4,141 | 10,696 | 11,462 | 13,500 | 9,420 | 10,704 | 145,415 |
| 2022 | 13,120 | 11,706 | 15,136 | 15,502 | 8,899 | 9,557 | 9,854 | 13,272 | 12,265 | 9,966 | 8,893 | 9,200 | 137,370 |
| 2023 | 7,878 | 6,447 | 6,824 | 17,133 | 11,733 | 14,824 | 12,413 | 12,432 | 13,929 | 12,573 | 11,542 | 13,240 | 140,968 |
| 2024 | 10,889 | 13,227 | 12,479 | 12,335 | 14,076 | 11,532 | 10,472 | 24,193 | 11,745 | 12,784 | 10,344 | 13,255 | 157,331 |
| 2025 | 9,902 | 13,958 | 13,497 | 12,903 | 17,395 | 14,934 | 11,216 | 12,290 | 8,633 | 10,698 | 7,054 | 6,916 | 139,396 |
| 2026 | 3,418 | 4,025 | 4,954 | 5,050 | 3,427 | 3,238 | 2,624 | 1,446 | — | — | — | — | 28,182 |
Ford Escape Sales in Canada
In Canada the Escape’s recent trajectory has been steadier. After peaking above 52,000 units in 2014 and drifting down through the following decade, Canadian sales bottomed at 19,546 in 2023, then rebounded to 30,996 in 2024 and 32,956 in 2025, a gain of about 6 percent year over year. Ford of Canada has since dropped the model and now lists the nameplate as discontinued, so Canadian volume should fade from here.
Ford Escape, Canada calendar-year unit sales, 2004–2026. 2026 is January–Jun (partial).
Annual sales
| Year | Units | YoY |
|---|---|---|
| 2004 | 20,360 | — |
| 2005 | 23,493 | ▲ 15.4% |
| 2006 | 25,542 | ▲ 8.7% |
| 2007 | 31,643 | ▲ 23.9% |
| 2008 | 32,898 | ▲ 4.0% |
| 2009 | 36,980 | ▲ 12.4% |
| 2010 | 43,038 | ▲ 16.4% |
| 2011 | 44,248 | ▲ 2.8% |
| 2012 | 44,099 | ▼ 0.3% |
| 2013 | 45,141 | ▲ 2.4% |
| 2014 | 52,198 | ▲ 15.6% |
| 2015 | 47,726 | ▼ 8.6% |
| 2016 | 46,661 | ▼ 2.2% |
| 2017 | 47,880 | ▲ 2.6% |
| 2018 | 43,857 | ▼ 8.4% |
| 2019 | 39,503 | ▼ 9.9% |
| 2020 | 23,747 | ▼ 39.9% |
| 2021 | 25,960 | ▲ 9.3% |
| 2022 | 23,848 | ▼ 8.1% |
| 2023 | 19,546 | ▼ 18.0% |
| 2024 | 30,996 | ▲ 58.6% |
| 2025 | 32,956 | ▲ 6.3% |
| 2026 (Jan–Jun) | 9,804 | ▼ 30.0% YTD |
Monthly sales
| Year | Jan | Feb | Mar | Apr | May | Jun | Jul | Aug | Sep | Oct | Nov | Dec | Total |
|---|---|---|---|---|---|---|---|---|---|---|---|---|---|
| 2004 | 1,012 | 1,259 | 2,231 | 1,876 | 2,037 | 2,446 | 1,750 | 1,554 | 1,568 | 1,585 | 1,431 | 1,611 | 20,360 |
| 2005 | 1,172 | 1,630 | 1,683 | 2,002 | 1,849 | 2,476 | 2,747 | 1,710 | 1,780 | 1,716 | 2,294 | 2,434 | 23,493 |
| 2006 | 1,240 | 1,728 | 2,589 | 2,113 | 2,210 | 2,905 | 2,393 | 2,202 | 1,463 | 2,031 | 2,262 | 2,406 | 25,542 |
| 2007 | 1,149 | 1,134 | 2,513 | 3,030 | 3,619 | 4,690 | 3,216 | 3,431 | 1,974 | 2,726 | 2,064 | 2,097 | 31,643 |
| 2008 | 1,837 | 2,106 | 2,842 | 2,970 | 3,742 | 3,479 | 2,242 | 3,296 | 2,017 | 2,748 | 3,036 | 2,583 | 32,898 |
| 2009 | 1,966 | 2,162 | 2,449 | 2,431 | 4,218 | 4,917 | 5,167 | 3,387 | 2,155 | 3,282 | 2,375 | 2,471 | 36,980 |
| 2010 | 1,711 | 2,786 | 3,692 | 3,202 | 4,647 | 6,040 | 4,604 | 2,989 | 3,790 | 3,247 | 2,996 | 3,334 | 43,038 |
| 2011 | 2,969 | 2,796 | 3,890 | 3,376 | 4,468 | 5,684 | 4,323 | 4,109 | 3,707 | 3,313 | 2,612 | 3,001 | 44,248 |
| 2012 | 2,209 | 2,363 | 3,710 | 3,245 | 3,857 | 3,674 | 4,941 | 4,642 | 4,491 | 4,353 | 3,833 | 2,781 | 44,099 |
| 2013 | 2,741 | 2,415 | 3,255 | 4,101 | 4,718 | 4,251 | 3,973 | 4,161 | 4,045 | 4,820 | 3,662 | 2,999 | 45,141 |
| 2014 | 2,597 | 2,750 | 3,790 | 4,821 | 5,452 | 5,908 | 5,078 | 5,081 | 5,107 | 4,568 | 3,732 | 3,314 | 52,198 |
| 2015 | 2,475 | 2,354 | 3,529 | 5,020 | 5,403 | 4,817 | 3,664 | 4,442 | 4,806 | 3,913 | 4,144 | 3,159 | 47,726 |
| 2016 | 2,372 | 2,349 | 3,484 | 4,203 | 4,279 | 3,867 | 4,576 | 5,074 | 4,919 | 3,957 | 4,610 | 2,971 | 46,661 |
| 2017 | 2,399 | 2,649 | 3,884 | 4,363 | 5,397 | 4,751 | 4,256 | 4,219 | 5,259 | 4,027 | 4,120 | 2,556 | 47,880 |
| 2018 | 2,855 | 2,765 | 3,852 | 4,076 | 4,963 | 5,101 | 3,609 | 3,852 | 3,855 | 3,344 | 3,189 | 2,396 | 43,857 |
| 2019 | 2,791 | 2,537 | 2,666 | 4,469 | 4,469 | 4,063 | 3,375 | 3,375 | 3,071 | 3,121 | 2,714 | 2,852 | 39,503 |
| 2020 | 1,839 | 1,672 | 1,840 | 1,669 | 1,518 | 1,671 | 2,650 | 2,530 | 2,531 | 2,003 | 1,820 | 2,004 | 23,747 |
| 2021 | 1,126 | 1,126 | 1,295 | 3,028 | 2,753 | 3,030 | 2,791 | 2,924 | 2,793 | 1,671 | 1,671 | 1,752 | 25,960 |
| 2022 | 1,291 | 1,230 | 1,416 | 3,115 | 3,115 | 3,266 | 1,989 | 2,288 | 2,090 | 1,349 | 1,349 | 1,350 | 23,848 |
| 2023 | 1,309 | 1,190 | 1,371 | 1,781 | 1,960 | 1,961 | 1,615 | 1,857 | 1,616 | 1,706 | 1,628 | 1,552 | 19,546 |
| 2024 | 2,439 | 2,328 | 2,329 | 2,804 | 2,804 | 2,551 | 2,930 | 2,930 | 2,666 | 2,592 | 2,254 | 2,369 | 30,996 |
| 2025 | 2,226 | 2,023 | 2,126 | 2,620 | 2,500 | 2,502 | 3,245 | 3,097 | 3,098 | 3,420 | 2,825 | 3,274 | 32,956 |
| 2026 | 2,234 | 1,999 | 2,196 | 1,071 | 1,182 | 1,122 | — | — | — | — | — | — | 9,804 |








Dec 2001 and Jan 2012 Ford Escape sales show people motivated to buy the last of the classic Escape SUV shape after Ford showed the new 2013 escape.
0% and 2500 cash back helped make my mind up. Happy 2012 Escape owner.
I agree with you. I bought one because I like the look of a truck and after making this SUV for 10 years Ford has it perfected. I would never buy a first year car from any manufacturer. I love my new Escape!!!
Ford's new Escape with those EcoBoost engine options will continue to make it a winner. A 240HP engine in this class with exceptional gas mileage puts Ford ahead of many of it's competitors. The unfortunate thing about the 2013 Escape is that front end….looks like it's already been in an accident.
I drove my mother in law's 2011 Escape Limited with the V6 AWD back to back against a 2013 Escape SEL AWD 2.0 Ecoboost. I then drove a CRV, Equinox, Santa Fe (2012) and Tiguan. We are the very happy owners of the 2013 Escape SEL for reasons too numerous to mention.