

Toyota Tacoma
Here you will find monthly and yearly United States and Canadian sales figures for the Toyota Tacoma. The Tacoma has led America’s mid-size pickup segment for decades, built on a reputation for durability, off-road capability, and strong resale value. Its fourth generation, launched for 2024 on Toyota’s TNGA-F platform, brought turbocharged and hybrid power to the lineup while preserving the ruggedness that made the truck a segment leader.
- Class: Mid-size pickup truck
- Platform: Toyota TNGA-F, shared with the Tundra, Land Cruiser, and Sequoia
- Base engine: i-FORCE 2.4L turbocharged four-cylinder, up to 278 horsepower and 317 lb-ft
- Hybrid: i-FORCE MAX, 326 horsepower and 465 lb-ft
- Transmissions: Eight-speed automatic, with an available six-speed manual on select i-FORCE models
- Capability: Max towing 6,500 lb, payload up to 1,705 lb
- Trims: SR, SR5, TRD PreRunner, TRD Sport, TRD Off-Road, Limited, TRD Pro, Trailhunter
- Starting MSRP: $32,145
Toyota Tacoma Sales in the United States
The Tacoma has dominated the U.S. mid-size truck market for years. After a recession low near 107,200 units in 2010, sales climbed through the 2010s to 252,490 in 2021. The changeover to the fourth-generation truck brought a temporary dip to 192,813 in 2024 as production ramped up, then a powerful rebound: 2025 sales reached 274,638, the strongest full year in this dataset and a gain of roughly 42 percent year over year. Through June 2026 Toyota had delivered 143,848 Tacomas, keeping the truck firmly atop its segment.
Toyota Tacoma, United States calendar-year unit sales, 2005–2026. 2026 is January–Aug (partial).
Annual sales
| Year | Units | YoY |
|---|---|---|
| 2005 | 168,811 | — |
| 2006 | 178,351 | ▲ 5.7% |
| 2007 | 173,238 | ▼ 2.9% |
| 2008 | 144,653 | ▼ 16.5% |
| 2009 | 111,824 | ▼ 22.7% |
| 2010 | 107,198 | ▼ 4.1% |
| 2011 | 110,705 | ▲ 3.3% |
| 2012 | 131,753 | ▲ 19.0% |
| 2013 | 159,485 | ▲ 21.0% |
| 2014 | 155,041 | ▼ 2.8% |
| 2015 | 179,562 | ▲ 15.8% |
| 2016 | 191,631 | ▲ 6.7% |
| 2017 | 198,124 | ▲ 3.4% |
| 2018 | 245,659 | ▲ 24.0% |
| 2019 | 248,801 | ▲ 1.3% |
| 2020 | 238,805 | ▼ 4.0% |
| 2021 | 252,490 | ▲ 5.7% |
| 2022 | 215,853 | ▼ 14.5% |
| 2023 | 234,768 | ▲ 8.8% |
| 2024 | 192,813 | ▼ 17.9% |
| 2025 | 274,638 | ▲ 42.4% |
| 2026 (Jan–Aug) | 193,399 | ▲ 5.1% YTD |
Monthly sales
| Year | Jan | Feb | Mar | Apr | May | Jun | Jul | Aug | Sep | Oct | Nov | Dec | Total |
|---|---|---|---|---|---|---|---|---|---|---|---|---|---|
| 2005 | 9,435 | 10,930 | 13,729 | 15,147 | 14,343 | 14,328 | 16,410 | 16,140 | 14,632 | 14,486 | 13,878 | 15,353 | 168,811 |
| 2006 | 12,410 | 13,735 | 15,662 | 15,220 | 14,842 | 13,995 | 15,339 | 16,022 | 16,687 | 14,121 | 14,461 | 15,857 | 178,351 |
| 2007 | 13,063 | 15,022 | 18,243 | 14,771 | 16,028 | 15,335 | 13,963 | 15,094 | 13,996 | 12,449 | 11,985 | 13,289 | 173,238 |
| 2008 | 11,064 | 13,125 | 15,587 | 15,587 | 17,341 | 11,364 | 11,662 | 12,407 | 9,176 | 10,001 | 8,648 | 8,691 | 144,653 |
| 2009 | 7,619 | 7,874 | 9,444 | 9,027 | 10,162 | 9,035 | 12,552 | 12,547 | 7,513 | 8,921 | 7,633 | 9,497 | 111,824 |
| 2010 | 6,747 | 8,325 | 9,441 | 9,407 | 8,630 | 9,247 | 9,674 | 8,239 | 8,874 | 9,028 | 8,616 | 10,970 | 107,198 |
| 2011 | 7,140 | 7,879 | 10,144 | 10,510 | 9,091 | 8,131 | 8,929 | 8,650 | 8,180 | 10,172 | 9,739 | 12,140 | 110,705 |
| 2012 | 8,898 | 1,062 | 12,547 | 10,901 | 12,269 | 11,864 | 11,350 | 12,193 | 12,176 | 12,191 | 12,272 | 14,030 | 131,753 |
| 2013 | 11,622 | 12,644 | 15,201 | 12,971 | 14,727 | 14,023 | 13,882 | 15,223 | 11,479 | 12,351 | 12,601 | 12,761 | 159,485 |
| 2014 | 9,842 | 10,942 | 14,445 | 13,871 | 13,876 | 12,173 | 13,249 | 14,338 | 11,993 | 13,010 | 13,018 | 14,284 | 155,041 |
| 2015 | 11,409 | 12,372 | 15,885 | 15,656 | 17,520 | 15,959 | 17,033 | 16,230 | 11,608 | 15,233 | 13,465 | 17,192 | 179,562 |
| 2016 | 12,717 | 14,172 | 17,687 | 18,106 | 16,544 | 15,809 | 16,580 | 15,373 | 15,723 | 15,875 | 15,531 | 17,514 | 191,631 |
| 2017 | 12,509 | 14,256 | 16,728 | 17,006 | 17,654 | 16,443 | 17,372 | 17,394 | 18,058 | 15,804 | 16,195 | 18,705 | 198,124 |
| 2018 | 16,712 | 16,817 | 20,250 | 18,811 | 21,380 | 22,296 | 21,844 | 23,534 | 22,265 | 20,534 | 19,685 | 21,531 | 245,659 |
| 2019 | 16,852 | 18,533 | 22,798 | 20,375 | 22,832 | 20,476 | 20,416 | 27,010 | 18,330 | 19,725 | 20,727 | 20,727 | 248,801 |
| 2020 | 17,112 | 20,609 | 15,915 | 9,191 | 20,425 | 21,446 | 17,412 | 20,579 | 20,929 | 23,774 | 22,456 | 28,957 | 238,805 |
| 2021 | 18,878 | 20,578 | 26,993 | 24,448 | 23,488 | 24,911 | 23,558 | 19,661 | 18,086 | 14,650 | 17,816 | 19,423 | 252,490 |
| 2022 | 15,285 | 16,185 | 21,712 | 17,842 | 16,285 | 21,339 | 23,917 | 21,837 | — | 21,051 | 19,545 | 20,855 | 215,853 |
| 2023 | 17,851 | 17,058 | 18,674 | 21,454 | 20,487 | 21,321 | 20,126 | 22,131 | 20,579 | 17,456 | 18,156 | 19,475 | 234,768 |
| 2024 | 8,203 | 5,045 | 8,310 | 15,859 | 17,091 | 14,929 | 18,571 | 20,770 | 18,027 | 19,971 | 23,322 | 22,715 | 192,813 |
| 2025 | 18,766 | 17,110 | 23,949 | 23,036 | 26,504 | 21,508 | 26,425 | 26,774 | 20,392 | 22,660 | 22,439 | 25,075 | 274,638 |
| 2026 | 21,466 | 22,799 | 24,998 | 24,777 | 26,650 | 23,158 | 25,148 | 24,403 | — | — | — | — | 193,399 |
Toyota Tacoma Sales in Canada
Canadian Tacoma sales have trended upward over the long run, rising from single-digit thousands in the mid-2000s to a range of 12,000 to 16,000 in recent years. As in the United States, the generational transition produced a soft 2024 at 10,728 units before a sharp recovery to 16,526 in 2025, among the Tacoma’s best Canadian results on record.
Toyota Tacoma, Canada calendar-year unit sales, 2004–2026. 2026 is January–Aug (partial).
Annual sales
| Year | Units | YoY |
|---|---|---|
| 2004 | 2,836 | — |
| 2005 | 6,388 | ▲ 125.2% |
| 2006 | 9,345 | ▲ 46.3% |
| 2007 | 9,477 | ▲ 1.4% |
| 2008 | 9,673 | ▲ 2.1% |
| 2009 | 9,082 | ▼ 6.1% |
| 2010 | 8,111 | ▼ 10.7% |
| 2011 | 7,711 | ▼ 4.9% |
| 2012 | 9,904 | ▲ 28.4% |
| 2013 | 10,400 | ▲ 5.0% |
| 2014 | 9,973 | ▼ 4.1% |
| 2015 | 11,772 | ▲ 18.0% |
| 2016 | 12,618 | ▲ 7.2% |
| 2017 | 12,454 | ▼ 1.3% |
| 2018 | 13,878 | ▲ 11.4% |
| 2019 | 12,536 | ▼ 9.7% |
| 2020 | 14,376 | ▲ 14.7% |
| 2021 | 14,878 | ▲ 3.5% |
| 2022 | 12,738 | ▼ 14.4% |
| 2023 | 16,433 | ▲ 29.0% |
| 2024 | 10,728 | ▼ 34.7% |
| 2025 | 16,526 | ▲ 54.0% |
| 2026 (Jan–Aug) | 12,616 | ▲ 23.7% YTD |
Monthly sales
| Year | Jan | Feb | Mar | Apr | May | Jun | Jul | Aug | Sep | Oct | Nov | Dec | Total |
|---|---|---|---|---|---|---|---|---|---|---|---|---|---|
| 2004 | 107 | 136 | 198 | 204 | 212 | 227 | 150 | 180 | 112 | 161 | 593 | 556 | 2,836 |
| 2005 | 300 | 331 | 348 | 545 | 663 | 652 | 554 | 495 | 445 | 706 | 689 | 660 | 6,388 |
| 2006 | 429 | 486 | 797 | 866 | 988 | 828 | 853 | 860 | 820 | 910 | 829 | 679 | 9,345 |
| 2007 | 546 | 586 | 883 | 923 | 1,074 | 940 | 865 | 806 | 842 | 746 | 532 | 734 | 9,477 |
| 2008 | 529 | 643 | 832 | 947 | 1,171 | 825 | 873 | 894 | 944 | 761 | 691 | 563 | 9,673 |
| 2009 | 488 | 410 | 633 | 793 | 1,240 | 1,085 | 793 | 522 | 596 | 797 | 740 | 985 | 9,082 |
| 2010 | 540 | 745 | 1,078 | 837 | 761 | 713 | 611 | 510 | 645 | 637 | 511 | 523 | 8,111 |
| 2011 | 417 | 458 | 872 | 907 | 473 | 617 | 545 | 640 | 560 | 841 | 695 | 686 | 7,711 |
| 2012 | 512 | 715 | 811 | 844 | 919 | 807 | 718 | 839 | 940 | 1,074 | 897 | 828 | 9,904 |
| 2013 | 581 | 595 | 899 | 987 | 1,049 | 1,004 | 1,053 | 962 | 915 | 911 | 811 | 633 | 10,400 |
| 2014 | 622 | 558 | 916 | 1,020 | 1,104 | 900 | 878 | 797 | 826 | 929 | 811 | 612 | 9,973 |
| 2015 | 490 | 564 | 894 | 929 | 921 | 925 | 1,036 | 1,107 | 1,001 | 1,725 | 1,221 | 959 | 11,772 |
| 2016 | 939 | 870 | 1,093 | 1,397 | 1,345 | 1,183 | 1,007 | 900 | 948 | 1,047 | 939 | 950 | 12,618 |
| 2017 | 819 | 767 | 1,110 | 993 | 1,352 | 1,273 | 1,048 | 1,011 | 1,093 | 1,072 | 973 | 943 | 12,454 |
| 2018 | 1,018 | 1,022 | 1,299 | 1,108 | 1,286 | 1,411 | 1,143 | 1,170 | 1,246 | 1,163 | 1,142 | 870 | 13,878 |
| 2019 | 921 | 838 | 881 | 1,264 | 1,264 | 1,151 | 1,076 | 1,076 | 981 | 1,108 | 963 | 1,013 | 12,536 |
| 2020 | 930 | 845 | 932 | 1,092 | 993 | 1,093 | 1,557 | 1,486 | 1,488 | 1,361 | 1,237 | 1,362 | 14,376 |
| 2021 | 785 | 785 | 905 | 1,675 | 1,523 | 1,676 | 1,441 | 1,509 | 1,442 | 1,029 | 1,029 | 1,079 | 14,878 |
| 2022 | 1,043 | 993 | 1,144 | 1,427 | 1,427 | 1,495 | 600 | 690 | 631 | 1,096 | 1,096 | 1,096 | 12,738 |
| 2023 | 652 | 592 | 683 | 1,726 | 1,898 | 1,900 | 1,372 | 1,578 | 1,374 | 1,626 | 1,552 | 1,480 | 16,433 |
| 2024 | 345 | 330 | 331 | 1,323 | 1,323 | 1,203 | 1,069 | 1,069 | 974 | 992 | 862 | 907 | 10,728 |
| 2025 | 954 | 867 | 911 | 1,264 | 1,207 | 1,208 | 1,937 | 1,849 | 1,851 | 1,609 | 1,329 | 1,540 | 16,526 |
| 2026 | 834 | 997 | 1,590 | 1,737 | 1,738 | 1,998 | 1,924 | 1,798 | — | — | — | — | 12,616 |
Toyota Tacoma Generations
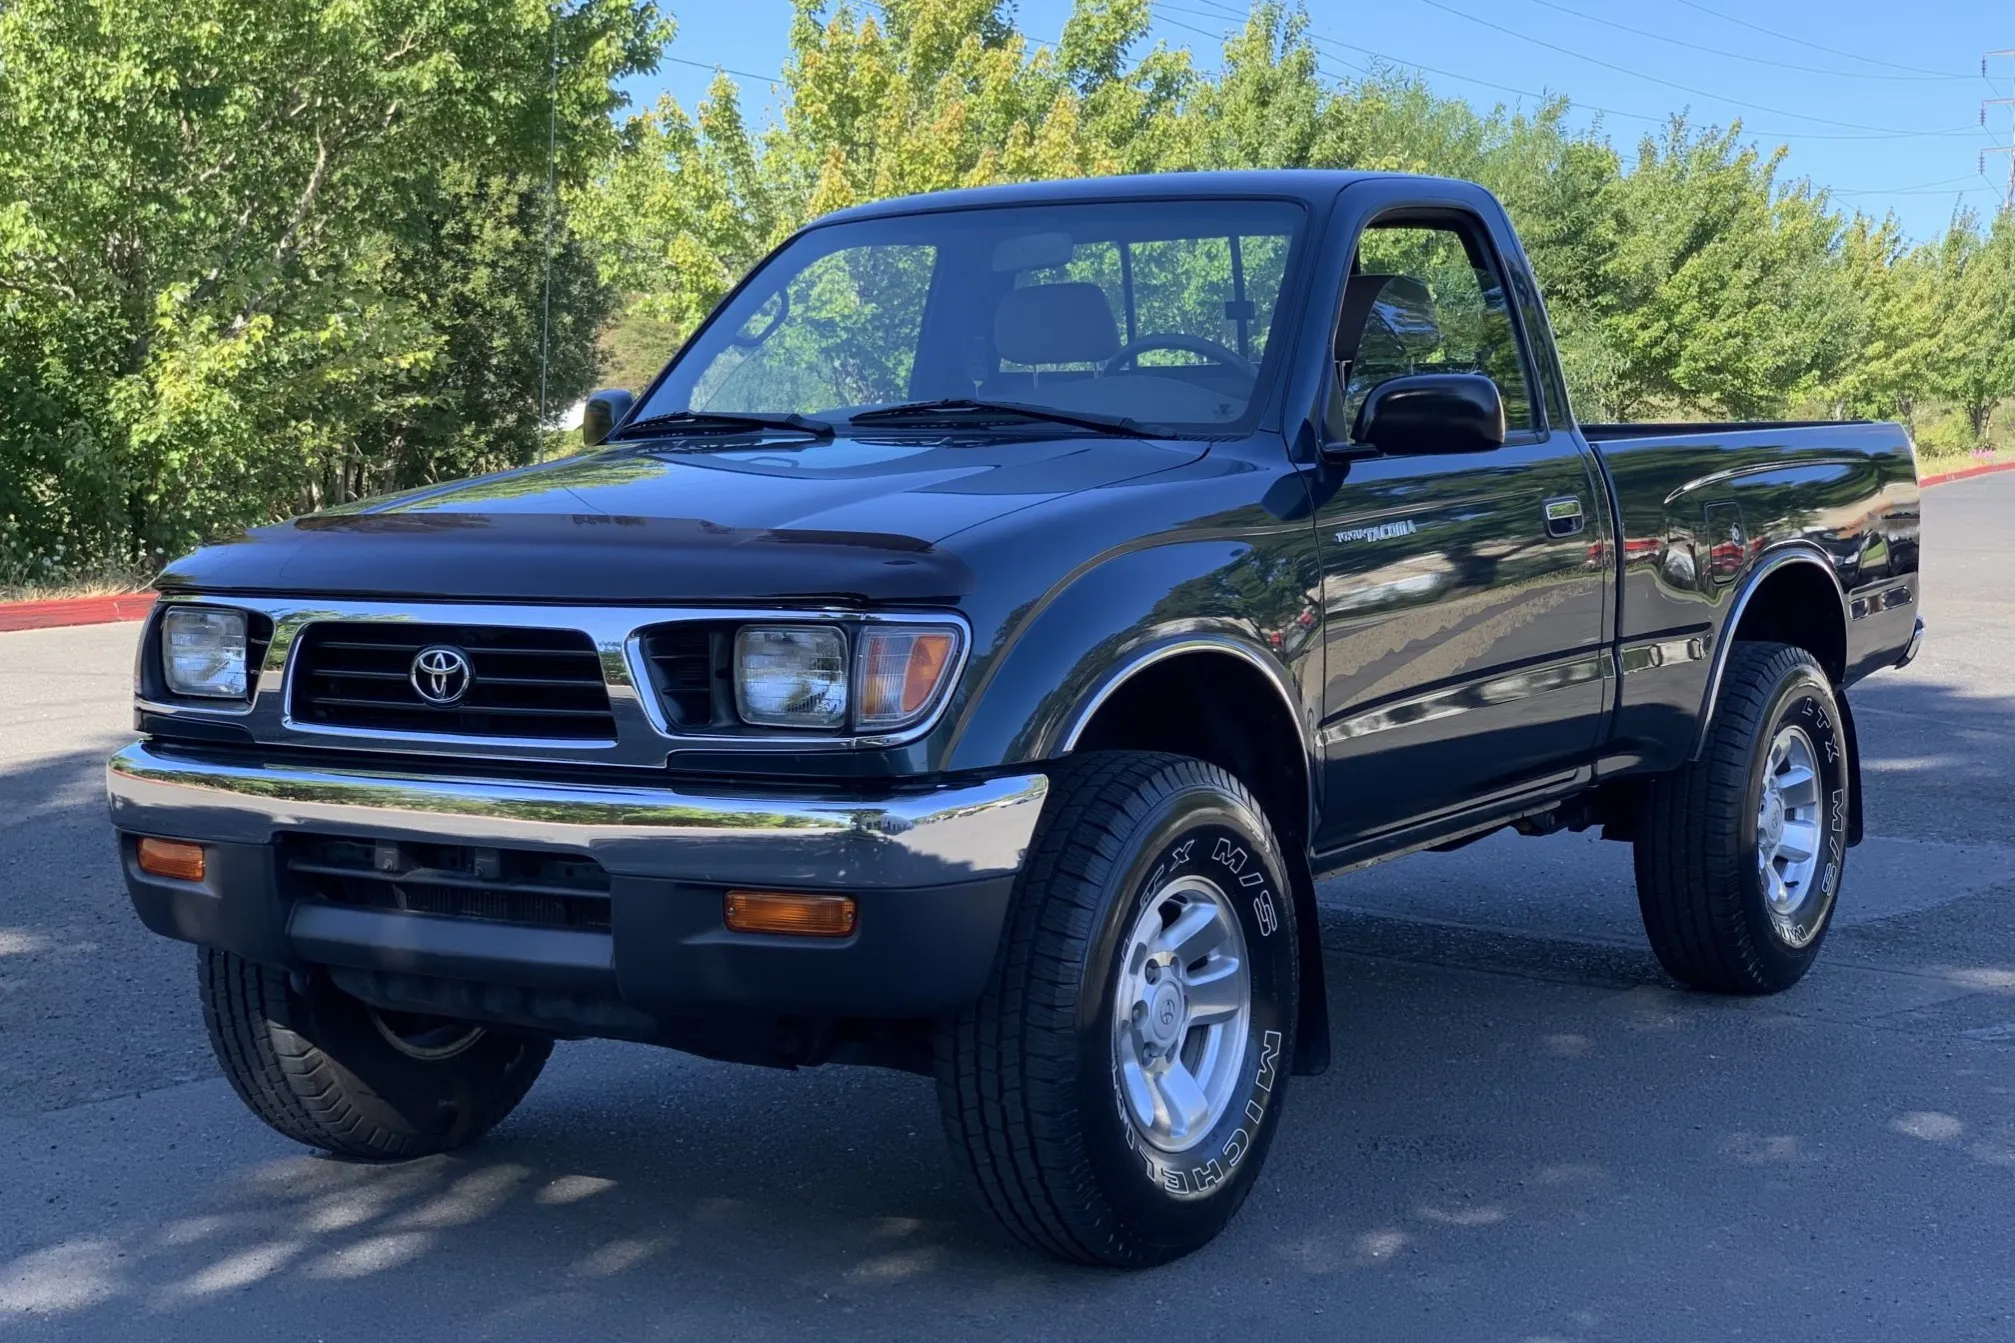 First Generation (1995-2004)
Toyota introduced the Tacoma in 1995 as the successor to the Hilux in North American markets. Available in regular cab and extended cab configurations with short or long bed options, the first-generation Tacoma offered a 2.4-liter four-cylinder or a 2.7-liter four-cylinder as standard power, with a 3.4-liter V6 optional. Both rear-wheel drive and four-wheel drive configurations were available. The first-generation truck established the Tacoma’s reputation for reliability and off-road capability, particularly in TRD variants that gained popularity among enthusiasts tackling trails in the American Southwest.
 Second Generation (2005-2015)
The second-generation Tacoma grew slightly larger and added a crew cab option alongside regular and extended cab configurations. Engine choices included a 2.7-liter four-cylinder and a 4.0-liter V6 producing 236 horsepower. This generation introduced the TRD Off-Road and TRD Sport packages that remain pillars of the Tacoma lineup today. The truck received a facelift in 2012 but retained its basic architecture throughout its decade-long production run. Strong resale values during this era helped cement the Tacoma’s reputation as a smart long-term purchase.
 Third Generation (2016-2023)
Toyota redesigned the Tacoma for 2016 with more aggressive styling and an updated 3.5-liter V6 producing 278 horsepower. The naturally aspirated four-cylinder carried over as the base engine. This generation added features like crawl control and multi-terrain select for serious off-roading, while the TRD Pro became the halo trim for buyers wanting factory-built trail capability. Despite criticism of its dated interior and firm ride quality, the third-generation Tacoma continued dominating mid-size truck sales throughout its production run.
 Fourth Generation (2024-Present)
The current Tacoma represents the most significant redesign in the truck’s history. Built on Toyota’s TNGA-F platform, the fourth generation shares its architecture with the Tundra and Land Cruiser. Toyota eliminated the naturally aspirated engines entirely, standardizing turbocharged power across the lineup. The base i-FORCE engine produces 228 horsepower in SR trim and 278 horsepower elsewhere, while the i-FORCE MAX hybrid delivers 326 horsepower and segment-leading torque.
Interior quality jumped substantially, with available features including a 14-inch touchscreen, head-up display, and JBL premium audio. The new coil-spring rear suspension on most trims addresses long-standing complaints about ride comfort. Toyota also introduced the Trailhunter trim developed with ARB for overlanding adventures, joining the TRD Off-Road and TRD Pro in the off-road-focused lineup. Pricing starts around $31,500 for the base SR and climbs past $60,000 for fully loaded TRD Pro and Trailhunter variants with the hybrid powertrain.







