
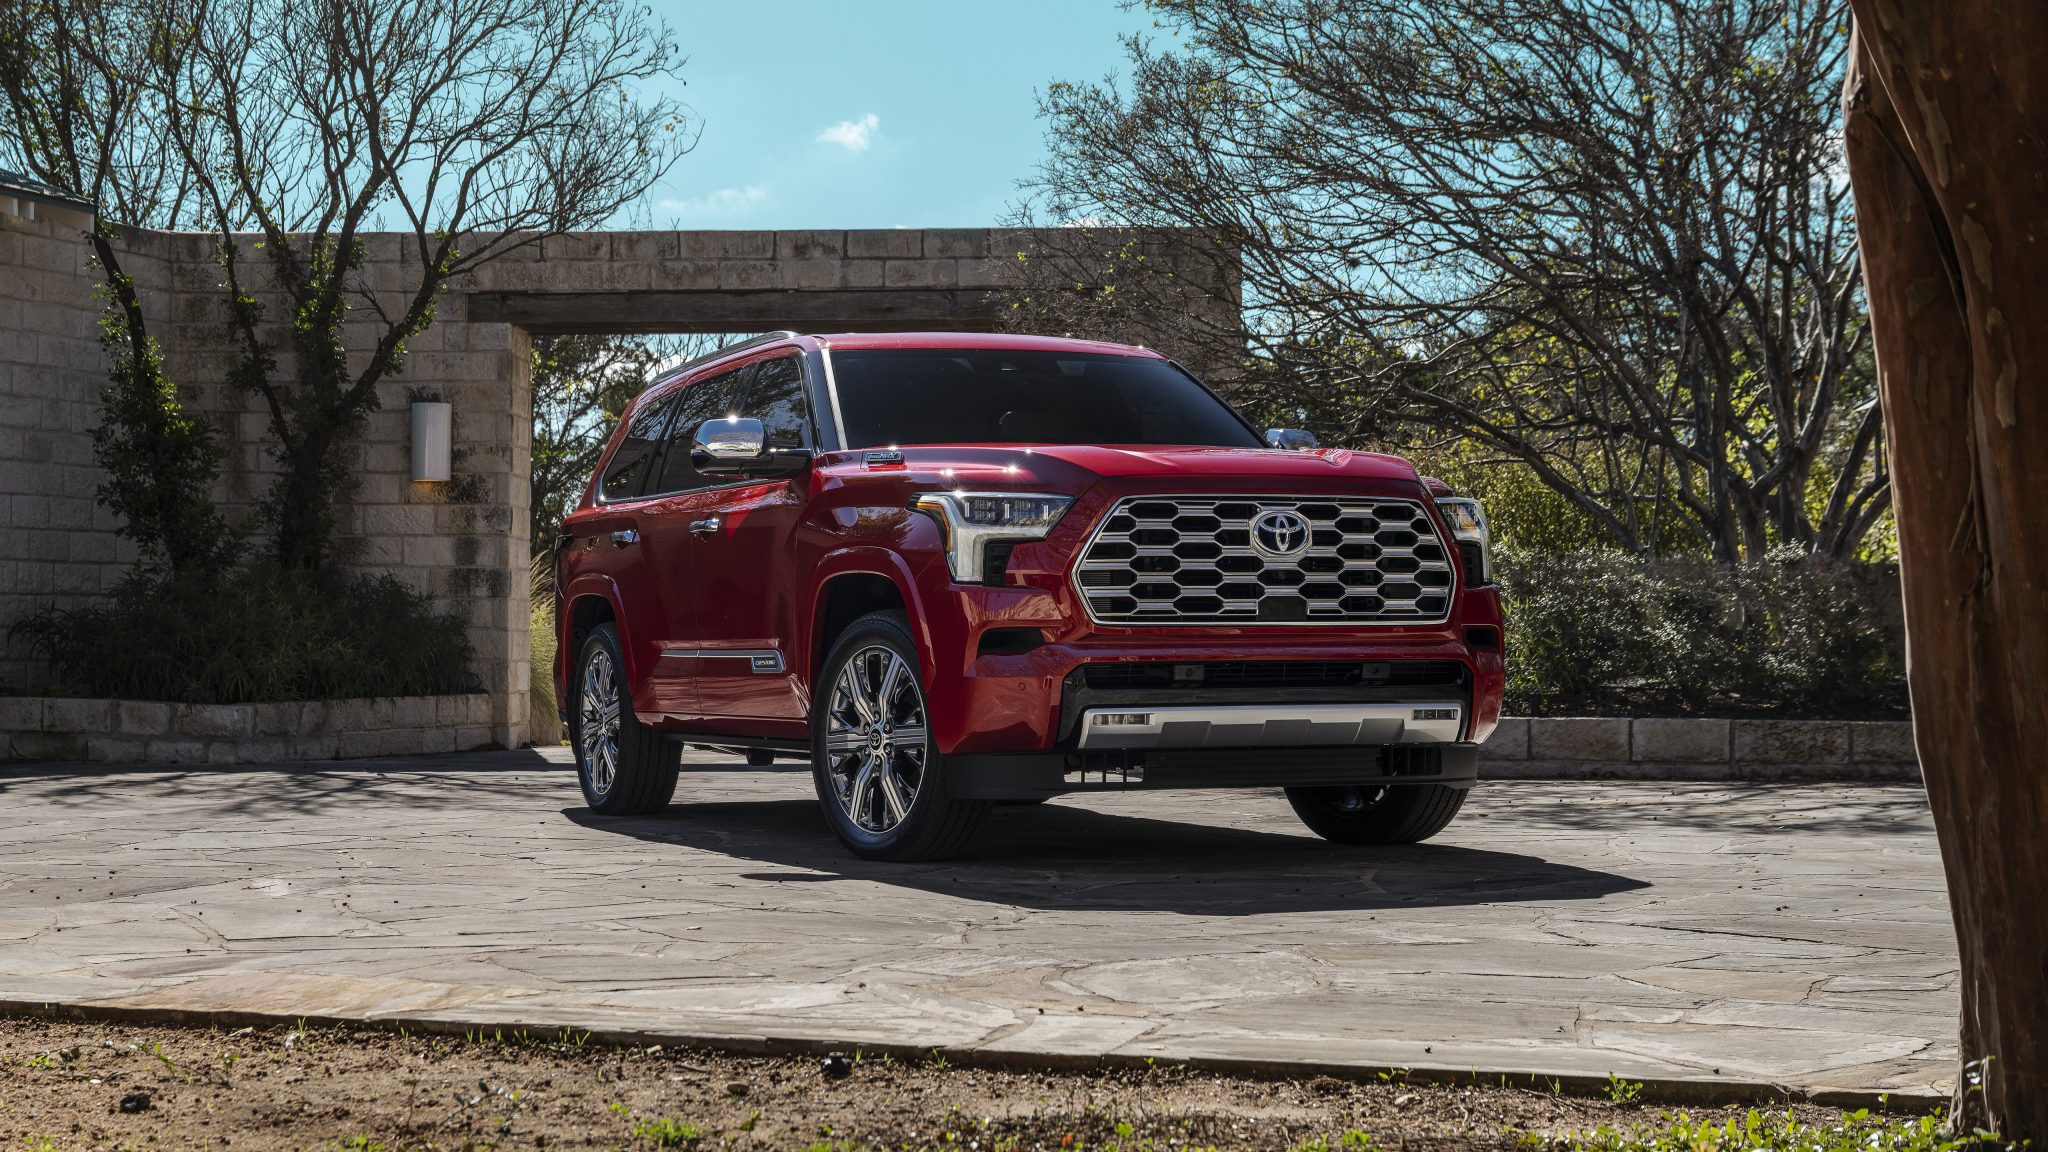
Toyota Sequoia
Here you will find monthly and yearly United States and Canadian sales figures for the Toyota Sequoia. The Sequoia is Toyota’s full-size, body-on-frame three row SUV, built on the same platform as the Tundra pickup and sitting above the Grand Highlander in the lineup. Since the third generation arrived for 2023 it has been sold only as a hybrid. Its chief rivals are the Chevrolet Tahoe, Ford Expedition, GMC Yukon, Jeep Wagoneer and Nissan Armada.
- Class: Full-size body-on-frame SUV
- Powertrain: i-FORCE MAX twin-turbo V6 hybrid, 437 hp and 583 lb-ft, standard on every grade
- Transmission: 10-speed automatic
- Drivetrain: Rear-wheel drive or part-time four-wheel drive; 4WD standard on 1794, Platinum, TRD Pro and Capstone
- Trims: SR5, Limited, 1794, Platinum, TRD Pro, Capstone
- Max towing: Up to 9,520 lb
- Chief rivals: Chevrolet Tahoe, Ford Expedition, GMC Yukon, Jeep Wagoneer, Nissan Armada
For 2026 Toyota makes power folding third row seats standard on all grades.
Toyota Sequoia Sales in the United States
Toyota Sequoia sales in the United States open this dataset at 45,904 units in 2005, comfortably the best year on record for the nameplate. Volume fell quickly from there, to 34,315 in 2006 and 23,273 in 2007, and after the recession the second generation settled into a long plateau between roughly 10,000 and 14,000 units a year through the 2010s as it aged without a full replacement. The bottom came in 2022 at 5,313 as that generation wound down, with several months in single digits. The hybrid only third generation transformed the picture: 20,557 in 2023, 26,097 in 2024 and 26,186 in 2025, the strongest full year since 2006. Momentum has carried into 2026, with 13,939 units delivered through June against 12,222 at the same point a year earlier, a gain of about 14 percent. One caveat on the chart: June 2023 is absent from the monthly record, so the 2023 annual is understated.
Toyota Sequoia, United States calendar-year unit sales, 2005–2026. 2026 is January–Aug (partial).
Annual sales
| Year | Units | YoY |
|---|---|---|
| 2005 | 45,904 | — |
| 2006 | 34,315 | ▼ 25.2% |
| 2007 | 23,273 | ▼ 32.2% |
| 2008 | 30,693 | ▲ 31.9% |
| 2009 | 16,387 | ▼ 46.6% |
| 2010 | 13,848 | ▼ 15.5% |
| 2011 | 13,022 | ▼ 6.0% |
| 2012 | 13,151 | ▲ 1.0% |
| 2013 | 13,811 | ▲ 5.0% |
| 2014 | 11,786 | ▼ 14.7% |
| 2015 | 12,583 | ▲ 6.8% |
| 2016 | 12,771 | ▲ 1.5% |
| 2017 | 12,156 | ▼ 4.8% |
| 2018 | 11,121 | ▼ 8.5% |
| 2019 | 10,289 | ▼ 7.5% |
| 2020 | 7,364 | ▼ 28.4% |
| 2021 | 8,070 | ▲ 9.6% |
| 2022 | 5,313 | ▼ 34.2% |
| 2023 | 20,557 | ▲ 286.9% |
| 2024 | 26,097 | ▲ 26.9% |
| 2025 | 26,186 | ▲ 0.3% |
| 2026 (Jan–Aug) | 18,972 | ▲ 15.3% YTD |
Monthly sales
| Year | Jan | Feb | Mar | Apr | May | Jun | Jul | Aug | Sep | Oct | Nov | Dec | Total |
|---|---|---|---|---|---|---|---|---|---|---|---|---|---|
| 2005 | 3,604 | 4,112 | 4,409 | 4,039 | 3,997 | 4,008 | 4,325 | 3,162 | 2,334 | 2,664 | 3,910 | 5,340 | 45,904 |
| 2006 | 2,754 | 2,868 | 3,446 | 2,771 | 2,575 | 2,484 | 2,653 | 2,479 | 3,343 | 2,705 | 2,860 | 3,377 | 34,315 |
| 2007 | 2,058 | 2,312 | 2,568 | 1,991 | 1,967 | 1,953 | 1,733 | 1,717 | 1,660 | 1,514 | 1,233 | 2,567 | 23,273 |
| 2008 | 2,377 | 2,617 | 2,856 | 2,675 | 3,575 | 2,444 | 2,823 | 3,195 | 2,030 | 1,829 | 1,873 | 2,399 | 30,693 |
| 2009 | 1,592 | 1,606 | 2,181 | 1,200 | 1,331 | 1,111 | 789 | 792 | 1,150 | 1,478 | 1,397 | 1,760 | 16,387 |
| 2010 | 644 | 721 | 1,177 | 995 | 1,049 | 1,114 | 1,233 | 1,059 | 1,208 | 1,447 | 1,431 | 1,770 | 13,848 |
| 2011 | 964 | 998 | 1,098 | 997 | 913 | 925 | 1,036 | 917 | 860 | 1,088 | 1,304 | 1,922 | 13,022 |
| 2012 | 1,068 | 1,040 | 1,123 | 882 | 1,043 | 1,093 | 1,020 | 1,004 | 963 | 1,019 | 1,363 | 1,533 | 13,151 |
| 2013 | 1,180 | 1,064 | 1,140 | 962 | 1,202 | 1,145 | 1,072 | 1,280 | 1,014 | 1,169 | 1,201 | 1,382 | 13,811 |
| 2014 | 767 | 980 | 1,131 | 991 | 1,068 | 973 | 971 | 913 | 850 | 911 | 970 | 1,261 | 11,786 |
| 2015 | 904 | 856 | 1,051 | 992 | 1,145 | 1,144 | 1,015 | 1,048 | 1,144 | 1,303 | 974 | 1,007 | 12,583 |
| 2016 | 852 | 954 | 1,199 | 1,172 | 1,126 | 994 | 1,025 | 905 | 907 | 939 | 1,123 | 1,575 | 12,771 |
| 2017 | 1,146 | 1,179 | 1,112 | 948 | 964 | 862 | 963 | 864 | 961 | 996 | 1,009 | 1,152 | 12,156 |
| 2018 | 923 | 899 | 1,006 | 860 | 868 | 885 | 907 | 785 | 972 | 892 | 993 | 1,131 | 11,121 |
| 2019 | 726 | 841 | 843 | 592 | 793 | 769 | 1,041 | 1,122 | 856 | 915 | 915 | 876 | 10,289 |
| 2020 | 505 | 571 | 332 | 202 | 448 | 470 | 666 | 769 | 770 | 831 | 752 | 1,048 | 7,364 |
| 2021 | 674 | 611 | 752 | 770 | 795 | 736 | 728 | 537 | 508 | 450 | 704 | 805 | 8,070 |
| 2022 | 263 | 104 | 55 | 26 | 10 | 19 | 12 | 9 | 9 | 988 | 1,745 | 2,073 | 5,313 |
| 2023 | 1,231 | 1,345 | 1,808 | 1,808 | 1,760 | — | 1,639 | 2,445 | 2,129 | 1,976 | 1,948 | 2,468 | 20,557 |
| 2024 | 1,728 | 1,976 | 2,254 | 2,123 | 2,443 | 2,344 | 2,146 | 2,422 | 1,854 | 2,481 | 2,221 | 2,105 | 26,097 |
| 2025 | 1,381 | 1,830 | 1,896 | 2,602 | 2,387 | 2,126 | 2,278 | 1,950 | 2,036 | 2,592 | 2,474 | 2,634 | 26,186 |
| 2026 | 1,896 | 2,268 | 2,218 | 2,418 | 2,682 | 2,457 | 2,562 | 2,471 | — | — | — | — | 18,972 |
Toyota Sequoia Sales in Canada
Canadian volume is small but the shape of the series matches the American one. The Sequoia ran between roughly 380 and 950 units a year from 2004 through 2020, then bottomed at 146 in 2022 during the generation changeover. The new model lifted Canadian sales to 642 in 2023, 1,001 in 2024 and 1,017 in 2025, the two highest totals anywhere in the Canadian series. Through June 2026 Toyota Canada has delivered 516 Sequoias against 535 at the same point last year, essentially holding flat after two years of gains.
Toyota Sequoia, Canada calendar-year unit sales, 2004–2026. 2026 is January–Aug (partial).
Annual sales
| Year | Units | YoY |
|---|---|---|
| 2004 | 562 | — |
| 2005 | 477 | ▼ 15.1% |
| 2006 | 377 | ▼ 21.0% |
| 2007 | 195 | ▼ 48.3% |
| 2008 | 842 | ▲ 331.8% |
| 2009 | 800 | ▼ 5.0% |
| 2010 | 912 | ▲ 14.0% |
| 2011 | 733 | ▼ 19.6% |
| 2012 | 744 | ▲ 1.5% |
| 2013 | 744 | ▲ 0.0% |
| 2014 | 713 | ▼ 4.2% |
| 2015 | 663 | ▼ 7.0% |
| 2016 | 697 | ▲ 5.1% |
| 2017 | 755 | ▲ 8.3% |
| 2018 | 684 | ▼ 9.4% |
| 2019 | 543 | ▼ 20.6% |
| 2020 | 384 | ▼ 29.3% |
| 2021 | 418 | ▲ 8.9% |
| 2022 | 146 | ▼ 65.1% |
| 2023 | 642 | ▲ 339.7% |
| 2024 | 1,001 | ▲ 55.9% |
| 2025 | 1,017 | ▲ 1.6% |
| 2026 (Jan–Aug) | 683 | ▼ 1.2% YTD |
Monthly sales
| Year | Jan | Feb | Mar | Apr | May | Jun | Jul | Aug | Sep | Oct | Nov | Dec | Total |
|---|---|---|---|---|---|---|---|---|---|---|---|---|---|
| 2004 | 41 | 48 | 68 | 41 | 42 | 38 | 37 | 32 | 54 | 58 | 50 | 53 | 562 |
| 2005 | 31 | 33 | 43 | 45 | 50 | 41 | 37 | 30 | 38 | 40 | 52 | 37 | 477 |
| 2006 | 36 | 39 | 39 | 32 | 34 | 30 | 21 | 21 | 25 | 39 | 32 | 29 | 377 |
| 2007 | 21 | 23 | 30 | 21 | 20 | 16 | 13 | 4 | 7 | 13 | 6 | 21 | 195 |
| 2008 | 4 | 75 | 170 | 131 | 100 | 61 | 66 | 62 | 58 | 26 | 35 | 54 | 842 |
| 2009 | 61 | 53 | 46 | 34 | 55 | 92 | 59 | 87 | 71 | 88 | 65 | 89 | 800 |
| 2010 | 88 | 60 | 104 | 87 | 77 | 57 | 62 | 39 | 75 | 84 | 84 | 95 | 912 |
| 2011 | 59 | 74 | 76 | 71 | 60 | 67 | 36 | 46 | 37 | 57 | 75 | 75 | 733 |
| 2012 | 54 | 118 | 56 | 63 | 66 | 48 | 50 | 33 | 31 | 72 | 101 | 52 | 744 |
| 2013 | 60 | 43 | 51 | 71 | 72 | 61 | 52 | 55 | 66 | 79 | 71 | 63 | 744 |
| 2014 | 67 | 75 | 105 | 60 | 55 | 41 | 47 | 43 | 42 | 68 | 43 | 67 | 713 |
| 2015 | 58 | 55 | 47 | 53 | 49 | 63 | 50 | 40 | 51 | 63 | 67 | 67 | 663 |
| 2016 | 48 | 68 | 78 | 82 | 46 | 52 | 75 | 44 | 59 | 50 | 44 | 51 | 697 |
| 2017 | 65 | 54 | 92 | 61 | 67 | 49 | 45 | 27 | 60 | 70 | 84 | 81 | 755 |
| 2018 | 46 | 50 | 75 | 88 | 63 | 81 | 51 | 48 | 49 | 31 | 56 | 46 | 684 |
| 2019 | 45 | 41 | 44 | 60 | 60 | 57 | 51 | 51 | 48 | 30 | 26 | 30 | 543 |
| 2020 | 29 | 26 | 30 | 24 | 21 | 25 | 43 | 41 | 42 | 35 | 32 | 36 | 384 |
| 2021 | 34 | 34 | 42 | 44 | 40 | 45 | 27 | 29 | 29 | 30 | 30 | 34 | 418 |
| 2022 | 15 | 14 | 17 | 1 | 1 | 3 | 0 | 0 | 0 | 31 | 31 | 33 | 146 |
| 2023 | 27 | 24 | 29 | 63 | 69 | 71 | 66 | 76 | 68 | 52 | 49 | 48 | 642 |
| 2024 | 57 | 54 | 55 | 117 | 117 | 108 | 89 | 89 | 83 | 83 | 72 | 77 | 1,001 |
| 2025 | 56 | 51 | 54 | 128 | 122 | 124 | 80 | 76 | 78 | 89 | 73 | 86 | 1,017 |
| 2026 | 55 | 50 | 98 | 133 | 77 | 103 | 95 | 72 | — | — | — | — | 683 |
Toyota Sequoia Generations
First Generation (2001-2007)
Introduced in 2000 for the 2001 model year, the first-generation Sequoia was based on the Toyota Tundra pickup truck’s platform. It was designed with the North American market in mind, aiming to compete with other large SUVs. This generation was powered by a 4.7-liter V8 engine, coupled with a 4-speed automatic transmission. Inside, the Sequoia offered three rows of seating, accommodating up to eight passengers. The first generation Sequoia was praised for its spacious interior, comfortable ride, and powerful engine. It was also awarded a number of safety awards, including a five-star rating from the National Highway Traffic Safety Administration (NHTSA).
Second Generation (2008-2022)
The second generation of the Toyota Sequoia was introduced in 2008. It was available in two wheelbases: a standard wheelbase and a long wheelbase. It was also available in three trim levels: SR5, Limited, and Platinum. The second generation Sequoia was powered by a 4.6-liter V8 engine that produced 310 horsepower and 327 pound-feet of torque. It was mated to a six-speed automatic transmission. The second generation Sequoia was praised for its improved fuel economy, its more comfortable ride, and its more modern interior. It was also awarded a number of safety awards, including a five-star rating from the National Highway Traffic Safety Administration (NHTSA).
Third generation (2023-present)
The third generation of the Toyota Sequoia was introduced in 2023. It is the current generation of the Sequoia. It is available in two wheelbases: a standard wheelbase and a long wheelbase. It is also available in three trim levels: SR5, Limited, and Platinum. The third generation Sequoia is powered by a 3.5-liter twin-turbocharged V6 engine that produces 415 horsepower and 479 pound-feet of torque. It is mated to an eight-speed automatic transmission. The third generation Sequoia has been praised for its improved fuel economy, its more comfortable ride, and its more modern interior. The third generation Sequoia is the most powerful and efficient Sequoia yet. It is also the most technologically advanced Sequoia yet, with features like a 12.3-inch digital instrument cluster and a 14-inch touchscreen infotainment system.







