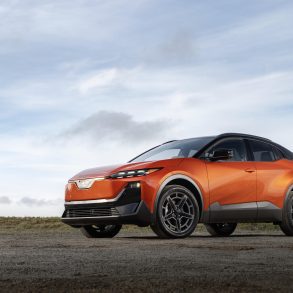
Toyota GR86
Here you will find monthly and yearly United States and Canadian sales figures for the Toyota GR86 and the cars that came before it under other names. The rear-wheel-drive sports coupe arrived for the 2013 model year as the Scion FR-S, became the Toyota 86 for 2017 after Toyota folded the Scion brand, and returned in second-generation form as the GR86 for the 2022 model year. The charts below follow the nameplate continuously across all three names. Its closest rival is its twin, the Subaru BRZ, followed by the Mazda MX-5 Miata.
- Class: Rear-wheel-drive 2+2 sports coupe
- Engine (GR86): 2.4L naturally aspirated flat-four boxer with D-4S direct and port injection, 228 hp and 184 lb-ft at 3,700 rpm
- Transmissions: 6-speed manual or 6-speed automatic with paddle shifters, offered on every grade
- Drivetrain: Rear-wheel drive with a Torsen limited-slip differential
- U.S. grades (2026): GR86, GR86 Premium and the GR86 Yuzu Edition, limited to 860 cars for North America
- Earlier generation: the Scion FR-S (2013 to 2016 model years) and Toyota 86 (2017 to 2021) used a 2.0L flat-four with the same choice of 6-speed manual or automatic
- Chief rivals: Subaru BRZ, Mazda MX-5 Miata
Toyota GR86 Sales in the United States
The U.S. chart opens in May 2012 as the Scion FR-S reached dealers, and June 2012 is the best month on the chart at 2,684. The first full year, 2013, set the peak at 18,327, after which volume eased to 14,062 in 2014, 10,507 in 2015 and 7,457 in 2016, the year Toyota folded the Scion brand. As the Toyota 86 the car sold 6,846 in 2017 and kept sliding, to 4,133 in 2018, 3,398 in 2019, 2,476 in 2020 and 1,153 in 2021 as the first generation ran out, with fewer than ten sales a month from July to October 2021. The GR86 arrived at the end of 2021 and lifted 2022 to 11,996, the best year since 2014, then held between about 11,000 and 11,500 in 2023 and 2024, with May 2024 the strongest month of the GR86 era at 1,981. 2025 fell 13.0 percent to 9,940, and 2026 is running lower again: January to September totalled 5,642, 30.4 percent behind the 8,107 sold over the same months of 2025.
Toyota GR86, United States calendar-year unit sales, 2012–2026. 2026 is January–Sep (partial).
Annual sales
| Year | Units | YoY |
|---|---|---|
| 2012 | 11,417 | — |
| 2013 | 18,327 | ▲ 60.5% |
| 2014 | 14,062 | ▼ 23.3% |
| 2015 | 10,507 | ▼ 25.3% |
| 2016 | 7,457 | ▼ 29.0% |
| 2017 | 6,846 | ▼ 8.2% |
| 2018 | 4,133 | ▼ 39.6% |
| 2019 | 3,398 | ▼ 17.8% |
| 2020 | 2,476 | ▼ 27.1% |
| 2021 | 1,153 | ▼ 53.4% |
| 2022 | 11,996 | ▲ 940.4% |
| 2023 | 11,078 | ▼ 7.7% |
| 2024 | 11,426 | ▲ 3.1% |
| 2025 | 9,940 | ▼ 13.0% |
| 2026 (Jan–Sep) | 5,642 | ▼ 30.4% YTD |
Monthly sales
| Year | Jan | Feb | Mar | Apr | May | Jun | Jul | Aug | Sep | Oct | Nov | Dec | Total |
|---|---|---|---|---|---|---|---|---|---|---|---|---|---|
| 2012 | — | — | — | — | 86 | 2,684 | 1,649 | 1,913 | 1,133 | 1,107 | 1,350 | 1,495 | 11,417 |
| 2013 | 1,443 | 1,369 | 1,828 | 1,629 | 1,937 | 1,815 | 1,614 | 1,902 | 1,230 | 1,233 | 1,298 | 1,029 | 18,327 |
| 2014 | 921 | 1,040 | 1,464 | 1,445 | 1,664 | 1,128 | 1,171 | 1,429 | 920 | 1,111 | 935 | 834 | 14,062 |
| 2015 | 746 | 806 | 893 | 1,026 | 1,274 | 1,003 | 1,058 | 960 | 778 | 770 | 605 | 588 | 10,507 |
| 2016 | 507 | 554 | 669 | 684 | 681 | 688 | 682 | 638 | 651 | 633 | 513 | 557 | 7,457 |
| 2017 | 474 | 603 | 705 | 639 | 680 | 635 | 655 | 586 | 530 | 458 | 456 | 425 | 6,846 |
| 2018 | 317 | 361 | 491 | 337 | 401 | 368 | 300 | 310 | 325 | 335 | 293 | 295 | 4,133 |
| 2019 | 256 | 231 | 320 | 268 | 327 | 259 | 300 | 345 | 211 | 298 | 307 | 276 | 3,398 |
| 2020 | 222 | 280 | 202 | 116 | 258 | 271 | 231 | 236 | 152 | 172 | 131 | 205 | 2,476 |
| 2021 | 209 | 222 | 333 | 172 | 71 | 27 | 7 | 1 | 2 | — | 2 | 107 | 1,153 |
| 2022 | 1,331 | 925 | 1,001 | 689 | 925 | 1,306 | 1,432 | 1,217 | 865 | 660 | 785 | 860 | 11,996 |
| 2023 | 441 | 592 | 1,005 | 1,078 | 969 | 1,178 | 1,371 | 1,143 | 960 | 794 | 757 | 790 | 11,078 |
| 2024 | 474 | 203 | 1,364 | 1,945 | 1,981 | 1,500 | 1,001 | 677 | 498 | 698 | 506 | 579 | 11,426 |
| 2025 | 788 | 843 | 1,146 | 990 | 851 | 809 | 1,041 | 987 | 652 | 676 | 581 | 576 | 9,940 |
| 2026 | 711 | 730 | 605 | 496 | 711 | 754 | 663 | 512 | 460 | — | — | — | 5,642 |
Toyota GR86 Sales in Canada
In Canada the chart begins in April 2012, and the FR-S closed that partial year at 1,470, with July 2012 the best month on the chart at 323. 2013 was the best full year at 1,825, and sales eased to 1,559 in 2014 and 1,329 in 2015. The chart records zero for January to June 2016, so that year’s 152 covers only July to December and understates it. As the Toyota 86 the car sold 907 in 2017, then 550, 262 and 237 through 2020, and 76 in 2021 as the first generation ended. The GR86 brought volume back to 713 in 2022, and after 414 in 2023 it reached 801 in 2024, the highest since 2017. 2025 fell 27.8 percent to 578, but 2026 has edged ahead: January to September reached 556, 6.7 percent above the 521 sold in the same months of 2025.
Toyota GR86, Canada calendar-year unit sales, 2012–2026. 2026 is January–Sep (partial).
Annual sales
| Year | Units | YoY |
|---|---|---|
| 2012 | 1,470 | — |
| 2013 | 1,825 | ▲ 24.1% |
| 2014 | 1,559 | ▼ 14.6% |
| 2015 | 1,329 | ▼ 14.8% |
| 2016 | 152 | ▼ 88.6% |
| 2017 | 907 | ▲ 496.7% |
| 2018 | 550 | ▼ 39.4% |
| 2019 | 262 | ▼ 52.4% |
| 2020 | 237 | ▼ 9.5% |
| 2021 | 76 | ▼ 67.9% |
| 2022 | 713 | ▲ 838.2% |
| 2023 | 414 | ▼ 41.9% |
| 2024 | 801 | ▲ 93.5% |
| 2025 | 578 | ▼ 27.8% |
| 2026 (Jan–Sep) | 556 | ▲ 6.7% YTD |
Monthly sales
| Year | Jan | Feb | Mar | Apr | May | Jun | Jul | Aug | Sep | Oct | Nov | Dec | Total |
|---|---|---|---|---|---|---|---|---|---|---|---|---|---|
| 2012 | 0 | 0 | 0 | 134 | 140 | 136 | 323 | 202 | 117 | 125 | 116 | 177 | 1,470 |
| 2013 | 123 | 81 | 161 | 253 | 245 | 216 | 202 | 173 | 103 | 130 | 86 | 52 | 1,825 |
| 2014 | 57 | 50 | 105 | 223 | 194 | 210 | 166 | 180 | 149 | 121 | 63 | 41 | 1,559 |
| 2015 | 52 | 52 | 121 | 124 | 185 | 162 | 164 | 143 | 118 | 88 | 69 | 51 | 1,329 |
| 2016 | 0 | 0 | 0 | 0 | 0 | 0 | 11 | 12 | 13 | 40 | 50 | 26 | 152 |
| 2017 | 24 | 29 | 58 | 84 | 110 | 132 | 106 | 115 | 78 | 65 | 63 | 43 | 907 |
| 2018 | 33 | 37 | 58 | 69 | 81 | 74 | 97 | 17 | 28 | 23 | 18 | 15 | 550 |
| 2019 | 19 | 17 | 20 | 27 | 27 | 26 | 29 | 29 | 28 | 14 | 12 | 14 | 262 |
| 2020 | 13 | 11 | 14 | 25 | 23 | 26 | 33 | 32 | 33 | 9 | 8 | 10 | 237 |
| 2021 | 10 | 10 | 13 | 11 | 10 | 13 | 1 | 1 | 0 | 2 | 2 | 3 | 76 |
| 2022 | 85 | 81 | 95 | 90 | 90 | 96 | 43 | 49 | 47 | 12 | 12 | 13 | 713 |
| 2023 | 25 | 23 | 28 | 47 | 52 | 53 | 45 | 52 | 47 | 14 | 14 | 14 | 414 |
| 2024 | 30 | 29 | 30 | 136 | 136 | 126 | 60 | 60 | 57 | 49 | 42 | 46 | 801 |
| 2025 | 55 | 50 | 55 | 70 | 67 | 69 | 53 | 50 | 52 | 20 | 16 | 21 | 578 |
| 2026 | 38 | 26 | 60 | 77 | 81 | 85 | 101 | 50 | 38 | — | — | — | 556 |