April 18, 2026
The M&A story that defined US dealer consolidation from 2019 through 2024 ran on a specific premise: the largest public and private dealer groups could grow faster by buying rooftops than by running existing ones better. Lithia’s 2022-2023 acquisition cadence, Group 1’s Inchcape integration, and Asbury’s Koons deal were each built on that bet. The 2026 Automotive News Top 150 list is the first reporting cycle in which the premise is demonstrably no longer the dominant growth vector.
Automotive News’ Daily 5 coverage of the 2026 list and the accompanying new consolidation analysis confirm the key numbers. The Top 10 sold 1.8 million new vehicles in 2025, equivalent to 11.1% of combined retail plus fleet volume, up 0.3 points from the prior year. More importantly, 101 of the 150 groups grew year over year, and of those 101, 62 grew without expanding their store counts. That ratio, roughly 60-40 organic versus inorganic, is a full reversal of the 2020 to 2023 pattern.
Why the organic-growth majority matters
The first-order implication is straightforward. The largest groups have become operationally more efficient faster than they have been able to identify and close accretive acquisitions. Hudson’s 12-store All Star acquisition in late 2025 is a good example of the exception that proves the rule. Asbury added the most locations in 2025, but the top-line ranking across the full 150 was determined more by same-store new-vehicle volume and F&I penetration than by store counts.
The second-order implication is more important for the buy-sell market. When the majority of top-150 growth is organic rather than acquired, the willingness to bid at 2022 multiples on private-group acquisitions drops. The bid-ask gap that Automotive News flagged in early 2026 is narrowing not because sellers are lowering asking prices materially, but because the buyers are getting comfortable with slower store-count growth inside their existing portfolios. The Banner 2026 dealership M&A outlook GCBC published in February is playing out in a specific way: volumes are rising, but the public acquirers are writing smaller checks per rooftop.
The operational levers behind the organic growth
The per-store performance data across the Top 150 show where the incremental margin is actually coming from. Three levers stand out in the 2025 reporting cycle.
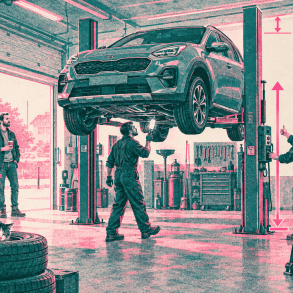
First, fixed operations. Service and parts gross per store rose across more than half of the groups that grew organically, driven by higher effective labor rates and increased warranty volume from the record 2025 recall activity. The Cox 2026 Fixed Operations Study published earlier this month shows the flip side: dealer service share of total service visits fell to 29%, meaning dealers are earning more revenue on fewer visits. The organic-growth group in the Top 150 has captured disproportionate benefit from that asymmetry.
Second, F&I penetration and per-deal gross. Several of the groups growing organically have pushed F&I income per retail unit above $1,800 in 2025, against an industry average in the $1,500 to $1,650 band. Warranty, service contract, and GAP product attach rates are the main drivers. The subprime delinquency pressure at 6.9% on the New York Fed household debt print is cutting against some of this, but the organic-growth majority has adjusted its underwriting mix before lender behavior tightened.
Third, digital retail integration. The PureCars/AutoAlert acquisition announced on April 13 is the dealer-tech M&A version of the same story. The largest groups are integrating AI-layer data and CRM platforms faster than the independent single-point operators can match, which converts to higher conversion per lead at the store level. That is an operational moat that does not depend on acquiring more rooftops.
What slower M&A means for the buy-sell market
For sellers in the 2-to-5-store independent bracket, the 2026 bid-ask environment is firmer than the 2023 environment. Public acquirers are less willing to pay premium multiples, but private capital (family office, multi-store regionals, sector-specific PE) is still active at realistic valuations. The per-store performance ranking inside the Top 150 matters more than ever because acquirers are underwriting the operational upgrade post-close rather than assuming the seller’s current gross holds.
For buyers, the math has shifted toward smaller tuck-in deals at operationally improved multiples. The 12-store Hudson deal on All Star is the 2025 example. Similar deals in the 5 to 20 store range are the 2026 pattern. The $1 billion-plus enterprise-value deals that defined 2022 are not returning, and the public acquirers have largely acknowledged that in their investor communications.
Where the franchise brands sit inside the pattern
The per-store performance data also reveals a brand-mix effect inside the Top 150. Groups with heavier Toyota, Honda, Hyundai, and Kia allocation outperformed groups with heavier Stellantis, Ford, and GM allocation on new-vehicle growth in 2025, but the gap narrowed in Q1 2026 as Stellantis North America shipments grew 17% and GM’s March softened against an easier comp. The Q1 2026 read is that the volume brands with Japanese and Korean allocation are still the preferred mix, but the Detroit Three rotation is re-opening for groups that can execute inventory turns.
What it means
The 2026 Top 150 list is the cleanest data point yet that US dealer consolidation has moved past the 2019-2024 M&A cycle. The growth that is happening is coming from execution inside existing rooftops, and the acquirers that dominated the prior cycle are building the operational layer rather than the M&A layer to deliver incremental gain. For GCBC readers in the dealer channel, the actionable implication is that the 2026 playbook runs through fixed operations, F&I mix, and digital-retail integration. For readers tracking the M&A outlook, the implication is that the buy-sell market is healthier than the 2024 trough but structurally different from the 2021-2022 peak. The bid-ask is narrowing because buyers have figured out they can grow without adding rooftops. That is a quieter consolidation story than the one the industry has been telling itself, and it is the one the Top 150 data confirms.