
Lincoln Sales Data, Trends, Analysis & Current Lineup for the U.S Automotive Market
This is your hub for all of the Lincoln sales data for the U.S market. If you live outside of North America, chances are you’re not familiar with the Lincoln brand. For those who don’t know, Lincoln is the luxury brand of Ford.
Lincoln is the only surviving luxury brand in the Ford stable, after the Blue Oval sold off Volvo, Jaguar, Land Rover and Aston Martin and killed Mercury. You’d think they’d put in the extra effort to make the brand successful, but it’s taken a while for Lincoln to really bloom. It always takes a while to restore a lackluster brand image, and from that perspective it made sense to ditch the unsuccessful so-called waterfall grille and the incomprehensible naming strategy in favor of a more attractive styling and a return to traditional names. With the new Navigator and Aviator SUVs getting lots of praise from the press for their styling and content, Lincoln is ready for a long-awaited revival.
Lincoln has been competing against the luxury brand of General Motors, the Cadillac, in the US throughout its entire existence. Lincoln, however, has the distinction of starting the personal luxury car segment, when they introduced the Lincoln Continental in 1940.
The current product range of Lincoln consists of sedans, crossovers, and SUVs. Outside of retail markets, Lincoln has produced vehicles for limousine and livery use throughout its entire existence, with several examples used as official state limousines for Presidents of the United States. All of Lincoln’s models for the US market are manufactured in North America. Outside of its home market he brand is not sold in large volumes except for China, where it has started local production in 2020.
Lincoln U.S Sales Figures & Recent Highlights
At a time, Ford has a number of luxury brands which includes Lincoln, Volvo, Jaguar, Land Rover, Aston Martin, and Mercury. Today, Lincoln is the only surviving luxury brand of Ford. Sales of Lincoln in the US is currently floundering when compared to its glory years. The brand has enjoyed success from mid 1980s to late 1990s, but things have not been the same for Lincoln. You may think that they will put in the extra effort to make the brand successful again since this is their only luxury brand left, but it may take while for Lincoln to really bloom based on the table below.
According to Motor Intelligence, Lincoln sales in the US have been on a downward trend in recent years. In 2021, Lincoln sales fell by 15.4% to 88,313 vehicles. This was the fifth consecutive year of sales declines for Lincoln. There are a few reasons for Lincoln’s declining sales. One reason is that the brand has not been able to keep up with the latest trends in luxury vehicles. Lincoln’s vehicles are often seen as being outdated and less luxurious than their rivals. Another reason for Lincoln’s declining sales is that the brand has not been able to attract younger buyers. Lincoln’s average buyer age is 61 years old, which is much older than the average buyer age for other luxury brands.
However, there have been some recent developments that could help Lincoln reverse its sales decline. In 2022, Lincoln introduced the new Corsair PHEV, which is the brand’s first plug-in hybrid vehicle. The Corsair PHEV is expected to help Lincoln attract younger buyers and appeal to those who are looking for a more environmentally friendly vehicle. Lincoln is also investing in new technologies, such as self-driving cars. The brand is working with Argo AI, a self-driving car company, to develop self-driving Lincoln vehicles. These vehicles are expected to be available in the future.
Lincoln Monthly Sales Data in the U.S
Below we have a table that shows Lincoln sales for the United States automotive market, but this time it is broken out by month. This is on a unit basis. This is Lincoln new vehicle sales in the US.
Lincoln Annual Sales, Growth & Market Share in the United States
Below we have a table that shows total Lincoln sales volumes for the US automotive market, broken out by year. This data captures all Lincoln vehicle sales for the entire United States automotive market.
| Year | Sales | YOY Change | US Marketshare | Marketshare Change |
|---|---|---|---|---|
| 2005 | 123,207 | 0.00 | 0.72 | 0.00 |
| 2006 | 120,476 | -2.22 | 0.72 | 0.42 |
| 2007 | 131,487 | 9.14 | 0.81 | 10.82 |
| 2008 | 107,295 | -18.40 | 0.80 | -0.71 |
| 2009 | 82,847 | -22.79 | 0.79 | -2.07 |
| 2010 | 86,828 | 4.81 | 0.74 | -6.42 |
| 2011 | 85,643 | -1.36 | 0.66 | -11.77 |
| 2012 | 89,062 | 3.99 | 0.57 | -16.19 |
| 2013 | 81,694 | -8.27 | 0.52 | -9.42 |
| 2014 | 94,474 | 15.64 | 0.57 | 8.76 |
| 2015 | 101,227 | 7.15 | 0.58 | 1.23 |
| 2016 | 112,470 | 11.11 | 0.64 | 9.51 |
| 2017 | 111,159 | -1.17 | 0.64 | 0.64 |
| 2018 | 103,587 | -6.81 | 0.60 | -7.92 |
| 2019 | 112,107 | 8.22 | 0.66 | 9.33 |
| 2020 | 105,405 | -5.98 | 0.72 | 8.25 |
| 2021 | 87,929 | -16.58 | 0.59 | -21.86 |
| 2022 | 83,486 | -5.05 | 0.61 | 3.59 |
| 2023 | 81,444 | -2.45 | 0.52 | -16.35 |
| 2024 | 24,894 | 0.00 | 0.66 | 0.00 |
Lincoln U.S Annual Sales Units & Growth Chart
Below is a visual representation of Lincoln’s U.S sales units over time. We have both the Lincoln sales units and the growth in the United States market. Click on the items in the legend to see each series by itself.
Lincoln U.S Growth Rate & Market Share Chart
Below is the annual growth rate for the Lincoln brand in the United States, shown against the Lincoln’s marketshare changes in the United States. This gives you a good look into how Lincoln has faired against the other brands in terms of absolute sales and effect on marketshare. Click on the items in the legend to see each series by itself.
The Best-Selling Lincoln Cars & SUVs in the United States
Known for its premium sedans, SUVs, and crossovers, Lincoln has a rich history but has also faced challenges in the competitive luxury vehicle market. Much like the broader U.S. automotive market, Lincoln has seen a shift in consumer preference from sedans to SUVs and crossovers. This trend has led to increased sales of models like the Lincoln Navigator, Aviator, Corsair, and Nautilus. With the increased focus on SUVs and crossovers, Lincoln decided to phase out its sedan lineup. This meant discontinuing models like the Continental and MKZ, which historically had been important for the brand. The Lincoln Navigator, after its major redesign, has been a standout performer for the brand. The full-size luxury SUV has received critical acclaim and has seen strong sales, competing directly with other luxury SUVs in its segment.
- Lincoln Corsair (27,668 sold in 2022).The Corsair, which replaced the Lincoln MKC, is a compact luxury crossover. This model has been well-received, especially given the strong demand for compact crossovers in the U.S. market.
- Lincoln Aviator (21,977 sold in 2022).Introduced as a midsize luxury SUV, the Aviator found a good footing in the market. It’s positioned between the larger Navigator and smaller Nautilus in Lincoln’s lineup.
- Lincoln Nautilus (20,635 sold in 2022).Formerly known as the MKX, the Nautilus is another midsize luxury crossover in Lincoln’s lineup. While overshadowed a bit by the newer Aviator, the Nautilus still contributed significantly to Lincoln’s sales.
- Lincoln Navigator (13,206 sold in 2022).The Navigator, a full-size luxury SUV, has historically been a strong seller for Lincoln, especially after its significant redesign. This model competes with other full-size luxury SUVs and has received acclaim for its design, luxury features, and performance.
The Current Lincoln Model Lineup & Prices in the U.S
Lincoln has been revamping its model lineup, moving away from the “MK” naming convention (e.g., MKZ, MKC) and opting for more distinct names. The Lincoln Corsair replaced the MKC, while the MKX was rebranded as the Nautilus. The Lincoln Navigator underwent a significant redesign, transforming it into a more competitive product in the luxury SUV segment. This redesign has been well-received both critically and commercially. Lincoln, in line with Ford’s broader strategy, has announced intentions to move towards electrification. This includes plans to electrify its entire lineup by 2030.
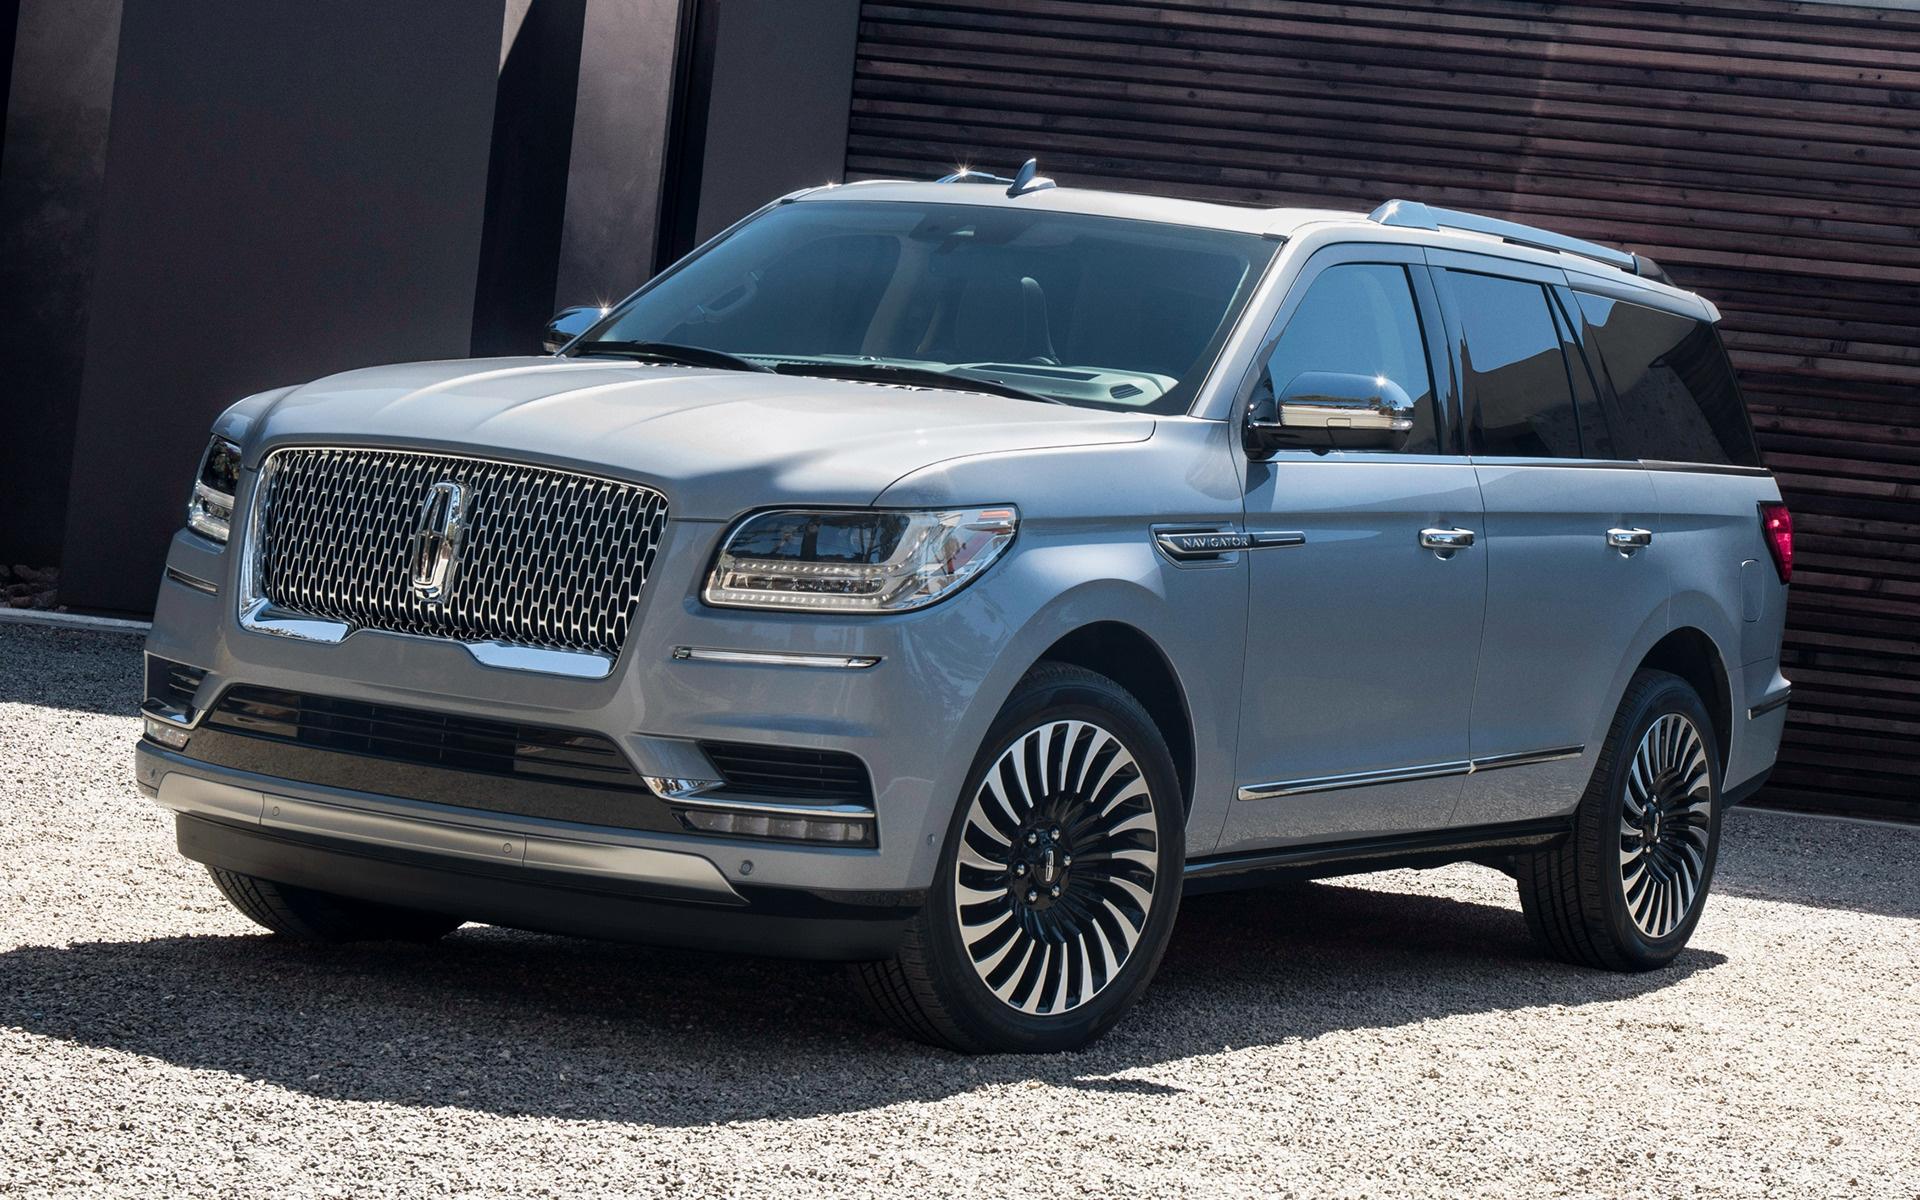
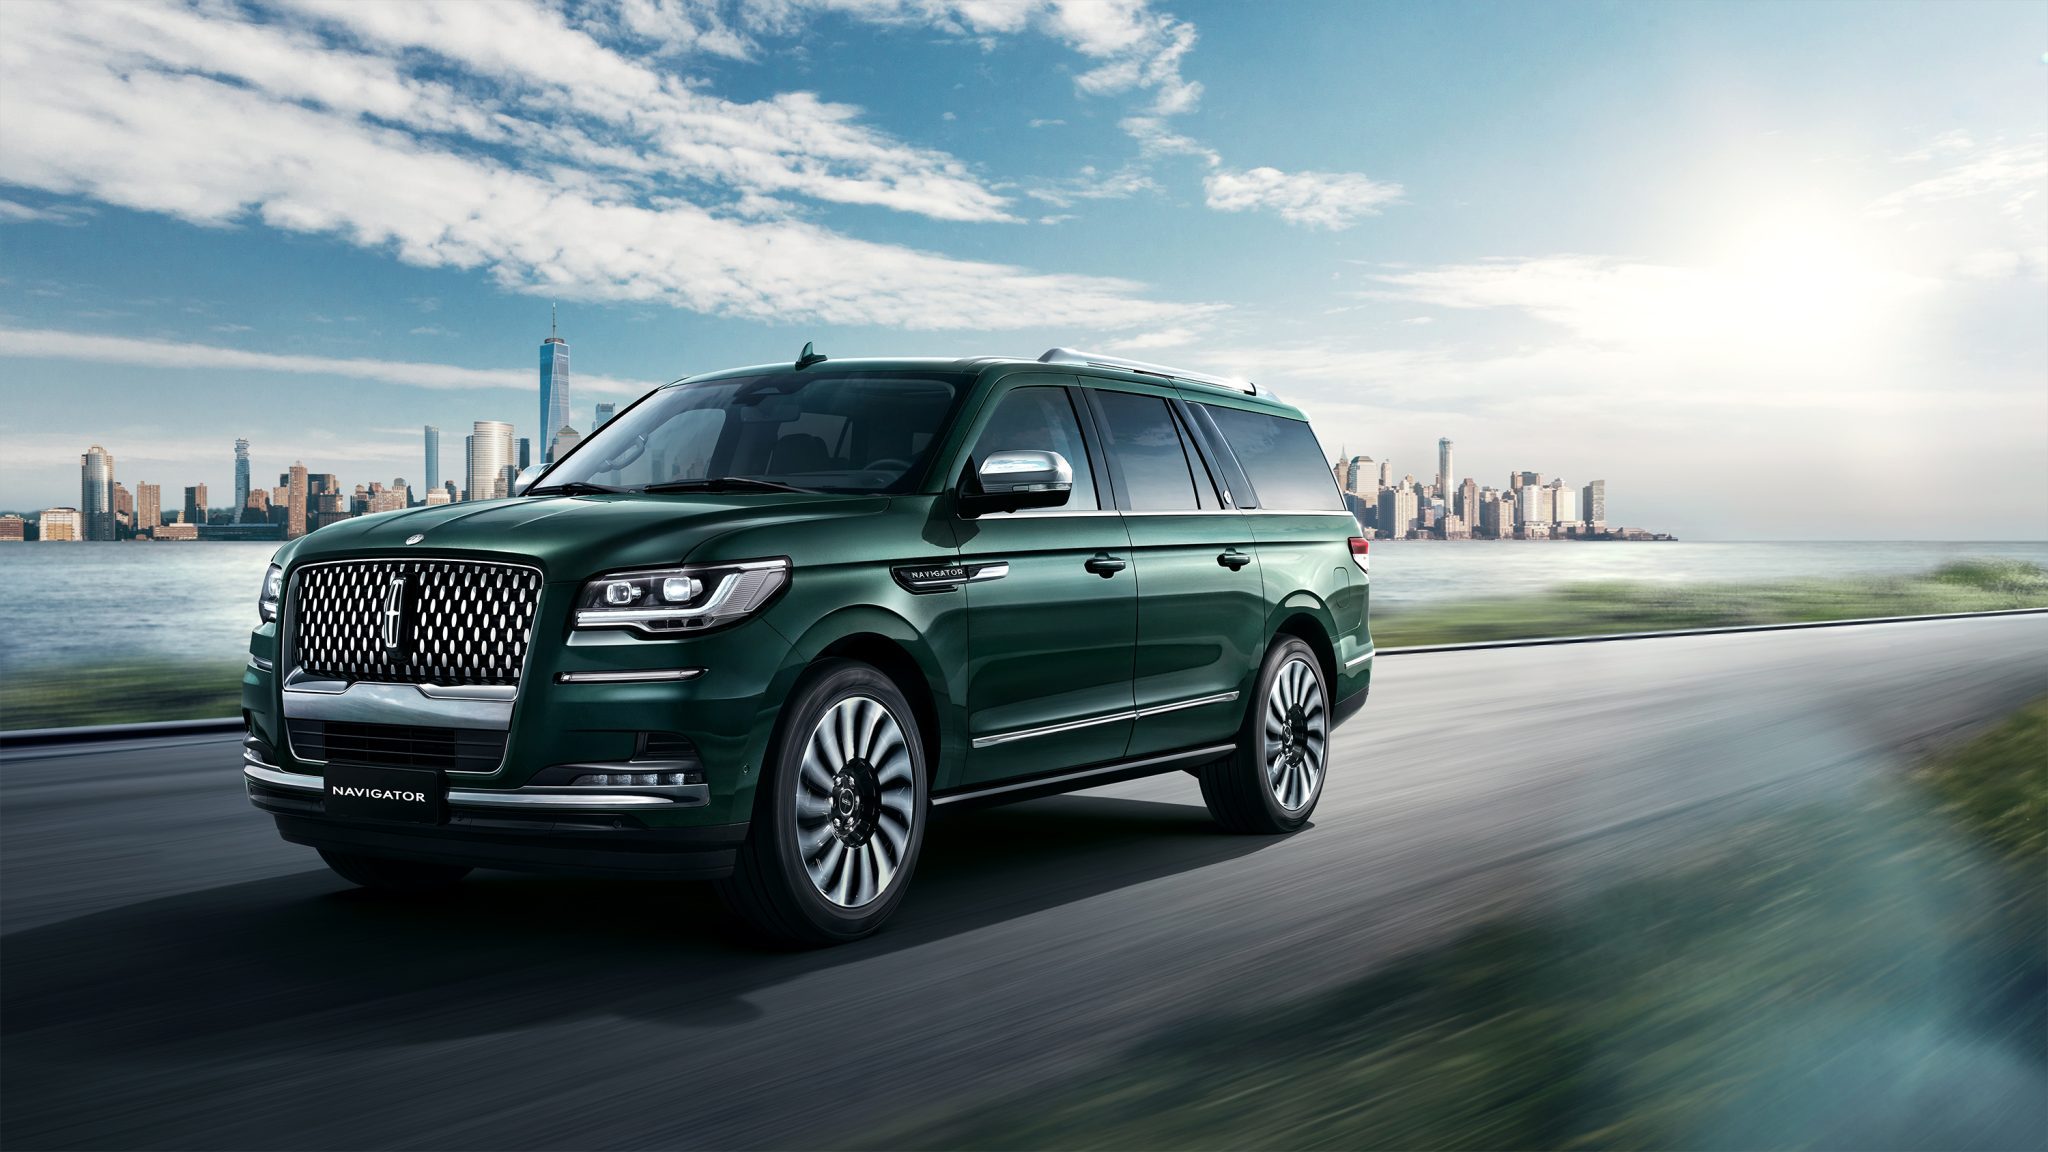
Lincoln Navigator
Starting at $82,765
The 2023 Lincoln Navigator is a full-size luxury SUV that is available in three trims: Standard, Reserve, and Black Label. The Navigator is powered by a 3.5-liter twin-turbocharged V6 engine that produces 440 horsepower and 510 lb-ft of torque. It is mated to a 10-speed automatic transmission. The Navigator gets an EPA-estimated 17 mpg in the city and 22 mpg on the highway. All Navigators come standard with features like a 13.2-inch touchscreen infotainment system, a 19-speaker Revel Ultima sound system, and a panoramic sunroof. They also come standard with features like forward collision warning, automatic emergency braking, lane departure warning, and lane keeping assist. The Navigator is a good choice for those who are looking for a luxurious and spacious SUV. It is also a good choice for those who are looking for an SUV with good performance.
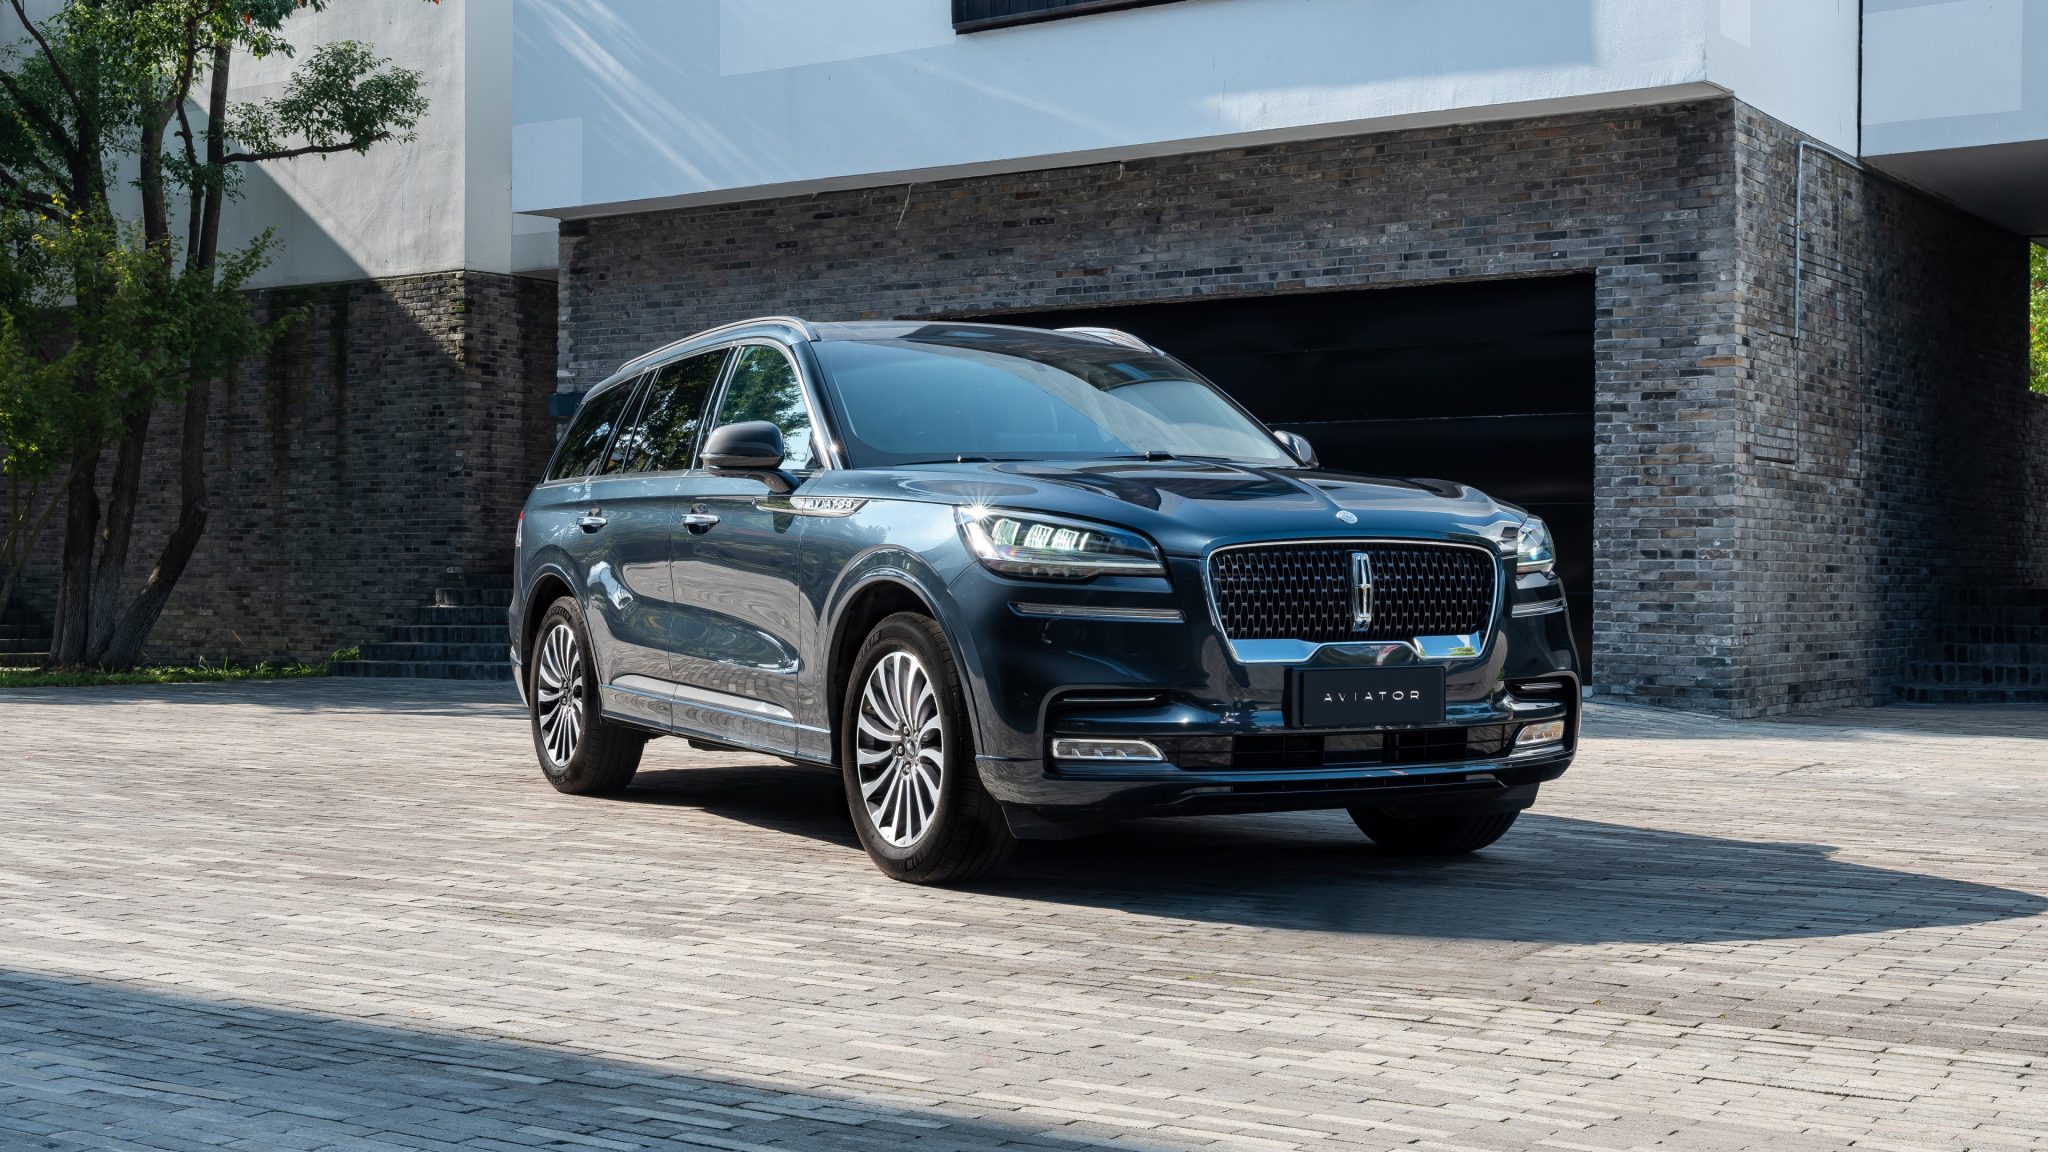
Lincoln Aviator
Starting at $53,340
The 2023 Lincoln Aviator is a mid-size luxury SUV that is available in four trims: Standard, Reserve, Grand Touring, and Black Label. The Aviator is powered by a 3.0-liter twin-turbocharged V6 engine that produces 400 horsepower and 415 lb-ft of torque. It is mated to a 10-speed automatic transmission. The Aviator gets an EPA-estimated 18 mpg in the city and 26 mpg on the highway.
All Aviators come standard with features like a 13.2-inch touchscreen infotainment system, a 12.3-inch digital instrument cluster, and a 10-speaker Revel sound system. They also come standard with features like forward collision warning, automatic emergency braking, lane departure warning, and lane keeping assist. The Aviator is a good choice for those who are looking for a luxurious and comfortable SUV. It is also a good choice for those who are looking for an SUV with good performance.
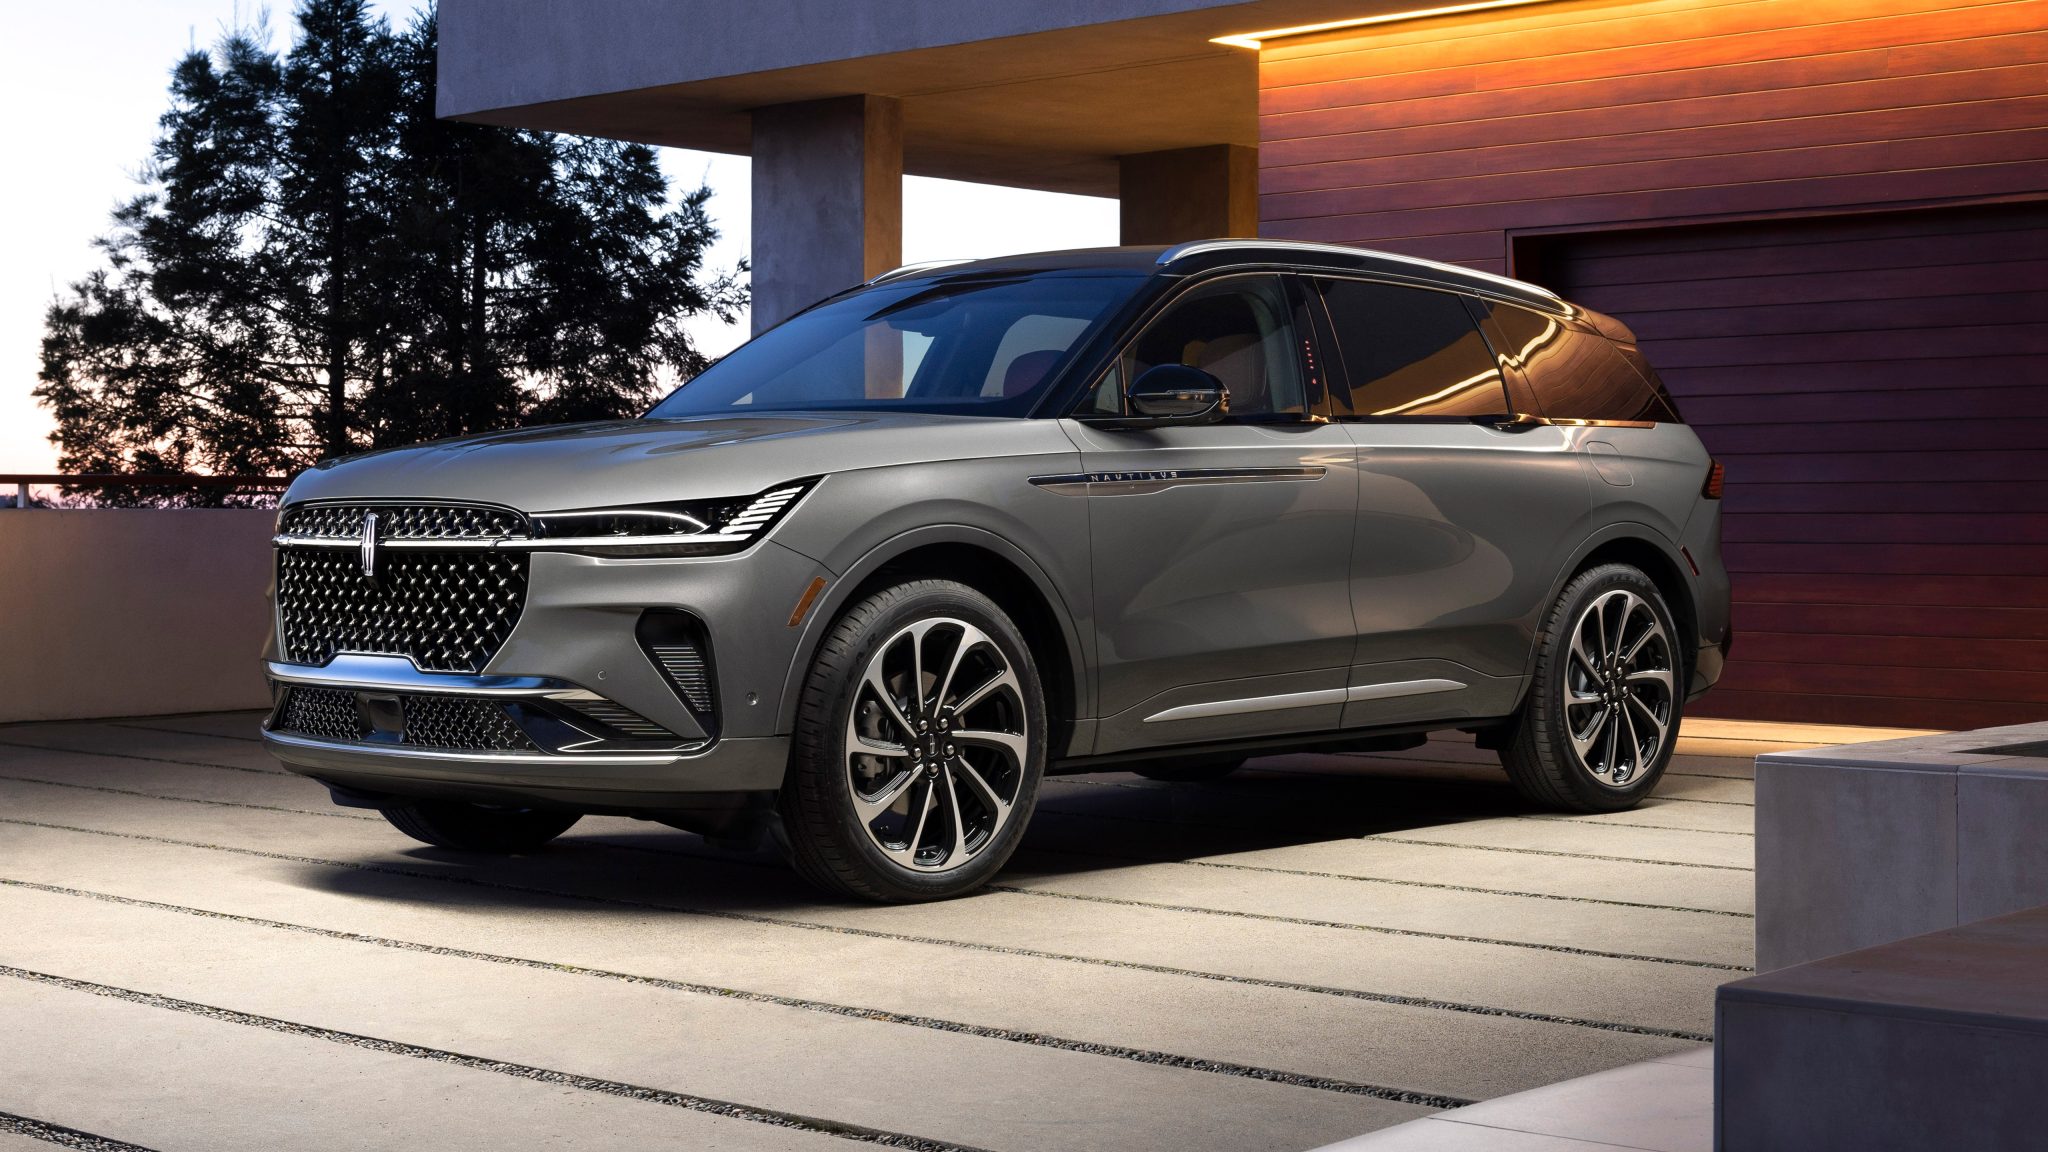
Lincoln Nautilus
Starting at $50,415
The 2024 Lincoln Nautilus is a mid-size luxury crossover SUV that is available in three trims: Standard, Reserve, and Black Label. The Nautilus is powered by a 2.0-liter turbocharged four-cylinder engine that produces 250 horsepower and 275 lb-ft of torque. It is mated to an eight-speed automatic transmission. The Nautilus gets an EPA-estimated 21 mpg in the city and 29 mpg on the highway.
A 2.7-liter turbocharged V6 engine that produces 335 horsepower and 380 lb-ft of torque is available as an option. It is mated to a 10-speed automatic transmission. The Nautilus with the V6 engine gets an EPA-estimated 19 mpg in the city and 26 mpg on the highway.
All Nautiluses come standard with features like a 13.2-inch touchscreen infotainment system, a 12.3-inch digital instrument cluster, and a 10-speaker Revel sound system. They also come standard with features like forward collision warning, automatic emergency braking, lane departure warning, and lane keeping assist.
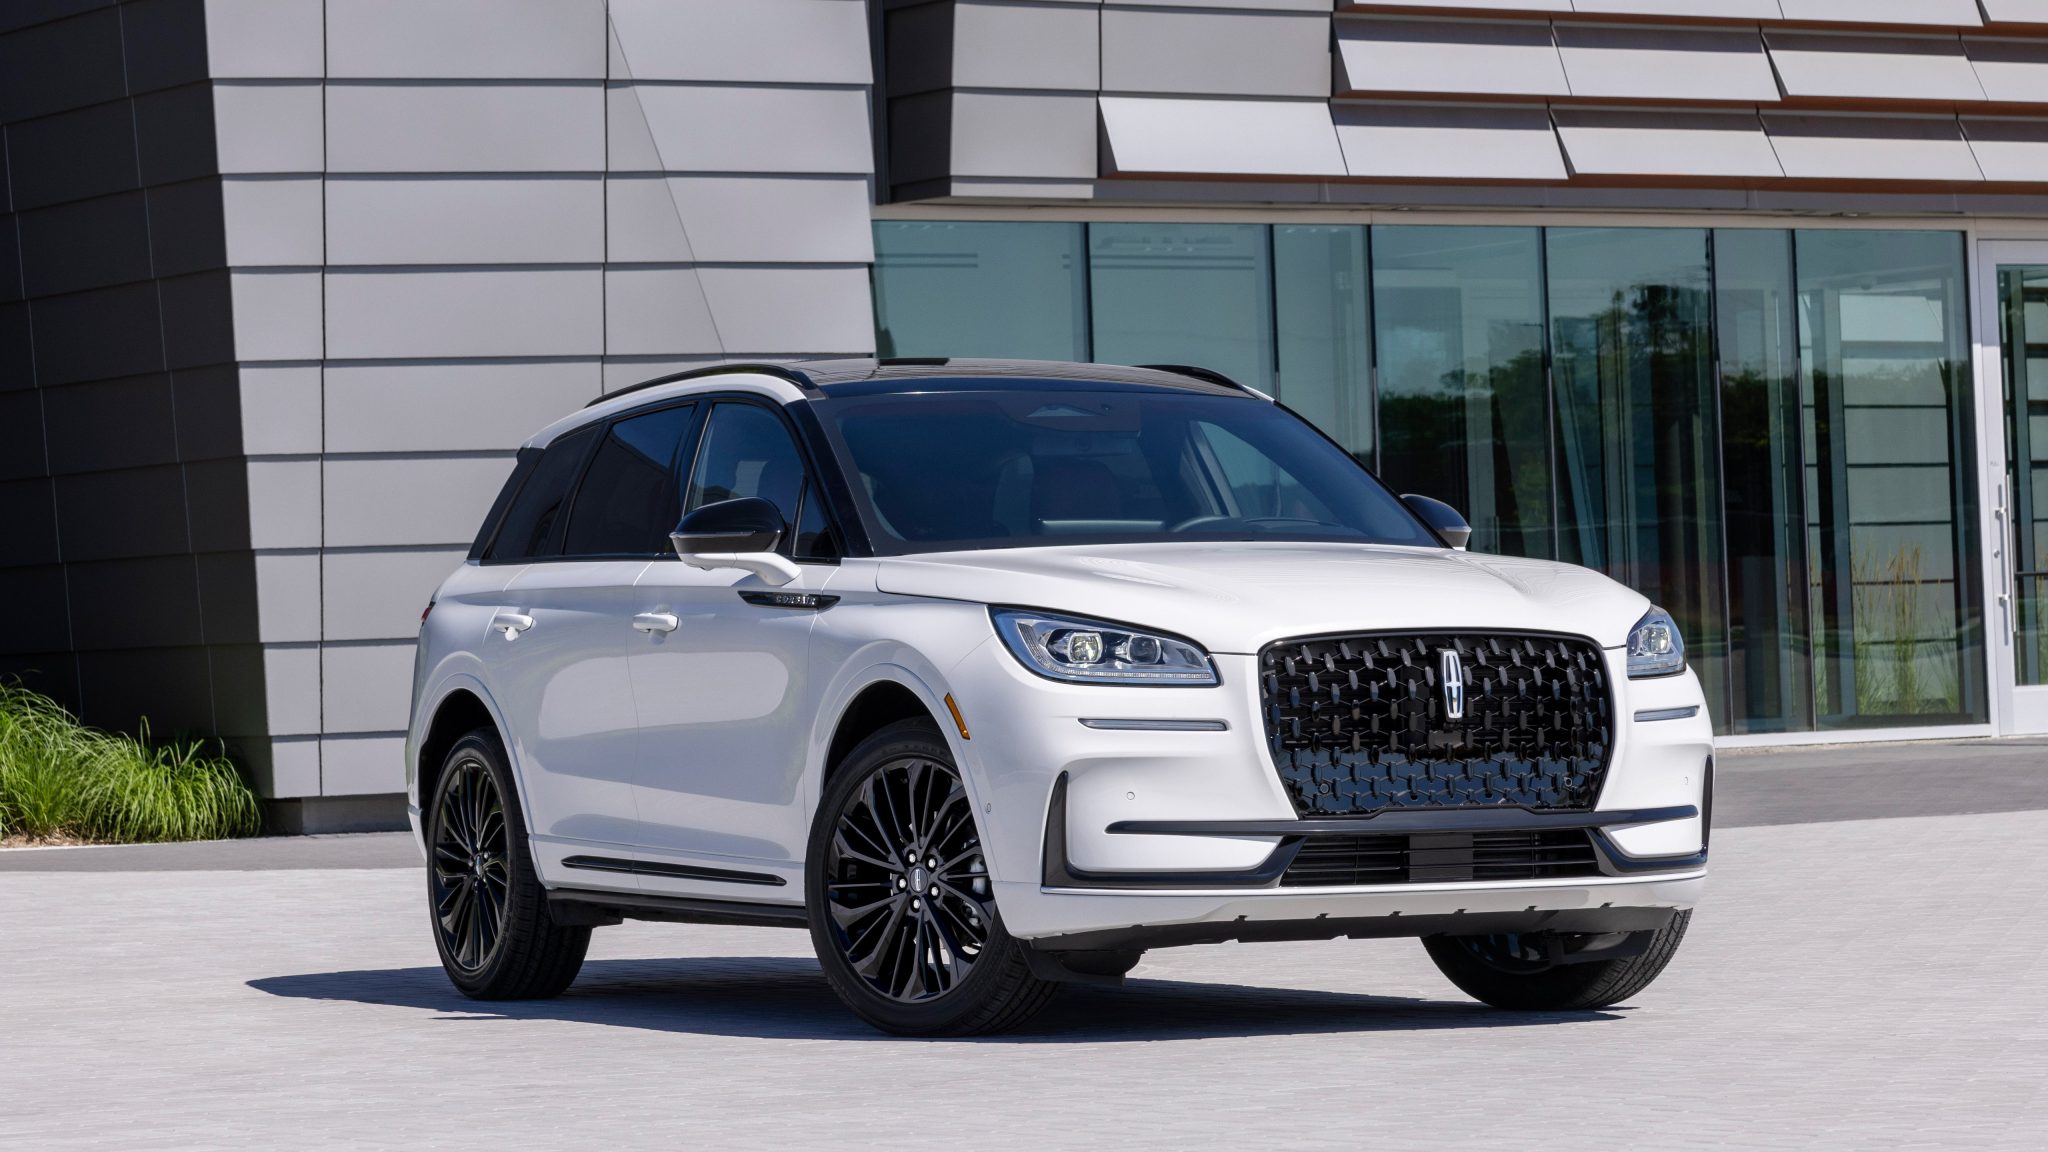
Lincoln Corsair
Starting at $38,730
The 2023 Lincoln Corsair is a compact luxury crossover SUV that is available in four trims: Standard, Reserve, Grand Touring, and Black Label. The Corsair is powered by a 2.0-liter turbocharged four-cylinder engine that produces 250 horsepower and 275 lb-ft of torque. It is mated to an eight-speed automatic transmission. The Corsair gets an EPA-estimated 22 mpg in the city and 29 mpg on the highway.
A 2.5-liter plug-in hybrid powertrain that produces 266 horsepower and 463 lb-ft of torque is available as an option. It is mated to an eight-speed automatic transmission. The Corsair PHEV gets an EPA-estimated 37 mpg in the city and 37 mpg on the highway.
All Corsairs come standard with features like a 10.1-inch touchscreen infotainment system, a 12.3-inch digital instrument cluster, and a 10-speaker Revel sound system. They also come standard with features like forward collision warning, automatic emergency braking, lane departure warning, and lane keeping assist.
Sources: Manufacturers, ANDC, JATO Dynamics.

The future Lincoln in their TV ads looks like a real winner. Your thoughts?