
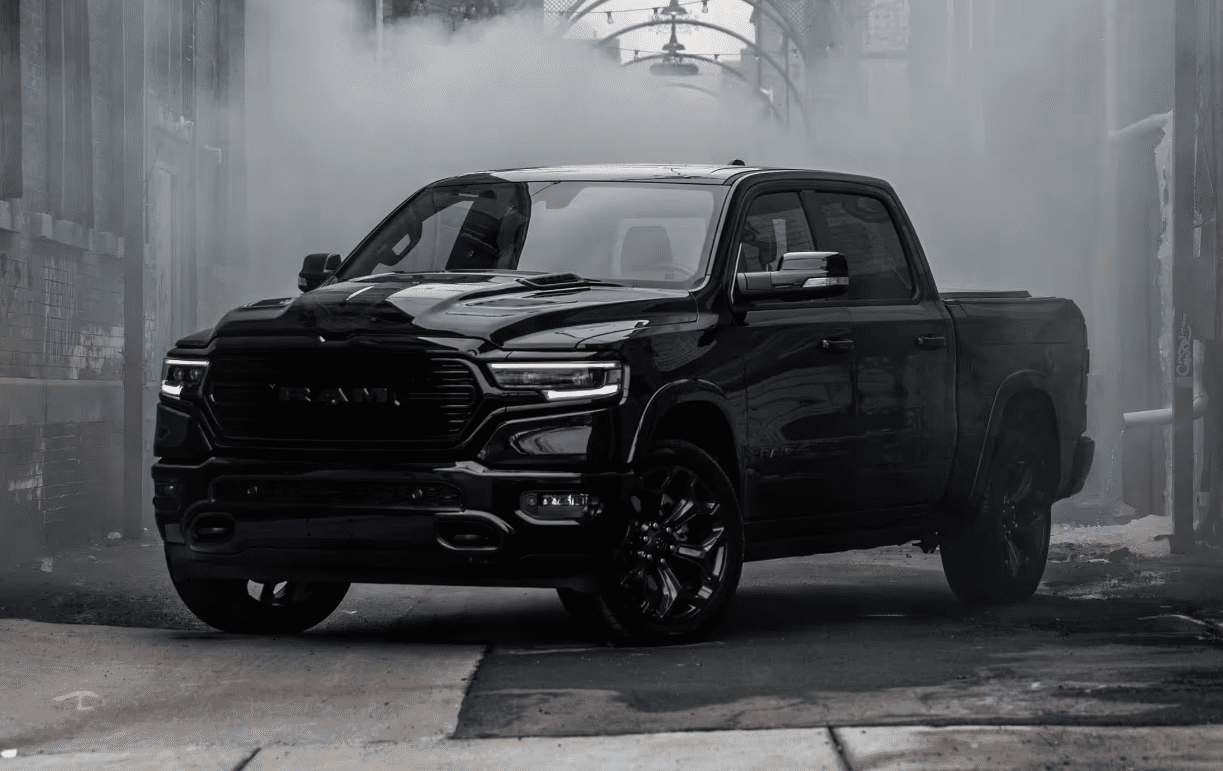
Dodge Ram/Ram Pickup
Ram Pickup is the nameplate GoodCarBadCar uses for the full-size Ram light-duty truck line, sold for years as the Dodge Ram before Ram became its own brand in 2009. The current 2026 Ram 1500 competes with the Ford F-150 and Chevrolet Silverado in the half-ton segment and is built at Sterling Heights Assembly in Michigan and Saltillo Truck Assembly in Mexico. The headline change for 2026 is the return of the 5.7-liter HEMI V8, brought back after being dropped for the 2025 model year. This page keeps the full Ram and Dodge Ram record and tracks the two markets Ram reports, the United States and Canada, leading with the United States.
The 2026 Ram 1500 lineup runs from the work-oriented Tradesman up through Big Horn, Laramie, Rebel, the high-performance RHO, and the luxury Limited, Longhorn, and Tungsten grades, in Quad Cab and Crew Cab body styles. Power comes from a V6, the returning HEMI V8, or Ram’s Hurricane twin-turbo inline-six.
| 2026 Ram 1500 engine | Horsepower | Torque |
|---|---|---|
| 3.6L Pentastar V6 eTorque | 305 hp | 269 lb-ft |
| 5.7L HEMI V8 eTorque (returning for 2026) | 395 hp | 410 lb-ft |
| 3.0L Hurricane twin-turbo I-6, standard output | 420 hp | 469 lb-ft |
| 3.0L Hurricane twin-turbo I-6, high output | 540 hp | 521 lb-ft |
Figures reflect the 2026 Ram 1500 as published by Ram. All engines pair with an eight-speed automatic. Ram’s electrified trucks, the battery-electric 1500 REV and the range-extended model, are launching separately and are not included in the totals on this page.
Ram Pickup Sales in the United States
In the United States, the Ram pickup line climbed to a high of 633,694 units in 2019, when it briefly challenged for the second spot among full-size trucks, before pulling back over the following years. Ram delivered 373,118 units in 2024 and 371,213 in 2025, essentially flat year over year. The 2026 picture is stronger: through June 2026, the latest month on record, the Ram pickup has recorded 207,591 units, running about 19 percent ahead of the 174,320 posted over the same January to June period in 2025, a rebound that coincides with the return of the HEMI V8.
Ram Pickup, United States calendar-year unit sales, 2005–2026. 2026 is January–Jun (partial).
Annual sales
| Year | Units | YoY |
|---|---|---|
| 2005 | 400,543 | — |
| 2006 | 364,177 | ▼ 9.1% |
| 2007 | 358,295 | ▼ 1.6% |
| 2008 | 245,840 | ▼ 31.4% |
| 2009 | 177,268 | ▼ 27.9% |
| 2010 | 199,652 | ▲ 12.6% |
| 2011 | 244,763 | ▲ 22.6% |
| 2012 | 312,958 | ▲ 27.9% |
| 2013 | 355,673 | ▲ 13.6% |
| 2014 | 439,789 | ▲ 23.6% |
| 2015 | 451,116 | ▲ 2.6% |
| 2016 | 487,558 | ▲ 8.1% |
| 2017 | 500,723 | ▲ 2.7% |
| 2018 | 536,980 | ▲ 7.2% |
| 2019 | 633,694 | ▲ 18.0% |
| 2020 | 563,676 | ▼ 11.0% |
| 2021 | 569,389 | ▲ 1.0% |
| 2022 | 468,344 | ▼ 17.7% |
| 2023 | 444,927 | ▼ 5.0% |
| 2024 | 373,118 | ▼ 16.1% |
| 2025 | 371,213 | ▼ 0.5% |
| 2026 (Jan–Jun) | 207,591 | ▲ 19.1% YTD |
Monthly sales
| Year | Jan | Feb | Mar | Apr | May | Jun | Jul | Aug | Sep | Oct | Nov | Dec | Total |
|---|---|---|---|---|---|---|---|---|---|---|---|---|---|
| 2005 | 24,324 | 29,202 | 35,531 | 35,986 | 38,051 | 32,825 | 48,710 | 38,681 | 35,502 | 25,086 | 25,667 | 30,978 | 400,543 |
| 2006 | 21,790 | 29,887 | 38,709 | 30,814 | 29,599 | 32,375 | 32,793 | 34,177 | 25,081 | 28,251 | 27,826 | 32,875 | 364,177 |
| 2007 | 24,379 | 28,633 | 38,301 | 31,503 | 31,327 | 31,114 | 29,312 | 32,309 | 30,100 | 24,711 | 24,488 | 32,118 | 358,295 |
| 2008 | 19,902 | 22,642 | 26,318 | 24,206 | 19,727 | 16,149 | 21,328 | 24,974 | 20,812 | 17,626 | 15,538 | 16,618 | 245,840 |
| 2009 | 12,843 | 14,448 | 19,328 | 17,903 | 15,516 | 14,478 | 17,723 | 17,514 | 13,452 | 12,262 | 9,787 | 12,014 | 177,268 |
| 2010 | 9,957 | 10,267 | 17,818 | 13,665 | 17,298 | 15,864 | 20,138 | 18,995 | 16,887 | 17,316 | 18,206 | 23,241 | 199,652 |
| 2011 | 12,197 | 18,644 | 21,898 | 17,680 | 20,117 | 21,362 | 20,311 | 21,243 | 24,522 | 21,037 | 19,739 | 26,013 | 244,763 |
| 2012 | 17,909 | 45,190 | 26,960 | 21,126 | 26,040 | 23,951 | 23,824 | 22,215 | 25,973 | 25,222 | 24,337 | 30,211 | 312,958 |
| 2013 | 20,474 | 23,289 | 33,831 | 31,409 | 31,672 | 29,644 | 31,314 | 33,009 | 28,145 | 29,846 | 29,635 | 33,405 | 355,673 |
| 2014 | 25,071 | 29,303 | 42,532 | 36,674 | 37,131 | 33,149 | 35,621 | 43,775 | 36,612 | 39,834 | 35,865 | 44,222 | 439,789 |
| 2015 | 28,618 | 31,298 | 41,595 | 37,921 | 39,952 | 33,332 | 36,019 | 45,310 | 36,598 | 40,931 | 36,407 | 43,135 | 451,116 |
| 2016 | 29,938 | 38,555 | 44,874 | 41,079 | 38,833 | 38,126 | 39,827 | 40,202 | 47,792 | 43,891 | 36,885 | 47,556 | 487,558 |
| 2017 | 33,769 | 39,046 | 46,384 | 43,321 | 44,850 | 43,073 | 39,708 | 37,608 | 47,142 | 44,201 | 36,714 | 44,907 | 500,723 |
| 2018 | 29,358 | 33,299 | 41,307 | 39,252 | 46,781 | 43,542 | 40,276 | 49,912 | 51,856 | 49,186 | 52,056 | 60,155 | 536,980 |
| 2019 | 34,889 | 39,950 | 45,187 | 49,106 | 62,250 | 68,098 | 53,169 | 59,550 | 48,916 | 56,825 | 58,929 | 56,825 | 633,694 |
| 2020 | 41,836 | 54,163 | 32,807 | 21,141 | 46,979 | 49,328 | 54,756 | 48,672 | 52,728 | 54,403 | 44,688 | 62,175 | 563,676 |
| 2021 | 47,628 | 47,628 | 53,581 | 55,455 | 53,322 | 55,455 | 41,075 | 39,554 | 41,075 | 44,872 | 44,872 | 44,872 | 569,389 |
| 2022 | 40,677 | 40,677 | 45,762 | 40,284 | 38,792 | 38,792 | 38,870 | 40,365 | 38,870 | 35,085 | 33,682 | 36,488 | 468,344 |
| 2023 | 34,655 | 33,268 | 37,427 | 39,743 | 38,214 | 39,743 | 35,061 | 37,866 | 36,464 | 37,002 | 37,002 | 38,482 | 444,927 |
| 2024 | 29,413 | 29,413 | 30,590 | 29,256 | 30,426 | 30,426 | 29,322 | 32,841 | 26,977 | 30,801 | 36,157 | 37,496 | 373,118 |
| 2025 | 26,283 | 25,231 | 27,334 | 32,237 | 33,477 | 29,758 | 30,207 | 26,420 | 28,593 | 34,907 | 35,429 | 41,337 | 371,213 |
| 2026 | 33,672 | 31,082 | 33,671 | 36,861 | 35,444 | 36,861 | — | — | — | — | — | — | 207,591 |
Ram Pickup Sales in Canada
In Canada, the Ram pickup has been a strong seller but has given back ground recently. Volume peaked at 98,465 units in 2017 and has trended lower since. Ram reported 56,992 units in 2024 and 42,758 in 2025, a decline of roughly 25 percent.
Ram Pickup, Canada calendar-year unit sales, 2004–2026. 2026 is January–Jun (partial).
Annual sales
| Year | Units | YoY |
|---|---|---|
| 2004 | 37,709 | — |
| 2005 | 37,483 | ▼ 0.6% |
| 2006 | 39,837 | ▲ 6.3% |
| 2007 | 42,296 | ▲ 6.2% |
| 2008 | 42,736 | ▲ 1.0% |
| 2009 | 28,827 | ▼ 32.5% |
| 2010 | 54,267 | ▲ 88.3% |
| 2011 | 64,297 | ▲ 18.5% |
| 2012 | 69,255 | ▲ 7.7% |
| 2013 | 80,248 | ▲ 15.9% |
| 2014 | 81,662 | ▲ 1.8% |
| 2015 | 89,908 | ▲ 10.1% |
| 2016 | 89,666 | ▼ 0.3% |
| 2017 | 98,465 | ▲ 9.8% |
| 2018 | 84,876 | ▼ 13.8% |
| 2019 | 96,763 | ▲ 14.0% |
| 2020 | 83,672 | ▼ 13.5% |
| 2021 | 73,467 | ▼ 12.2% |
| 2022 | 75,740 | ▲ 3.1% |
| 2023 | 75,257 | ▼ 0.6% |
| 2024 | 56,992 | ▼ 24.3% |
| 2025 | 42,758 | ▼ 25.0% |
| 2026 (Jan–Jun) | 25,367 | ▲ 15.9% YTD |
Monthly sales
| Year | Jan | Feb | Mar | Apr | May | Jun | Jul | Aug | Sep | Oct | Nov | Dec | Total |
|---|---|---|---|---|---|---|---|---|---|---|---|---|---|
| 2004 | 2,274 | 3,365 | 4,509 | 4,944 | 3,490 | 4,080 | 2,926 | 2,547 | 2,681 | 2,297 | 2,183 | 2,413 | 37,709 |
| 2005 | 2,313 | 2,126 | 3,146 | 3,600 | 3,404 | 3,940 | 3,664 | 3,284 | 2,727 | 3,052 | 2,999 | 3,228 | 37,483 |
| 2006 | 2,252 | 2,502 | 3,511 | 4,102 | 3,656 | 3,635 | 3,658 | 4,982 | 2,914 | 2,280 | 2,860 | 3,485 | 39,837 |
| 2007 | 2,794 | 2,820 | 4,285 | 4,098 | 4,044 | 3,721 | 3,922 | 4,520 | 2,852 | 2,382 | 2,994 | 3,864 | 42,296 |
| 2008 | 2,628 | 2,992 | 4,551 | 5,307 | 4,158 | 3,573 | 4,021 | 4,143 | 3,506 | 3,407 | 2,358 | 2,092 | 42,736 |
| 2009 | 1,795 | 1,686 | 2,493 | 2,838 | 3,569 | 0 | 2,488 | 2,870 | 3,987 | 2,589 | 1,876 | 2,636 | 28,827 |
| 2010 | 3,079 | 3,076 | 4,909 | 5,255 | 4,427 | 4,928 | 6,501 | 5,367 | 4,568 | 3,548 | 4,481 | 4,128 | 54,267 |
| 2011 | 3,833 | 4,352 | 5,284 | 5,106 | 5,553 | 6,331 | 6,485 | 5,336 | 6,167 | 5,386 | 5,445 | 5,019 | 64,297 |
| 2012 | 4,451 | 4,876 | 6,684 | 6,223 | 6,740 | 6,342 | 6,624 | 5,575 | 5,722 | 5,602 | 5,316 | 5,100 | 69,255 |
| 2013 | 5,490 | 5,174 | 7,525 | 8,090 | 8,284 | 7,344 | 7,997 | 6,891 | 6,423 | 5,723 | 5,761 | 5,546 | 80,248 |
| 2014 | 5,542 | 5,562 | 7,712 | 8,339 | 9,270 | 7,501 | 8,208 | 7,827 | 6,714 | 6,591 | 0 | 8,396 | 81,662 |
| 2015 | 5,921 | 5,735 | 8,991 | 8,120 | 9,530 | 8,133 | 9,514 | 6,738 | 8,689 | 6,901 | 5,762 | 5,874 | 89,908 |
| 2016 | 6,707 | 7,160 | 8,841 | 8,956 | 9,258 | 8,855 | 8,026 | 6,407 | 6,655 | 5,950 | 6,542 | 6,309 | 89,666 |
| 2017 | 6,064 | 7,391 | 8,347 | 9,883 | 14,990 | 11,248 | 6,990 | 8,043 | 7,732 | 5,794 | 6,710 | 5,273 | 98,465 |
| 2018 | 5,046 | 6,649 | 8,972 | 6,401 | 12,440 | 9,151 | 5,373 | 7,186 | 6,903 | 6,310 | 5,387 | 5,058 | 84,876 |
| 2019 | 6,676 | 6,069 | 6,375 | 9,485 | 9,485 | 8,625 | 9,834 | 9,834 | 8,941 | 7,704 | 6,699 | 7,036 | 96,763 |
| 2020 | 6,592 | 5,993 | 6,594 | 5,841 | 5,310 | 5,842 | 9,303 | 8,880 | 8,882 | 7,024 | 6,385 | 7,026 | 83,672 |
| 2021 | 6,783 | 6,783 | 7,801 | 6,327 | 5,752 | 6,328 | 4,883 | 5,116 | 4,885 | 6,171 | 6,171 | 6,467 | 73,467 |
| 2022 | 5,976 | 5,692 | 6,547 | 6,374 | 6,374 | 6,678 | 5,986 | 6,884 | 6,288 | 6,313 | 6,313 | 6,315 | 75,740 |
| 2023 | 6,811 | 6,192 | 7,122 | 6,732 | 7,405 | 7,407 | 5,936 | 6,827 | 5,938 | 5,198 | 4,962 | 4,727 | 75,257 |
| 2024 | 5,486 | 5,236 | 5,238 | 5,413 | 5,413 | 4,922 | 4,752 | 4,752 | 4,322 | 4,117 | 3,580 | 3,761 | 56,992 |
| 2025 | 3,458 | 3,143 | 3,302 | 4,121 | 3,933 | 3,935 | 3,628 | 3,463 | 3,465 | 3,705 | 3,060 | 3,545 | 42,758 |
| 2026 | 4,012 | 3,589 | 3,944 | 4,135 | 5,244 | 4,443 | — | — | — | — | — | — | 25,367 |







It would be nice to see the numbers further broke up between 1/2 ton, 3/4 ton, and 1 ton. As well as the different engine sales numbers.