Acura Sales Data, Trends, Analysis & Current Lineup for the U.S Automotive Market
This is your hub for all of the Acura sales data for the U.S market. If you live outside the United States you may not even know the Acura brand. Acura is the premium brand for Honda. Launched in 1986 in the United States and Canada, the Acura brand has since found its way to Russia, China and Kuwait also. As expected, all Acura models are based on Honda platforms and running gear, with tweaks made to increase performance and quality to fit the luxury brand pricing and positioning. In the United States, Acura imports some models from Japan, while other models for the US market are locally produced in Honda’s factories throughout the U.S. In its first few years of existence, Acura was among the best-selling luxury marques in the US. Since then we have seen Lexus, Infiniti and the onslaught of German brands that have come along and put some serious pressure on Acura sales in the last decade or so.
Acura US Sales Figures & Recent Highlights
- 2022 US Acura Sales – Honda blamed the weak performance in America in 2022 on supply rather than demand problems. Although sales were significantly stronger towards the end of the year, American Honda expects supply issues to continue into 2023 but to a much lesser degree. This went for both the Acura and Honda brands. Overall, 2022 was a poor year for Acura, selling just 102k cars in the United States, down 35% from 2023 and a 40% decrease in market share. The brand is struggling to keep up.
- 2021 US Acura Sales – Acura brand vehicle sales in the US in 2021 total 157,408 (+14.9%) units including 40,338 (+10.9%) passenger cars and 117,070 (+16.4%) trucks. The MSX and RDX were the most-popular Acura models in the US in 2021. Acura finished 2021 on a high note with increased MDX inventory leading Acura SUVs to all-time best annual US sales of 117,070 despite difficult supply constraints. The MDX had its 2nd best annual sales result, topping 60,000 units for the first time since 2014.
- 2020 US Acura Sales – In 2020, Honda and Acura had lower car and truck sales in the USA. Acura SUV sales topped 100,000 units for the 7th straight year. RDX sales surpassed the 50,000 mark for the 6th consecutive year with total sales of 52,785 units in 2020.
- Prior to 2020 US Acura Sales – The Honda-owned premium brand hit its peak in the U.S. market in 2005 with 209,610 sales. Since the Great Recession ended, the sales of Acura brand has hovered in the 150,000 – to 200,000-unit range annually. Just like other luxury brands in the US, Acura is also seeing a sharp decline in its car sales as more and more buyers are leaning on to light trucks. Today, Acura hopes to gain volume in the next couple of years in the US market as it saw its sales dipped slightly from 2018. They are looking to attract a wider range of customers with their new Acura RDX which was relaunched in the US in 2018.
Acura U.S Monthly Sales Data
Below we have a table that shows total Acura brand sales for the United States automotive market, broken out by month. This is on a unit basis and includes Acura new vehicle sales in the United States automotive market. These numbers are updated each month.
Acura Annual Sales, Growth & Market Share in the United States
Below we have a table that shows total Acura sales volumes for the US automotive market, broken out by year. This data captures all Acura vehicle sales for the entire United States automotive market.
| Year | Sales | YOY Change | US Marketshare | Marketshare Change |
|---|---|---|---|---|
| 1986 | 25,060 | 0.00 | 0.630 | 0.00 |
| 1987 | 54,713 | 118.33 | 1.500 | 58.07 |
| 1988 | 70,770 | 29.35 | 1.830 | 18.21 |
| 1989 | 64,638 | -8.66 | 1.850 | 1.08 |
| 1990 | 53,666 | -16.97 | 1.780 | -4.01 |
| 1991 | 77,013 | 43.50 | 2.810 | 36.55 |
| 1992 | 63,772 | -17.19 | 2.460 | -14.41 |
| 1993 | 48,882 | -23.35 | 1.780 | -38.27 |
| 1994 | 44,178 | -9.62 | 1.840 | 3.22 |
| 1995 | 18,612 | -57.87 | 0.680 | -169.09 |
| 1996 | 3,194 | -82.84 | 0.120 | -489.27 |
| 1997 | 1,303 | -59.20 | 0.040 | -158.00 |
| 1998 | 1,634 | 25.40 | 0.050 | 14.28 |
| 1999 | 694 | -57.53 | 0.020 | -123.52 |
| 2000 | 198 | -71.47 | 0.010 | -231.48 |
| 2001 | 0 | -100.00 | 0.000 | 0.00 |
| 2002 | 0 | 0.00 | 0.000 | 0.00 |
| 2003 | 0 | 0.00 | 0.000 | 0.00 |
| 2004 | 0 | 0.00 | 0.000 | 0.00 |
| 2005 | 209,610 | 0.00 | 1.220 | 100.00 |
| 2006 | 201,223 | -4.00 | 1.210 | -1.43 |
| 2007 | 179,654 | -10.72 | 1.110 | -9.02 |
| 2008 | 144,470 | -19.58 | 1.080 | -2.19 |
| 2009 | 105,723 | -26.82 | 1.010 | -7.70 |
| 2010 | 133,596 | 26.36 | 1.140 | 11.73 |
| 2011 | 123,298 | -7.71 | 0.950 | -19.45 |
| 2012 | 167,474 | 35.83 | 1.070 | 11.04 |
| 2013 | 165,436 | -1.22 | 1.060 | -1.61 |
| 2014 | 167,943 | 1.52 | 1.020 | -3.94 |
| 2015 | 177,165 | 5.49 | 1.010 | -0.32 |
| 2016 | 161,360 | -8.92 | 0.920 | -10.39 |
| 2017 | 154,602 | -4.19 | 0.890 | -2.49 |
| 2018 | 158,934 | 2.80 | 0.910 | 2.17 |
| 2019 | 157,385 | -0.97 | 0.920 | 0.90 |
| 2020 | 136,982 | -12.96 | 0.930 | 0.89 |
| 2021 | 157,408 | 14.91 | 1.050 | 11.53 |
| 2022 | 102,306 | -35.01 | 0.750 | -40.83 |
| 2023 | 145,655 | 42.37 | 0.940 | 20.28 |
| 2024 | 30,273 | 0.00 | 0.800 | 0.00 |
Acura U.S Annual Sales Units & Growth Chart
Below is a visual representation of Acura’s U.S sales units over time. We have both the Acura sales units and the growth in the United States market. Click on the items in the legend to see each series by itself.
Acura U.S Growth Rate & Market Share Chart
Below is the annual growth rate for the Acura brand in the United States, shown against the Acura’s marketshare changes in the United States. This gives you a good look into how Acura has faired against the other brands in terms of absolute sales and effect on marketshare. Click on the items in the legend to see each series by itself.
The Best-Selling Acura Cars & SUVs in the U.S
Here are the best-selling Acura models in the United States. These are just the top 5 best-selling Acura models in the United States. No surprises that SUVs are top of the list by some margin.
- Acura MDX(2022 Sales of 46,425 units). The Acura MDX is one of the workhorses model in the Acura lineup, making up about 30% of sales and along with the RDX that also makes up about 30% of sales volume is a big seller. The MDX is the best-selling three-row luxury crossover of all time with almost a million cars sold.
- Acura RDX (2022 Sales of 24,749 units). The Acura RDX is easily Acura’s most sporty crossover. The RDX is essentially a single model that can be equipped with several distinct packages. The Acura RDX is a midsize crossover SUV that has a nice balance of exciting driving experience, along with best-in-class luxury and performance for the typically reasonable Acura pricing.
- Acura Integra (2022 Sales of 13,027 units). In 2022, the Integra was reintroduced in the United States, replacing the Acura ILX. The new Integra is closely related to the Honda Civic. It is selling well and 2023 looks like a strong year. Reviews have been amazing and this could be a big volume number for the Acura team.
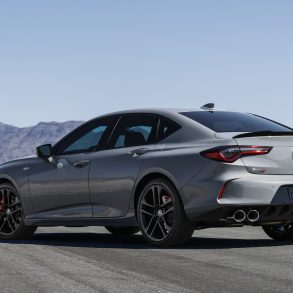
- Acura TLX (2022 Sales of 12,344 units). The TLX is designed to offer a blend of performance, comfort, advanced technology, and safety features, making it a strong contender in the competitive luxury sedan market.
The Current Acura Model Lineup & Prices in the U.S
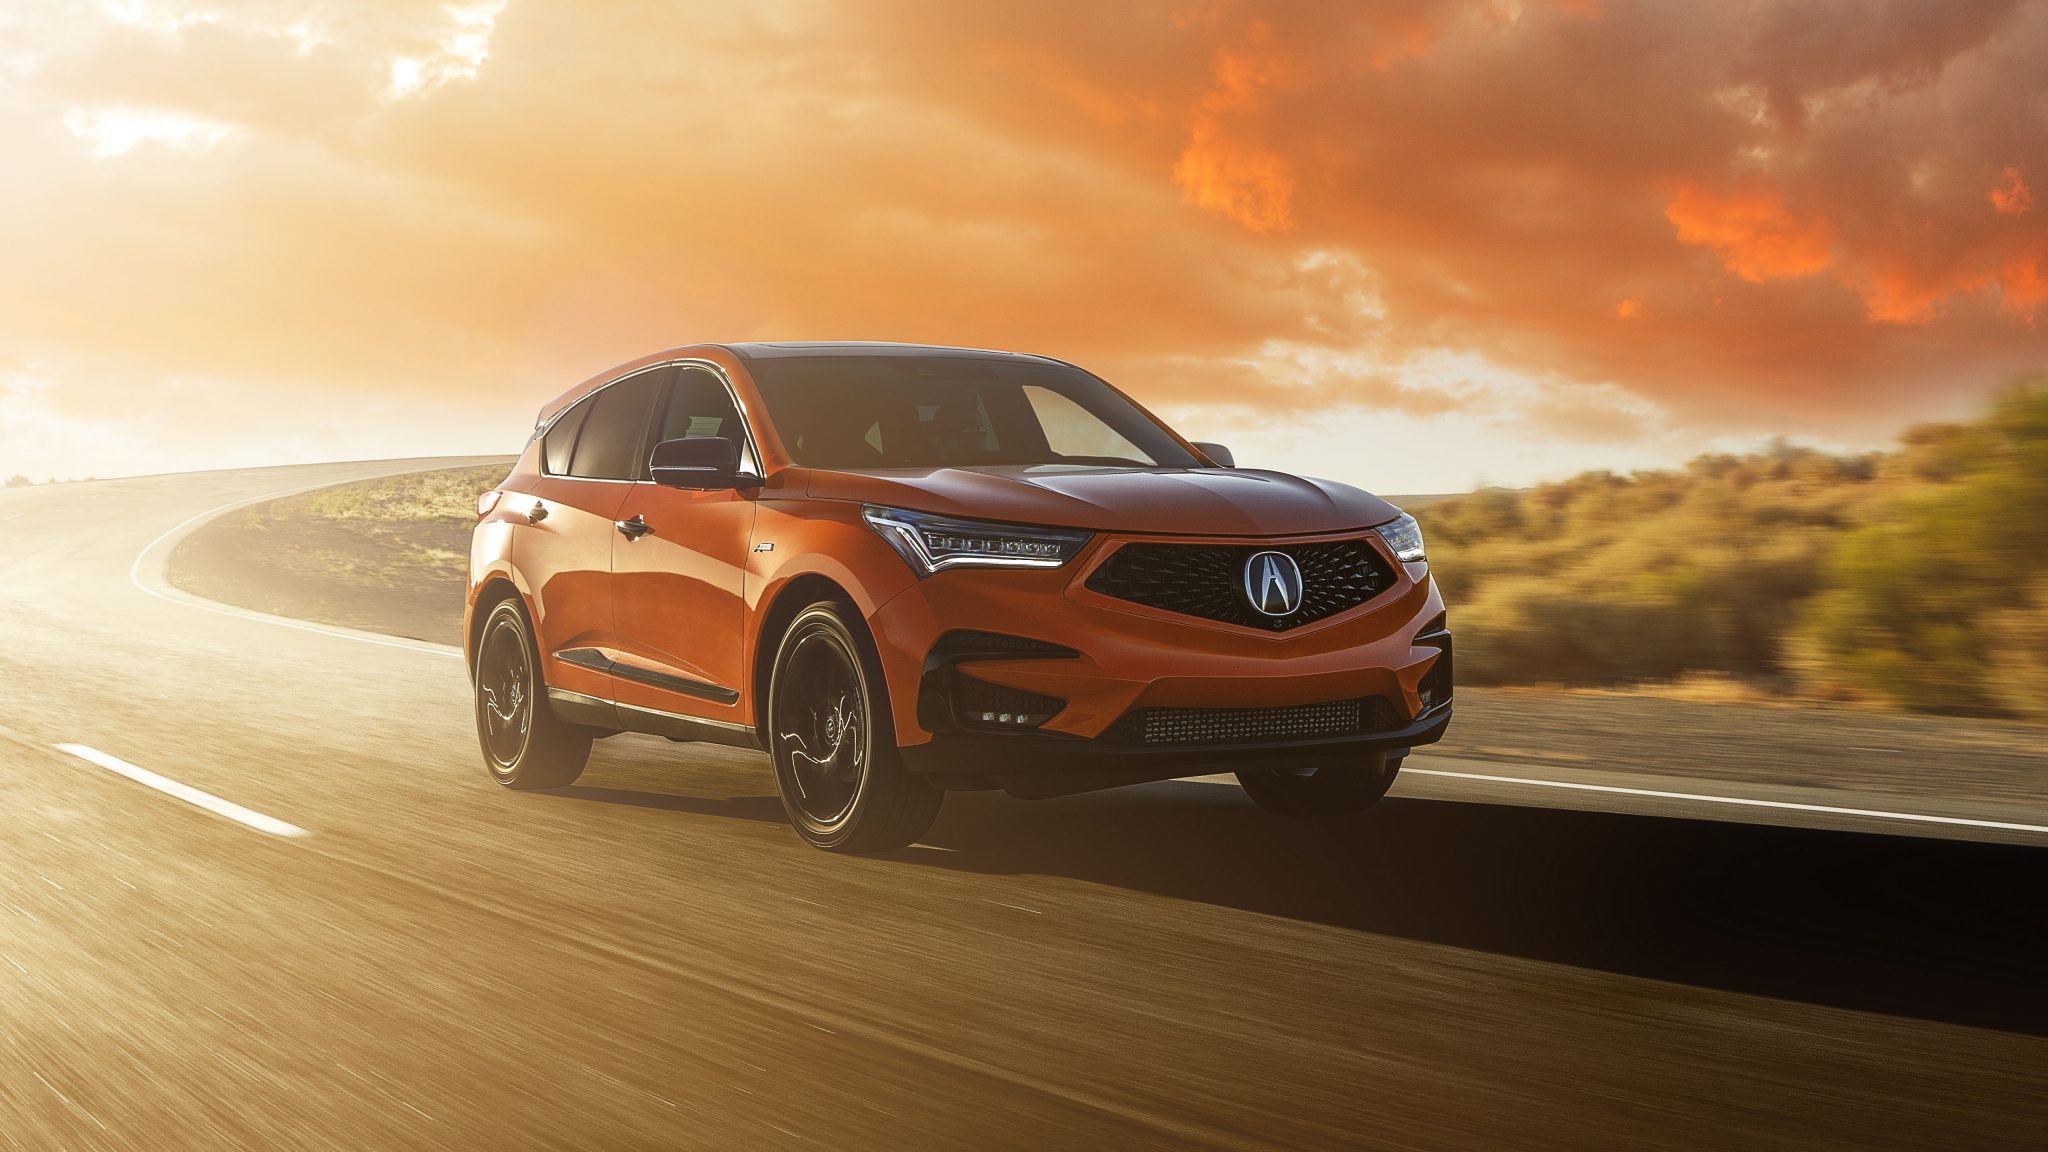
Acura RDX
Base $41,750 MSRP /
Embodying the modern compact luxury SUV, the dynamic Acura RDX includes a luxurious yet spacious interior, proven performance, and an array of life-saving safety innovations to keep you ahead of danger. Using key principles from the Acura Precision Concept, the RDX stands out with its commanding profile, low stance, and confident proportions. Powered by a direct-injected VTEC® Turbo 2.0-liter engine, you’ll have access to a balanced 272 horsepower and 280 lb-ft of torque to invigorate your commute. A premium interior helps melt away tension and stress thanks to some of the largest and widest dimensions in its class. Standard wireless Apple CarPlay and Android Auto smartphone integration lets you stream your favorite songs through the optional 16-speaker ELS Studio® 3D system. The Acura RDX provides you with a more comfortable, connected, and personalized driving experience.
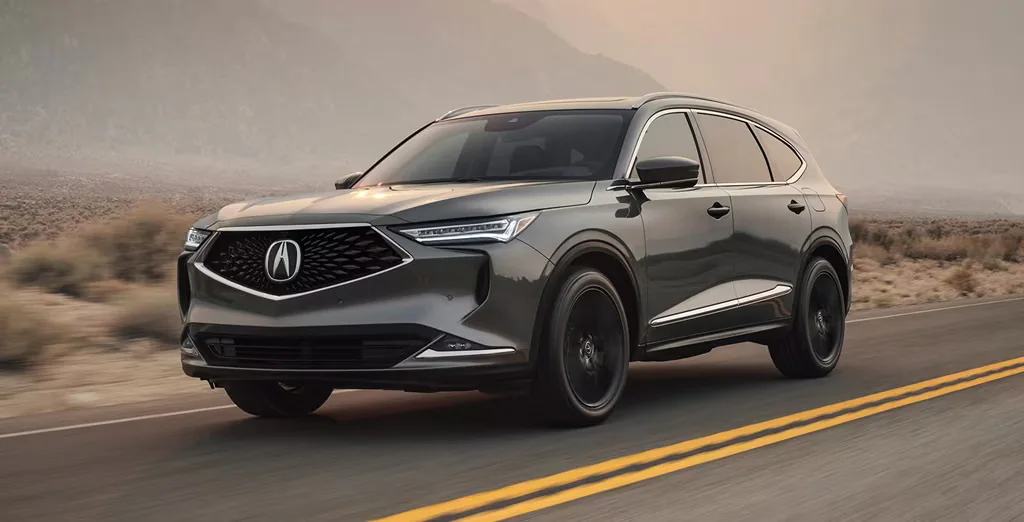
Acura MDX
Standard $49,850 MSRP / Type S $68,150 MSRP / Type S Advance $73,500 MSRP
As the world’s best-selling three-row luxury SUV of all time, it’s no surprise that the Acura MDX continues to set the benchmark for the midsize luxury SUV. Engineered to excel in more conditions, with more passengers, and with greater capabilities — the 7-passenger MDX comes with your choice of a potent 3.5-liter V6 or a thrilling 3.0-liter turbo V6 (MDX Type S). Exceptional features you can experience inside the interior of the MDX include a one-touch slide system for easy access to the rear seats, spacious legroom, and optional heated seats. Do you ever find yourself needing access to the rear cargo area when your hands are full of shopping bags? The MDX solves this dilemma with a Remote-Linked Power-Operated Tailgate. Lastly, AcuraWatch™ driver assistive safety technologies help inspire confidence behind the wheel of the Acura MDX.
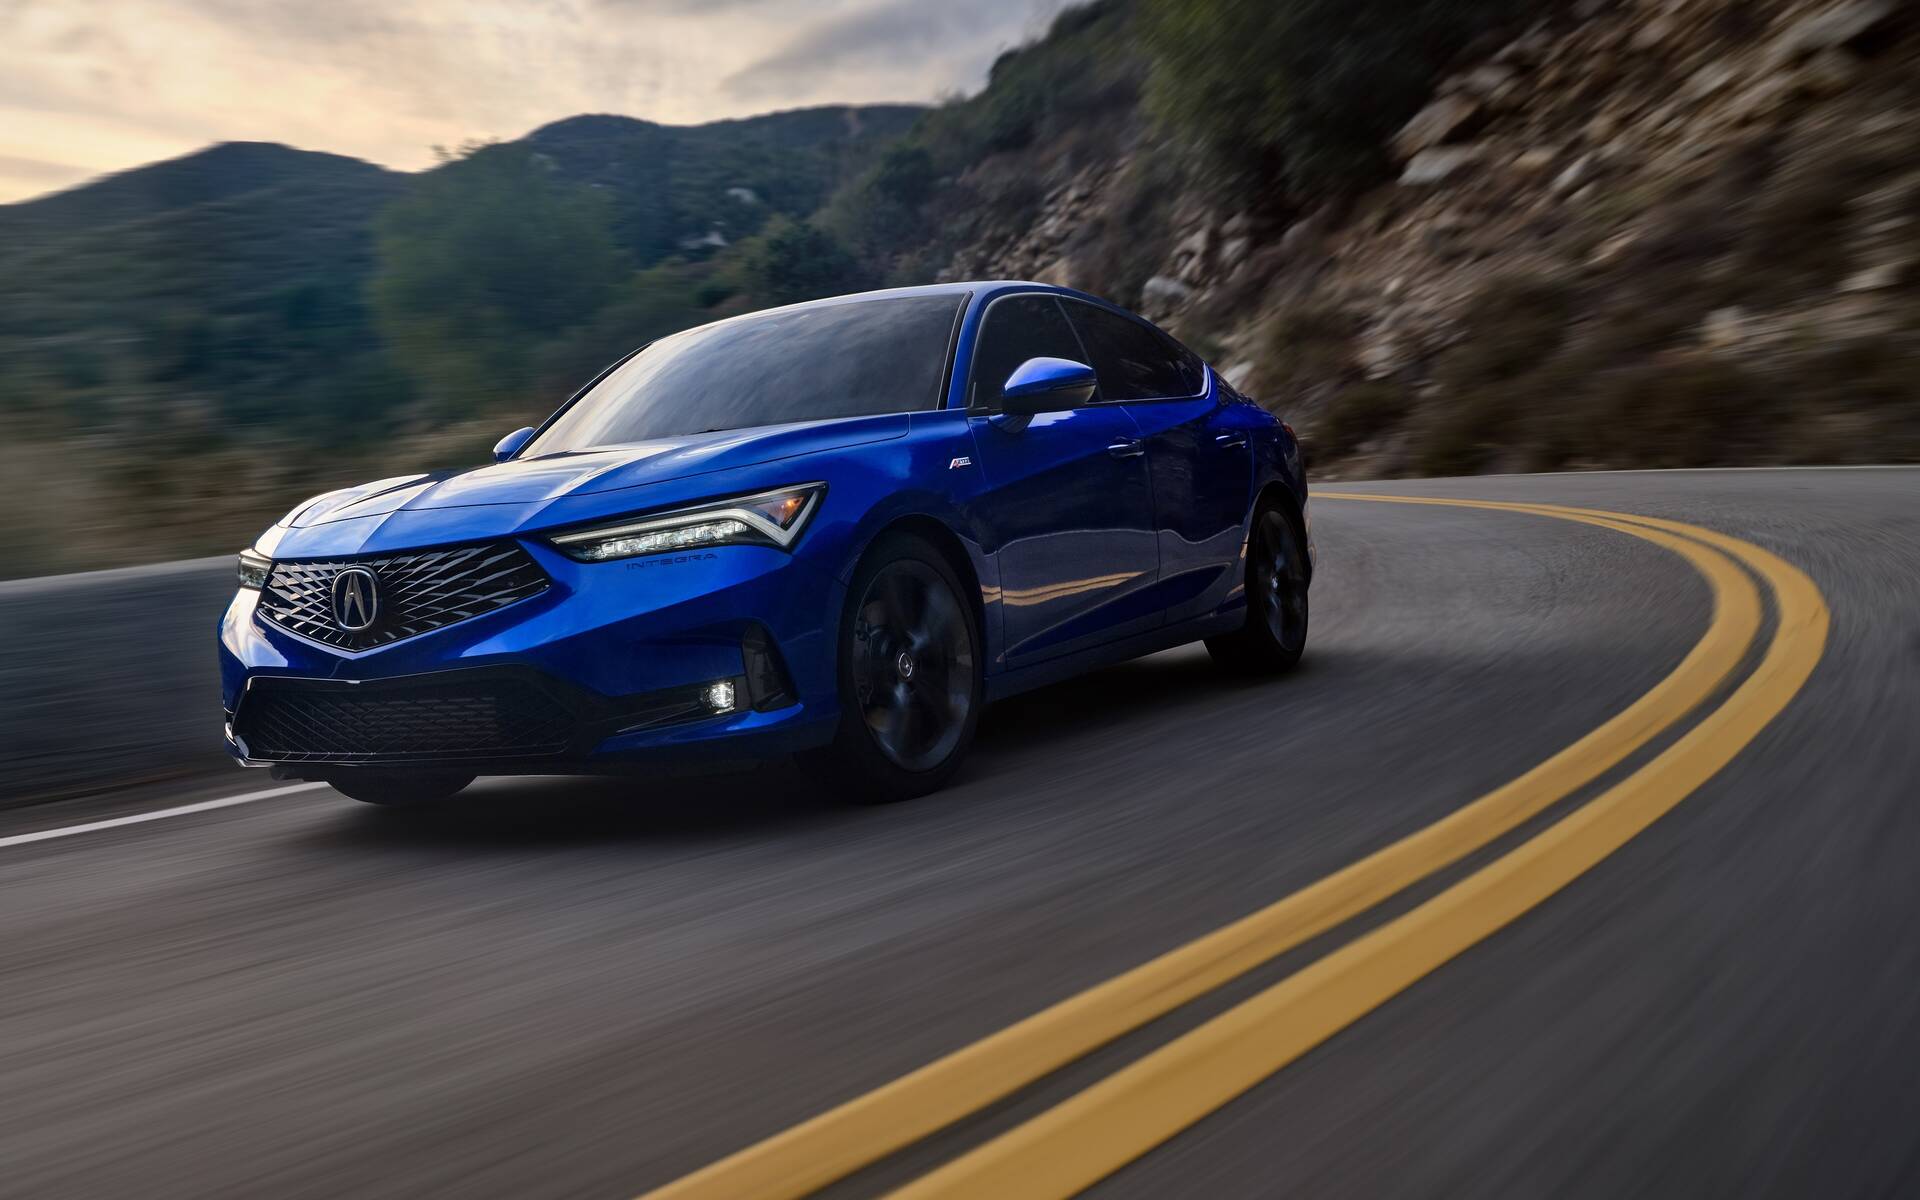
Acura Integra
Base $31,500 MSRP / Type S $50,800 MSRP
After a two-decade hiatus, one of the most adored and coveted nameplates in the history of the Acura brand has made its triumphant return to the United States. Crafted for the next generation of driving enthusiasts, the Integra stands out with its sophisticated liftback exterior appearance, potent turbocharged engine options, and driver-focused interior. Uniquely attainable and aspirational, the attractive pricepoint of the Integra helps it serve as the entryway to the Acura brand. The Integra is both the only 5-door liftback in its segment and the only premium sport compact to offer an optional 6-speed manual transmission. Step inside the interior and you’ll discover an impressive collection of advanced tech features including the remarkable 10.2-inch Acura Precision Cockpit™ digital gauge cluster, standard smartphone integration, and available head-up display (HUD). Setting a new benchmark for both active and passive safety, the Acura Integra is equipped with the proven Advanced Compatibility Engineering™ (ACE™) body structure and the current generation of the AcuraWatch™ suite of active safety and driver-assistive technologies.
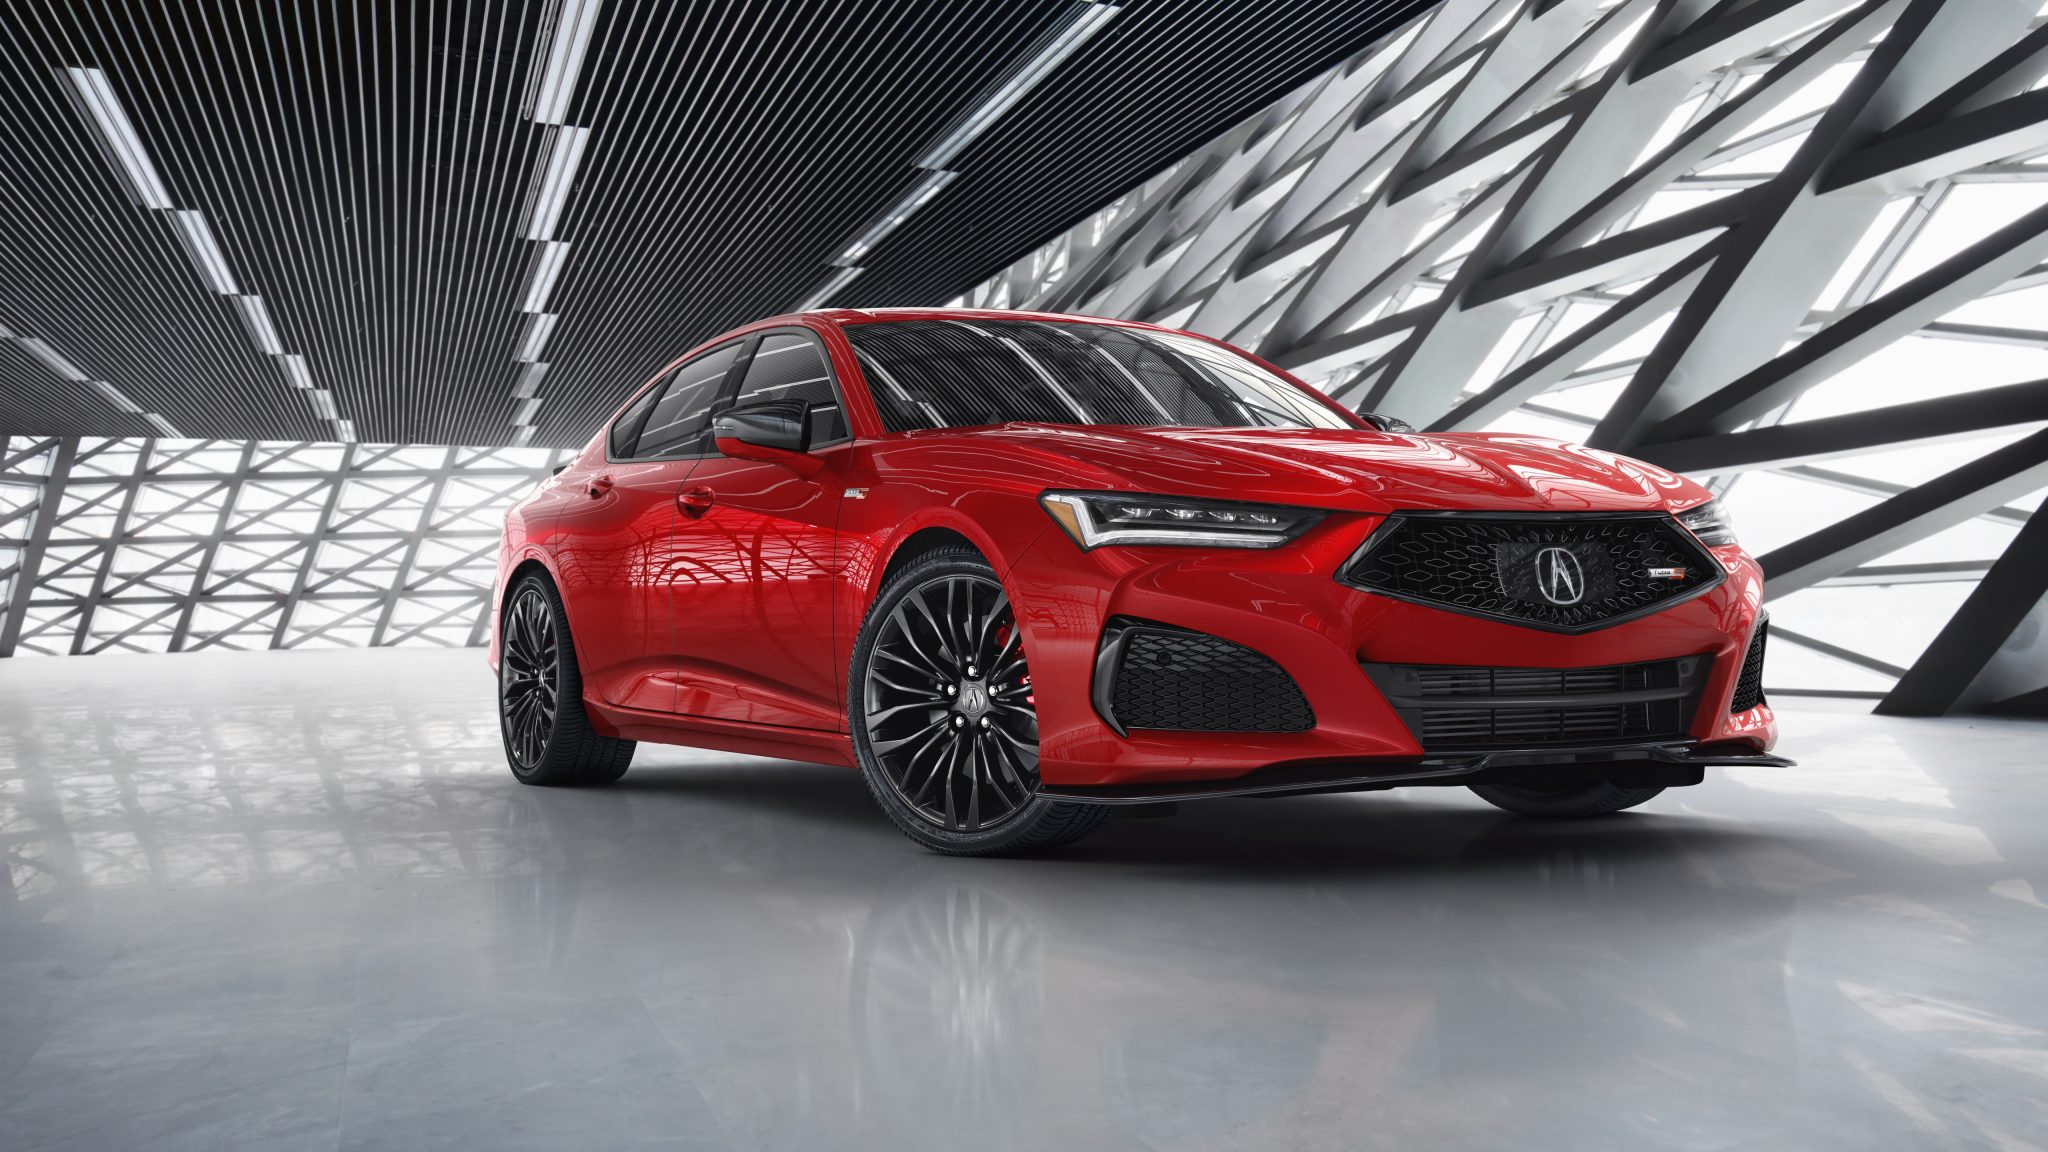
Acura TLX
Base $40,050 MSRP / Type S $55,750 MSRP
In the legendary heritage of the Acura nameplate, the dynamic TLX remains the most athletic, best-appointed, and sharpest-handling sedan the brand has ever offered. The TLX features bold styling, your choice of two turbocharged engines, a reimagined interior, and a collection of groundbreaking tech features to enhance your drive. In addition, the iconic TLX Type S high-performance model is back after a 10-year hiatus with an exclusive 3.0-liter turbocharged V6 engine and torque-vectoring Super Handling All-Wheel Drive™. Engineered with domestic and globally sourced parts, the Acura TLX is manufactured exclusively at the company’s Marysville, Ohio with engine production happening at the Anna, Ohio engine plant. When it comes to midsize luxury sedans, the competition simply cannot measure up to the tremendous collection of groundbreaking innovations found across the Acura TLX model range.