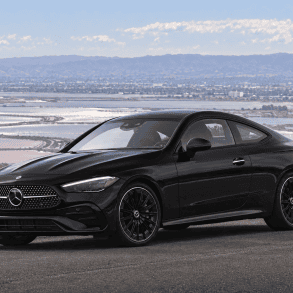
Mitsubishi Eclipse Cross
Here you will find monthly and yearly United States and Canadian sales figures for the Mitsubishi Eclipse Cross. The Eclipse Cross is Mitsubishi’s compact crossover, launched for the 2018 model year and slotted above the Outlander Sport in the North American lineup. It borrows the Eclipse name from Mitsubishi’s former sport coupe but sells on a different promise: standard all-wheel drive, a long list of standard equipment and a low entry price in a segment where all-wheel drive usually costs extra.
- Class: Compact crossover SUV
- Engine: 1.5L MIVEC DOHC turbocharged direct-injection four-cylinder, 152 horsepower at 5,500 rpm and 184 lb-ft of torque from 2,000 to 3,500 rpm
- Transmission: Continuously variable transmission
- Drivetrain: Super All-Wheel Control all-wheel drive, standard on every trim
- Trims: ES, LE, SE, SEL, plus RALLIART and Black Edition packages, from $27,695
- Fuel economy: 26 mpg combined, 25 city and 28 highway on the ES
- Cargo volume: 23.4 cubic feet behind the second row and 50.1 cubic feet behind the first
- Chief rivals: Honda HR-V, Hyundai Kona, Kia Seltos, Nissan Kicks, Subaru Crosstrek
Changes for 2026 are minimal: Mitsubishi dropped embedded navigation and made the Eclipse Cross hood badge standard on SEL and SEL Touring, with the rest of the package carried over.
Mitsubishi Eclipse Cross Sales in the United States
The Eclipse Cross has had two distinct lives in the United States. The launch year of 2018 produced 9,485 units from a partial calendar, and the first full year in 2019 delivered 19,661, a figure the nameplate then spent five years failing to match. Volume fell to 10,319 in 2020 and bottomed at 8,946 in 2021, then moved sideways at 10,717 in 2022 and 9,922 in 2023. The recovery began in 2024 at 12,725 and accelerated hard in 2025 to 17,377 units, a gain of about 37 percent and the best full year since 2019. That momentum has carried into 2026: 11,260 units through June against 8,265 in the same period of 2025, up roughly 36 percent, with January and March both clearing 2,300 units.
Mitsubishi Eclipse Cross, United States calendar-year unit sales, 2018–2026. 2026 is January–Sep (partial).
Annual sales
| Year | Units | YoY |
|---|---|---|
| 2018 | 9,485 | — |
| 2019 | 19,661 | ▲ 107.3% |
| 2020 | 10,319 | ▼ 47.5% |
| 2021 | 8,946 | ▼ 13.3% |
| 2022 | 10,717 | ▲ 19.8% |
| 2023 | 9,922 | ▼ 7.4% |
| 2024 | 12,725 | ▲ 28.3% |
| 2025 | 17,377 | ▲ 36.6% |
| 2026 (Jan–Sep) | 14,135 | ▲ 15.8% YTD |
Monthly sales
| Year | Jan | Feb | Mar | Apr | May | Jun | Jul | Aug | Sep | Oct | Nov | Dec | Total |
|---|---|---|---|---|---|---|---|---|---|---|---|---|---|
| 2018 | — | 49 | 604 | 655 | 851 | 807 | 775 | 858 | 914 | 1,206 | 1,169 | 1,597 | 9,485 |
| 2019 | 1,563 | 4,291 | 3,143 | 920 | 1,012 | 1,662 | 811 | 973 | 1,484 | 1,046 | 1,336 | 1,420 | 19,661 |
| 2020 | 2,118 | 2,036 | 1,030 | 413 | 367 | 382 | 852 | 757 | 820 | 521 | 428 | 595 | 10,319 |
| 2021 | 507 | 507 | 570 | 937 | 901 | 937 | 872 | 839 | 872 | 668 | 668 | 668 | 8,946 |
| 2022 | 1,277 | 1,277 | 1,437 | 588 | 566 | 566 | 872 | 905 | 872 | 786 | 754 | 817 | 10,717 |
| 2023 | 517 | 496 | 558 | 932 | 896 | 932 | 1,061 | 1,146 | 1,104 | 750 | 750 | 780 | 9,922 |
| 2024 | 1,139 | 1,139 | 1,185 | 820 | 853 | 853 | 1,380 | 1,546 | 1,270 | 749 | 879 | 912 | 12,725 |
| 2025 | 1,244 | 1,194 | 1,293 | 1,531 | 1,590 | 1,413 | 1,398 | 1,223 | 1,325 | 1,614 | 1,638 | 1,914 | 17,377 |
| 2026 | 2,344 | 2,164 | 2,344 | 1,488 | 1,431 | 1,489 | 882 | 949 | 1,044 | — | — | — | 14,135 |
Mitsubishi Eclipse Cross Sales in Canada
Canada has been the steadier of the two markets and takes a much larger share of Eclipse Cross volume relative to population. The nameplate opened at 3,596 units in 2018 and peaked early at 5,101 in 2019 before the pandemic year cut it to 2,972 in 2020. From there the line grinds upward: 4,520 in 2021, 4,446 in 2022, 5,428 in 2023, 5,292 in 2024 and a record 5,930 in 2025. The first half of 2026 has cooled, with 2,683 units through June against 3,115 in the same six months of 2025, a decline of about 14 percent that runs counter to the surge in the United States.
Mitsubishi Eclipse Cross, Canada calendar-year unit sales, 2018–2026. 2026 is January–Jun (partial).
Annual sales
| Year | Units | YoY |
|---|---|---|
| 2018 | 3,596 | — |
| 2019 | 5,101 | ▲ 41.9% |
| 2020 | 2,972 | ▼ 41.7% |
| 2021 | 4,520 | ▲ 52.1% |
| 2022 | 4,446 | ▼ 1.6% |
| 2023 | 5,428 | ▲ 22.1% |
| 2024 | 5,292 | ▼ 2.5% |
| 2025 | 5,930 | ▲ 12.1% |
| 2026 (Jan–Jun) | 2,683 | ▼ 13.9% YTD |
Monthly sales
| Year | Jan | Feb | Mar | Apr | May | Jun | Jul | Aug | Sep | Oct | Nov | Dec | Total |
|---|---|---|---|---|---|---|---|---|---|---|---|---|---|
| 2018 | 0 | 47 | 294 | 412 | 291 | 330 | 354 | 412 | 391 | 378 | 357 | 330 | 3,596 |
| 2019 | 440 | 400 | 421 | 480 | 480 | 438 | 515 | 515 | 470 | 338 | 294 | 310 | 5,101 |
| 2020 | 380 | 346 | 382 | 137 | 125 | 139 | 270 | 258 | 259 | 232 | 211 | 233 | 2,972 |
| 2021 | 383 | 383 | 442 | 420 | 382 | 421 | 283 | 296 | 284 | 402 | 402 | 422 | 4,520 |
| 2022 | 662 | 630 | 726 | 232 | 232 | 246 | 247 | 284 | 260 | 309 | 309 | 309 | 4,446 |
| 2023 | 488 | 443 | 511 | 387 | 425 | 427 | 450 | 517 | 451 | 464 | 443 | 422 | 5,428 |
| 2024 | 430 | 411 | 412 | 414 | 414 | 379 | 524 | 524 | 477 | 469 | 408 | 430 | 5,292 |
| 2025 | 465 | 423 | 446 | 612 | 584 | 585 | 445 | 425 | 427 | 545 | 450 | 523 | 5,930 |
| 2026 | 396 | 354 | 390 | 543 | 494 | 506 | — | — | — | — | — | — | 2,683 |