
Mazda Sales Data, Trends, Analysis & Current Lineup for the U.S Automotive Market
This is your hub for all of the Mazda sales data for the U.S market. Mazda used to be the fourth of the Japanese manufacturers in the United States until it was overtaken in 2009 by an on-fire Subaru. Despite a very positively-received range of mainstream cars and SUVs with a sporty bend Mazda has been struggling to break out of the 200-300k/year band, though it finally managed that in 2014, 2015 and 2018 before dropping below 300k again in 2019.
Part of Mazda’s problem is that its mainstream cars have struggled to connect with the buyers, with the Mazda3 hovering around 100k/year and the Mazda6 even lower at around 60k/year, but both dropped to half of that in 2019, while cars like the Honda Civic and Accord easily reach 300k and 250k per year respectively. Even the CX-5 and CX-9, which often topped comparison tests, struggled to sell a third of what rivals from Honda or Toyota managed. The second part of Mazda’s problem is that, as an independent manufacturer, it cannot afford to cover every segment, and often has to pull out of those it does not do very well in (Minivans with the MPV and Mazda5, sporty SUV with the CX-7, subcompact with the Mazda2). Still, niche cars such as the MX-5 Miata and in the past the RX-8 ensure the manufacturer has a certain cult following even though that may never quite be converted into sales.
Mazda is a relatively small company when compared to other Japanese major automakers such as Toyota and Honda, usually ranking around 15th in the world by sales. Yet their cars are almost always affordable, reliable, well-engineered, efficient, and fun to drive. Their first vehicle was the Mazda-Go, the first auto rickshaw, a 3-wheeled cross between a truck and a motorcycle that was first introduced in 1931. Their first four-wheeled vehicles were trucks, starting in the 1950s, and they introduced their first real car, the 2-door micro-mini R360 Coupe in 1960. In 1962, the Carol 360 was announced, a 4-door micro-mini with room for four adults. With these vehicles, the manufacturer captured a large part of the lightweight car market in Japan. Over the years the Mazda lineup expanded, adding larger and more powerful vehicles. In 1970, Mazda started selling vehicles in the United States, beginning with the RX-2, and the rest is history.
Mazda U.S Sales Figures & Recent Highlights
Despite a very positively-received range of mainstream cars and SUVs with a sporty bend Mazda has been struggling to break out of the 200-300k mark per year , though it finally managed that in 2014, 2015 and 2018 before dropping below 300k again in 2019.
The big reason for this fluctuating sales is because Mazda’s mainstream models have failed to connect to the buyers in the US. For instance, the Mazda3 and the Mazda6, were both performing really well sales-wise but their sales dropped to 50% in 2019. We like to see Mazda to recover its loses in 2019 as their niche cars such as the MX-5 Miata and in the past the RX-8 still has a cult following in the US which makes sure that the brand will not continue dropping their sales for the next couple of years.
Throughout the 2010s, Mazda heavily promoted its Skyactiv technology, which encompasses a range of technologies designed to improve fuel efficiency and driving dynamics without switching to full electrification. Mazda introduced its first all-electric vehicle, the MX-30, in 2020. The brand has plans to electrify its lineup, aiming for all its vehicles to have some form of electrification by 2030, with EVs expected to account for a significant proportion.
As you can see, Mazda sales in the US have been on a mostly upward trend in recent years, with the exception of a slight decline in 2020. In 2022, Mazda sales in the US increased by 11.4%, despite the ongoing chip shortage and other supply chain disruptions. The introduction of new and updated models, such as the Mazda3, Mazda6, and CX-50 all helped increased sales, while Mazda’s focus on driving dynamics and performance, which has attracted a loyal following of enthusiasts.
In 2020, Mazda introduced the CX-30, a new compact SUV that has been a popular seller and in the same year Mazda introduced the Mazda3 Hybrid, the brand’s first hybrid vehicle. In 2022, Mazda introduced the CX-50, a new midsize SUV that is designed for off-road driving.
Mazda Monthly Sales Data in the U.S
Below we have a table that shows Mazda sales for the United States automotive market, but this time it is broken out by month. This is on a unit basis. This is Mazda new vehicle sales in the US.
Mazda Annual Sales, Growth & Market Share in the United States
Below we have a table that shows total Mazda sales volumes for the US automotive market, broken out by year. This data captures all Mazda vehicle sales for the entire United States automotive market.
| Year | Sales | YOY Change | US Marketshare | Marketshare Change |
|---|---|---|---|---|
| 1978 | 19,299 | 0.00 | 5.07 | 0.00 |
| 1979 | 54,853 | 184.23 | 11.76 | 56.89 |
| 1980 | 43,731 | -20.28 | 4.41 | -166.81 |
| 1981 | 43,418 | -0.72 | 3.37 | -30.75 |
| 1982 | 48,889 | 12.60 | 4.00 | 15.67 |
| 1983 | 52,514 | 7.41 | 3.18 | -25.53 |
| 1984 | 55,696 | 6.06 | 2.64 | -20.70 |
| 1985 | 53,810 | -3.39 | 1.45 | -81.86 |
| 1986 | 56,203 | 4.45 | 1.41 | -2.83 |
| 1987 | 38,345 | -31.77 | 1.05 | -34.19 |
| 1988 | 33,531 | -12.55 | 0.87 | -20.98 |
| 1989 | 63,389 | 89.05 | 1.82 | 52.21 |
| 1990 | 100,294 | 58.22 | 3.33 | 45.42 |
| 1991 | 108,604 | 8.29 | 3.96 | 15.92 |
| 1992 | 112,447 | 3.54 | 4.33 | 8.50 |
| 1993 | 118,904 | 5.74 | 4.32 | -0.23 |
| 1994 | 127,766 | 7.45 | 5.31 | 18.60 |
| 1995 | 79,032 | -38.14 | 2.90 | -83.27 |
| 1996 | 74,071 | -6.28 | 2.68 | -7.90 |
| 1997 | 69,529 | -6.13 | 2.39 | -12.13 |
| 1998 | 70,774 | 1.79 | 2.27 | -5.60 |
| 1999 | 81,297 | 14.87 | 2.74 | 17.35 |
| 2000 | 119,499 | 46.99 | 4.26 | 35.66 |
| 2001 | 156,139 | 30.66 | 6.87 | 37.90 |
| 2002 | 162,759 | 4.24 | 6.84 | -0.32 |
| 2003 | 148,989 | -8.46 | 7.37 | 7.10 |
| 2004 | 72,309 | -51.47 | 5.17 | -42.58 |
| 2005 | 258,341 | 257.27 | 1.51 | -242.40 |
| 2006 | 268,786 | 4.04 | 1.61 | 6.41 |
| 2007 | 296,110 | 10.17 | 1.82 | 11.65 |
| 2008 | 263,849 | -10.89 | 1.98 | 7.77 |
| 2009 | 207,677 | -21.29 | 1.98 | -0.13 |
| 2010 | 229,576 | 10.54 | 1.96 | -0.90 |
| 2011 | 250,426 | 9.08 | 1.94 | -1.06 |
| 2012 | 302,701 | 20.87 | 1.94 | 0.04 |
| 2013 | 283,945 | -6.20 | 1.81 | -7.00 |
| 2014 | 305,801 | 7.70 | 1.85 | 2.03 |
| 2015 | 319,185 | 4.38 | 1.82 | -1.40 |
| 2016 | 297,315 | -6.85 | 1.69 | -7.93 |
| 2017 | 289,469 | -2.64 | 1.68 | -0.86 |
| 2018 | 300,325 | 3.75 | 1.73 | 3.06 |
| 2019 | 278,550 | -7.25 | 1.63 | -5.80 |
| 2020 | 279,076 | 0.19 | 1.90 | 13.90 |
| 2021 | 328,237 | 17.62 | 2.19 | 13.57 |
| 2022 | 294,909 | -10.15 | 2.15 | -1.88 |
| 2023 | 365,044 | 23.78 | 2.35 | 8.30 |
| 2024 | 100,103 | 0.00 | 2.64 | 0.00 |
Mazda U.S Annual Sales Units & Growth Chart
Below is a visual representation of Mazda’s U.S sales units over time. We have both the Mazda sales units and the growth in the United States market. Click on the items in the legend to see each series by itself.
Mazda U.S Growth Rate & Market Share Chart
Below is the annual growth rate for the Mazda brand in the United States, shown against the Mazda’s marketshare changes in the United States. This gives you a good look into how Mazda has faired against the other brands in terms of absolute sales and effect on marketshare. Click on the items in the legend to see each series by itself.
The Best-Selling Mazda Cars & SUVs in the United States
These are just the best-selling Mazda models in the US. Mazda also offers a number of other popular models, such as the MX-5 Miata sports car.
- Mazda CX-5 (151,594 sold in 2022).The Mazda CX-5 is a compact SUV that has been the best-selling Mazda model in the US for several years. It is known for its stylish design, comfortable ride, and engaging driving dynamics.
- Mazda CX-30 (52,808 sold in 2022).The Mazda CX-30 is a subcompact SUV that is similar in size to the Mazda3. It offers a more stylish and upscale design than the CX-5, but it is not as spacious.
- Mazda CX-9 (34,580 sold in 2022). The Mazda CX-9 is a midsize SUV that is known for its spacious interior and comfortable ride. It is also one of the few Mazda models that is available with a third row of seats.
- Mazda 3 (27,767 sold in 2022). The Mazda3 is a compact car that is offered in both sedan and hatchback body styles. It is known for its sporty handling, fuel-efficient engines, and upscale interior.
- Mazda CX-50 (21,329 sold in 2022).
The Current Mazda Model Lineup & Prices in the U.S
Over the years, Mazda has been working to position itself as a more premium brand compared to its direct competitors. They’ve been focusing on enhancing the interior quality, improving driving dynamics, and offering more advanced features in their models. In 2019, Mazda introduced the CX-30, a compact crossover that fits between the subcompact CX-3 and the compact CX-5. It quickly became a popular model in the brand’s lineup. Mazda is also planning to introduce an electric SUV in 2024 and a new sports car in 2025.
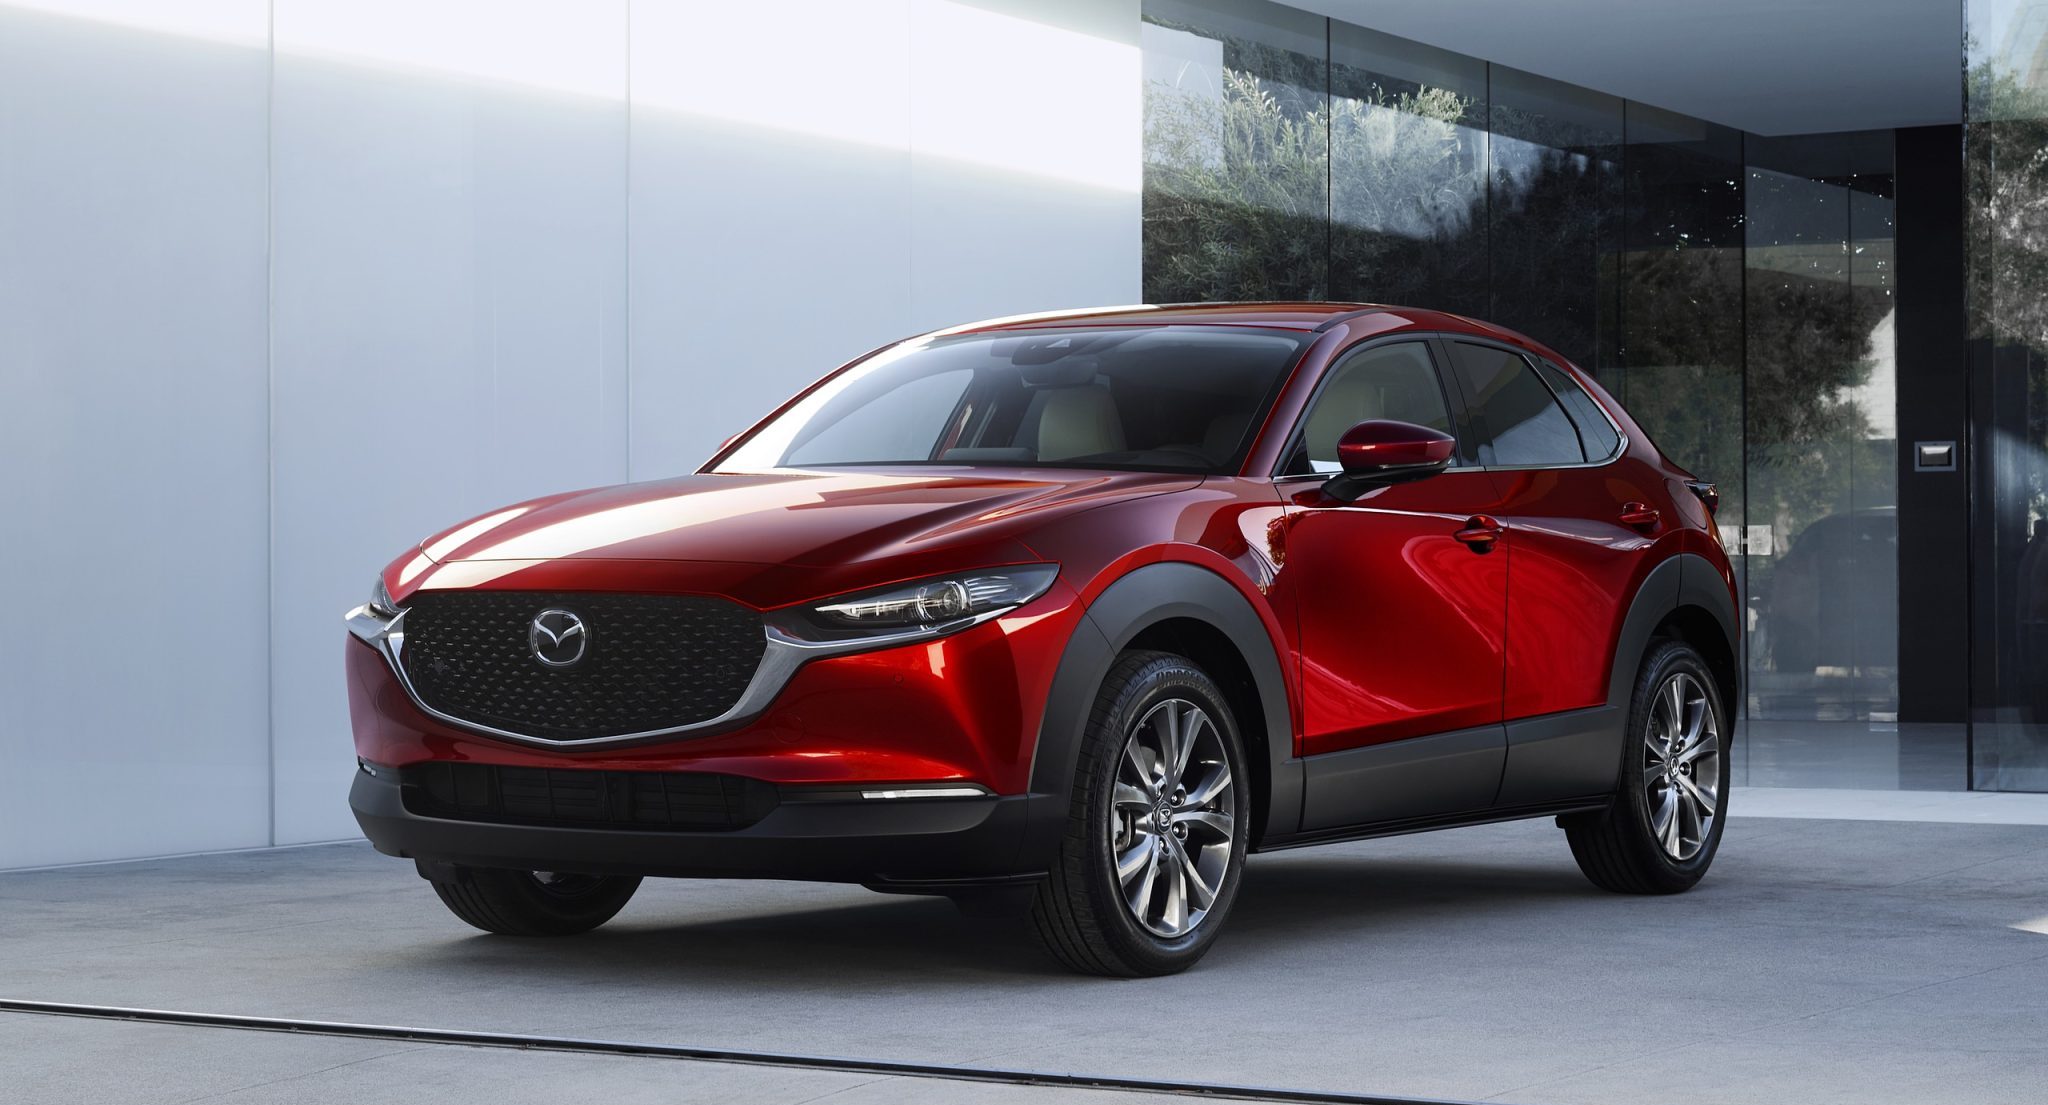
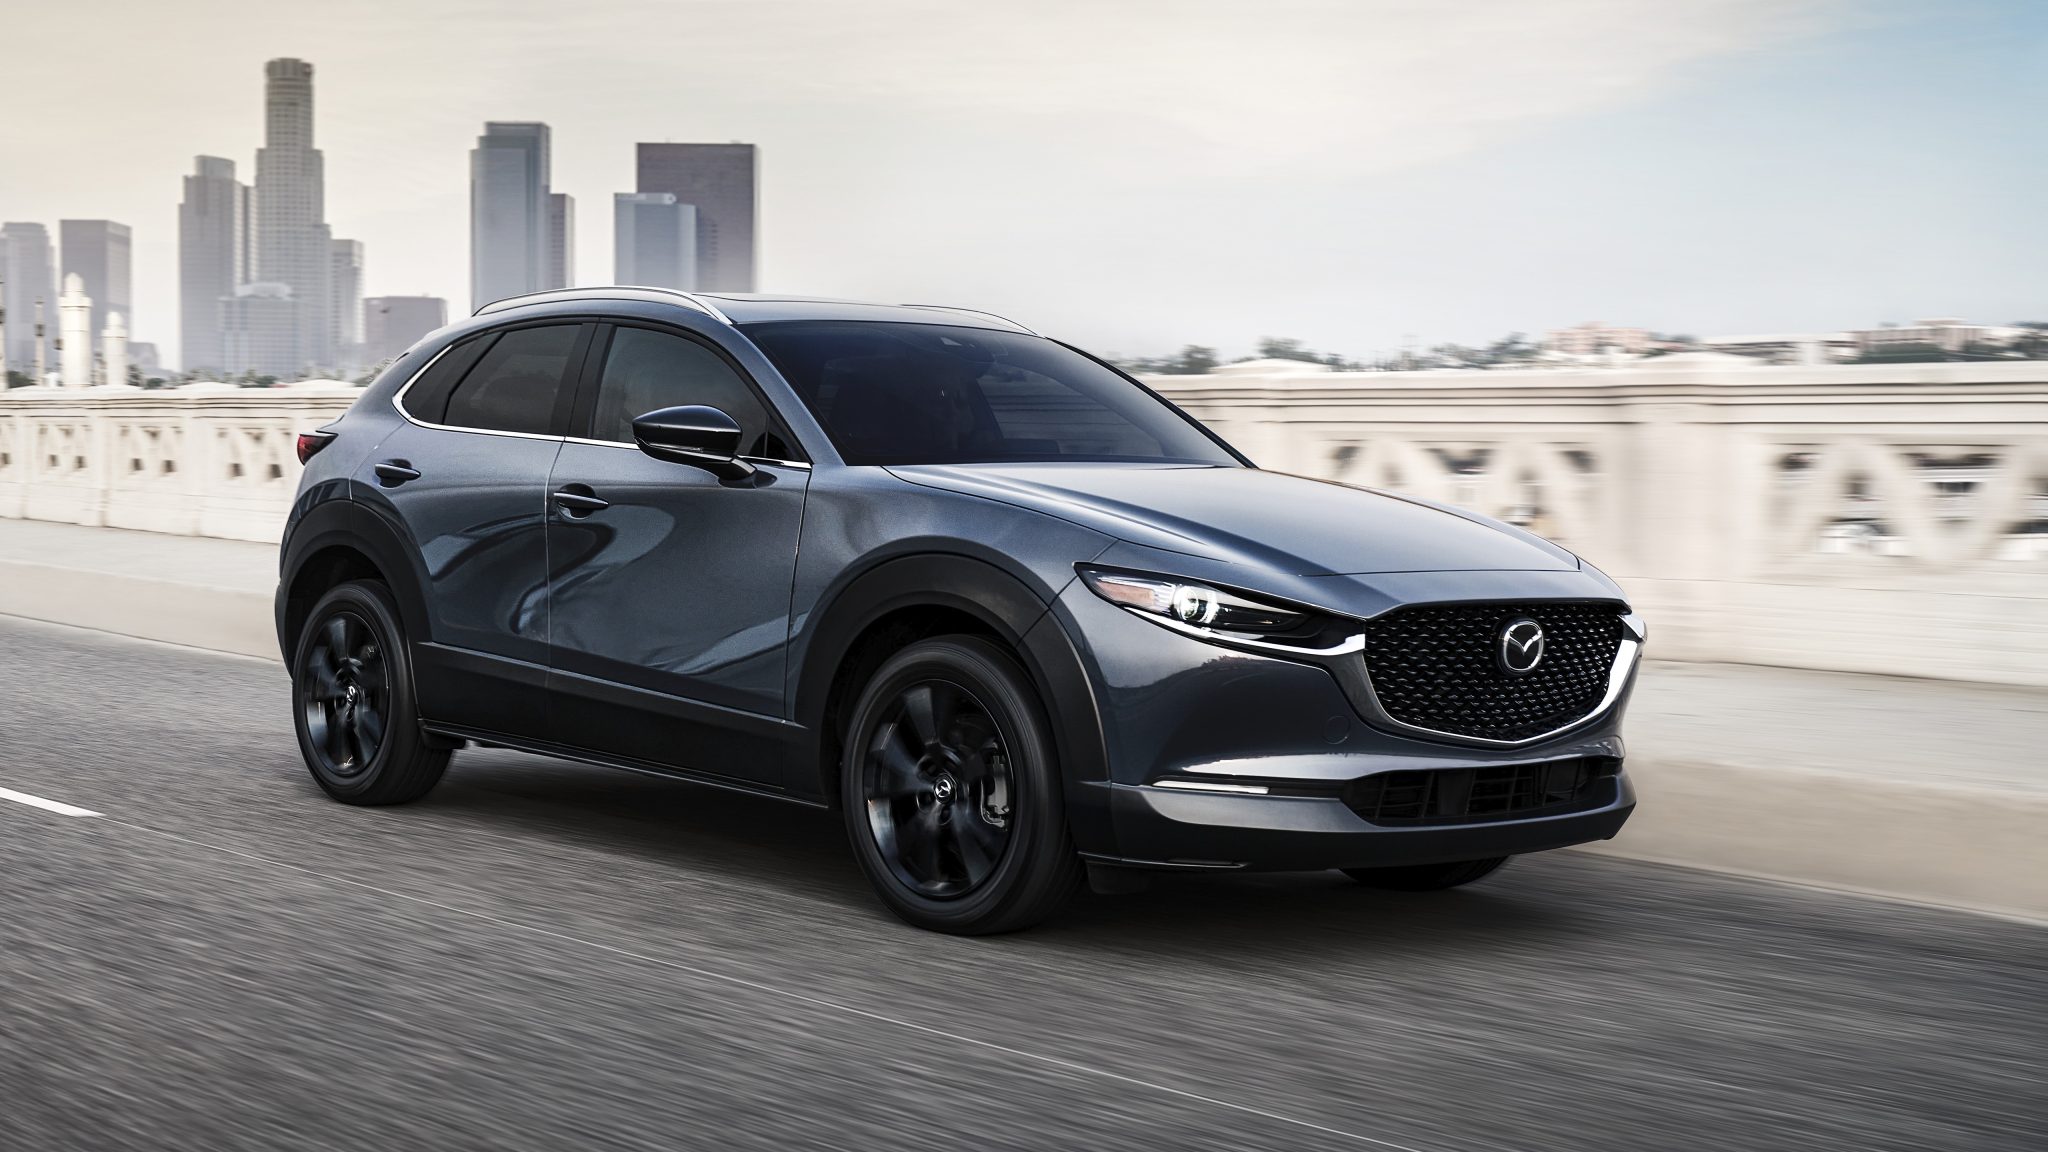
Mazda CX-30
Starting at $22,950
The 2023 Mazda CX-30 is a subcompact SUV that is offered in five trim levels: 2.5 S, 2.5 S Select, 2.5 S Preferred, 2.5 S Carbon Edition, 2.5 Turbo Premium, and 2.5 Turbo Premium Plus. The base 2.5 S is powered by a 2.5-liter four-cylinder engine that produces 191 horsepower and 186 lb-ft of torque. It is paired with a six-speed automatic transmission and standard front-wheel drive. All-wheel drive is available as an option. The 2.5 Turbo Premium and 2.5 Turbo Premium Plus models are powered by a turbocharged 2.5-liter four-cylinder engine that produces 250 horsepower and 320 lb-ft of torque. They are also equipped with a six-speed automatic transmission and standard all-wheel drive.
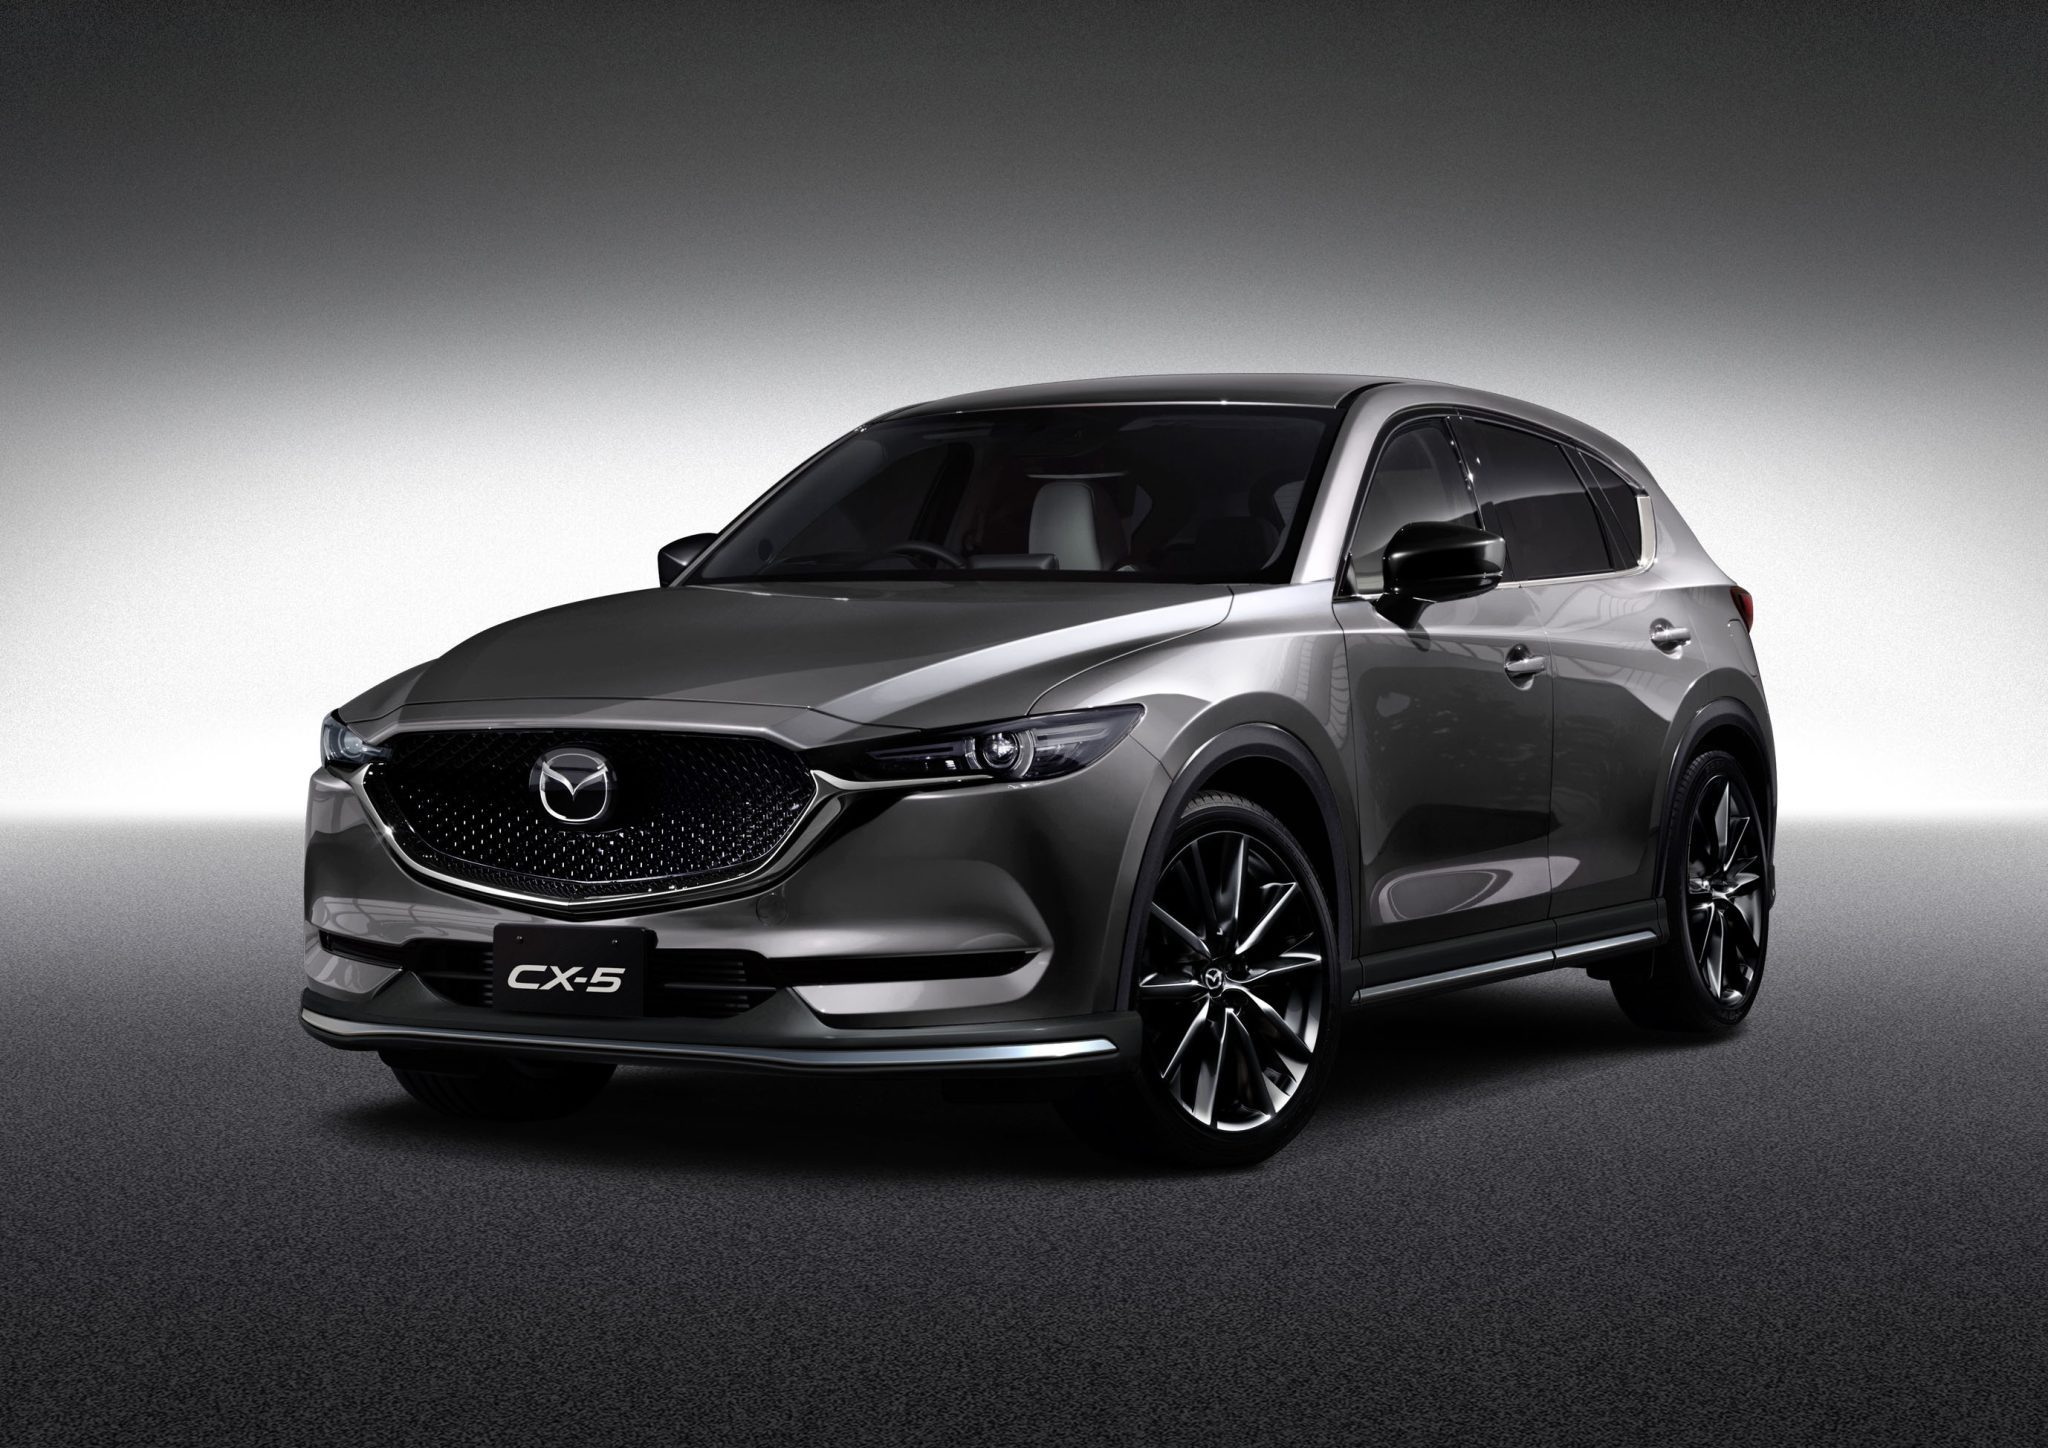
Mazda CX-5
Starting at $29,300
The 2023 Mazda CX-5 is a compact SUV that is offered in six trim levels: Sport, Touring, Carbon Edition, Grand Touring, Signature, and Turbo. The base Sport is powered by a 2.5-liter four-cylinder engine that produces 187 horsepower and 186 lb-ft of torque. It is paired with a six-speed automatic transmission and standard front-wheel drive. All-wheel drive is available as an option. The Touring, Carbon Edition, Grand Touring, and Signature models are powered by the same engine, but they come standard with all-wheel drive. The Turbo model is powered by a turbocharged 2.5-liter four-cylinder engine that produces 256 horsepower and 320 lb-ft of torque. It is also paired with a six-speed automatic transmission, but it is only available with all-wheel drive.
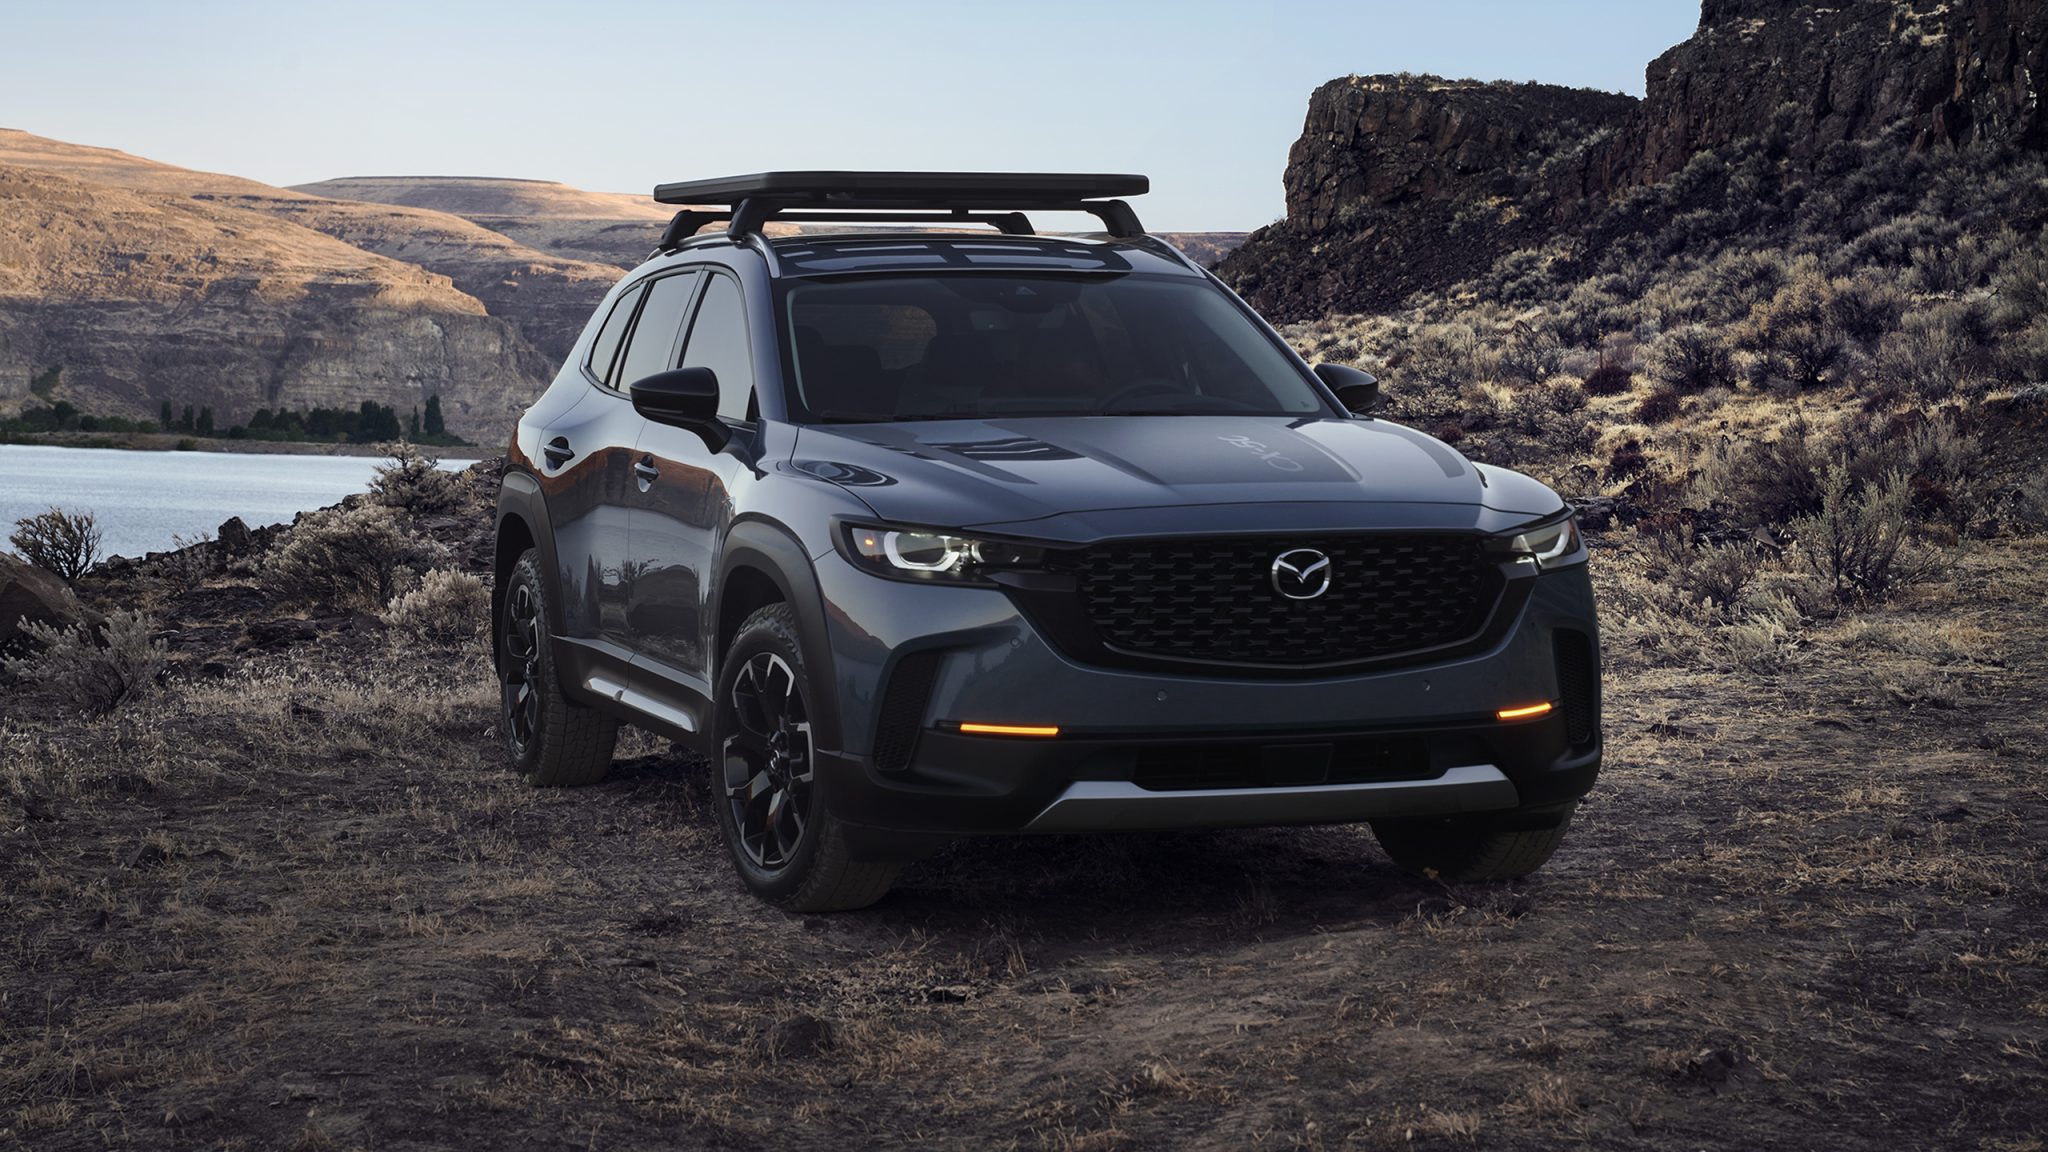
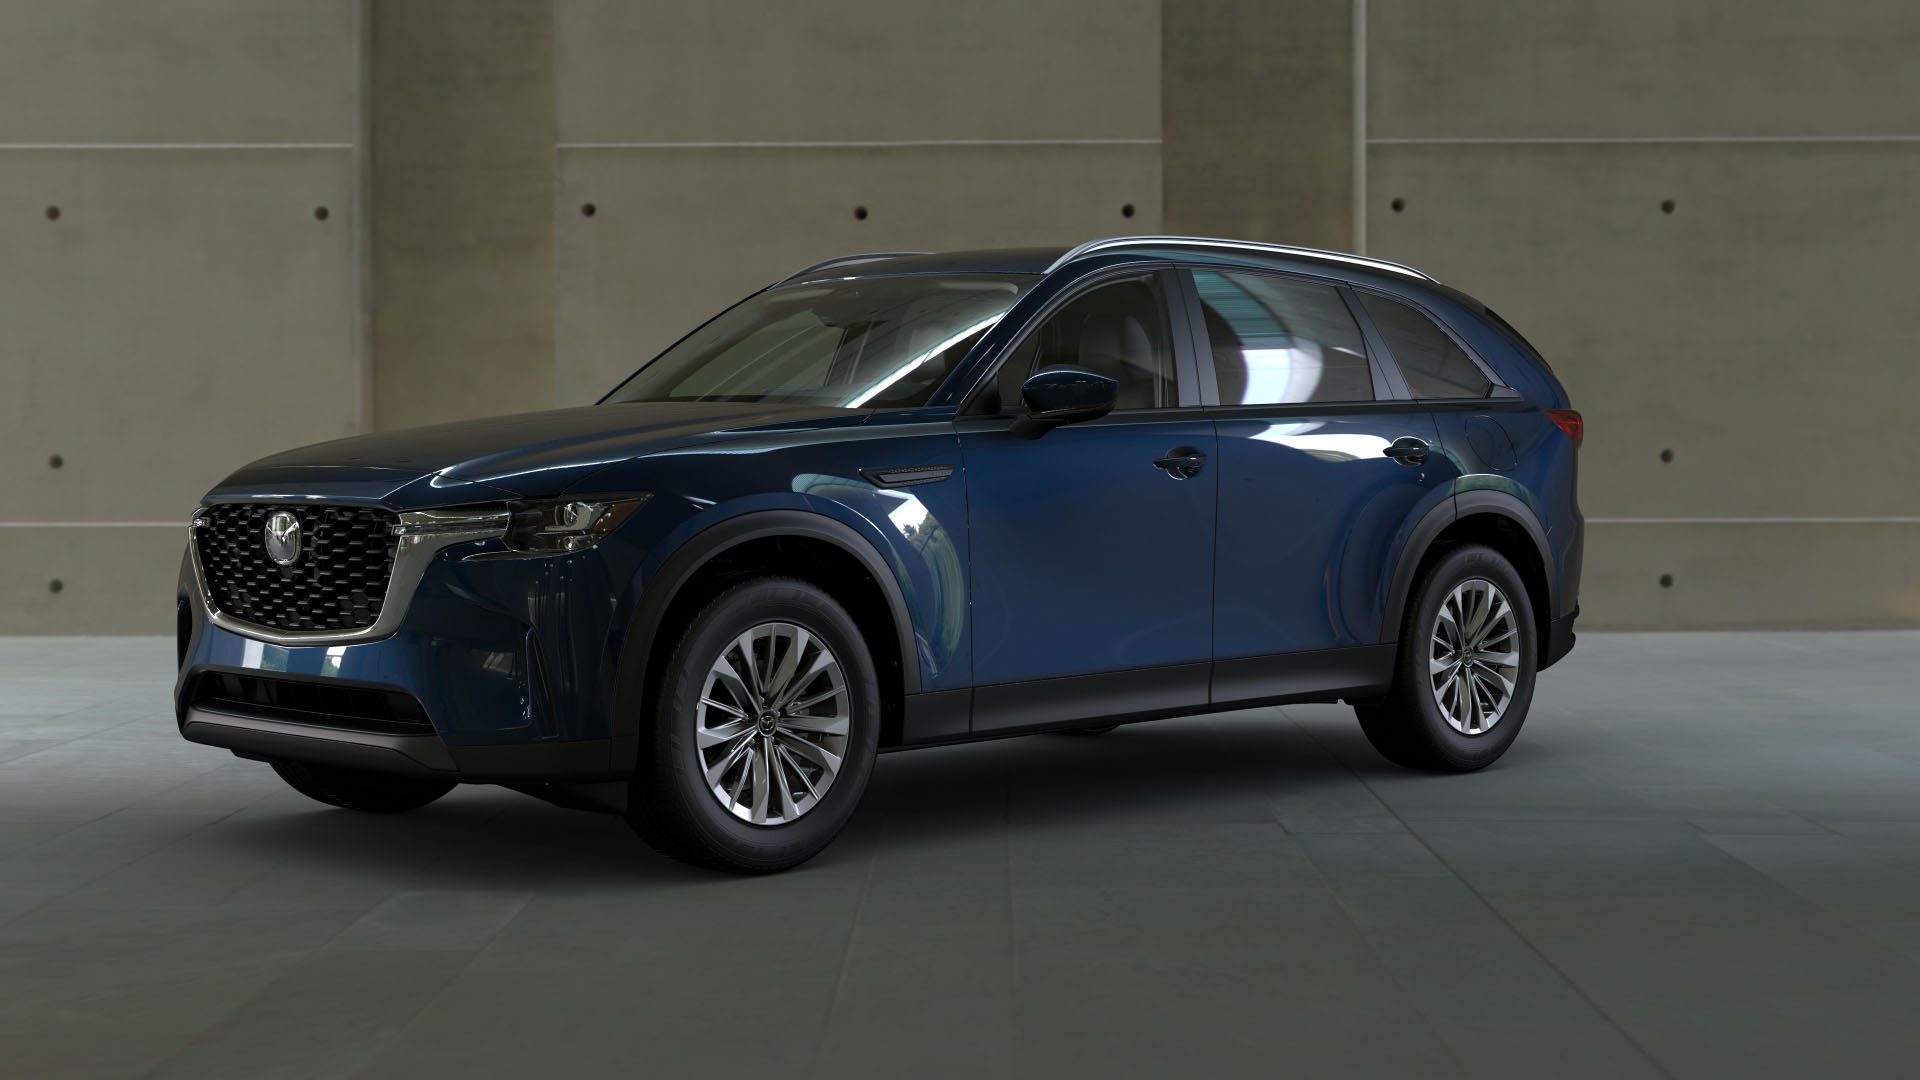
Mazda CX-50
Starting at $30,300
The 2023 Mazda CX-50 is a new midsize SUV that is designed to be more rugged and off-road capable than the CX-5. It is offered in four trim levels: 2.5 S, 2.5 S Select, 2.5 Turbo Premium, and 2.5 Turbo Premium Plus. The base 2.5 S is powered by a 2.5-liter four-cylinder engine that produces 187 horsepower and 186 lb-ft of torque. It is paired with a six-speed automatic transmission and standard all-wheel drive. The 2.5 Turbo Premium and 2.5 Turbo Premium Plus models are powered by a turbocharged 2.5-liter four-cylinder engine that produces 256 horsepower and 320 lb-ft of torque. They are also equipped with a six-speed automatic transmission and standard all-wheel drive. Overall, the 2023 Mazda CX-50 is a great choice for those looking for a stylish and capable SUV that can handle light off-road driving. It offers a good balance of performance, fuel economy, and features.
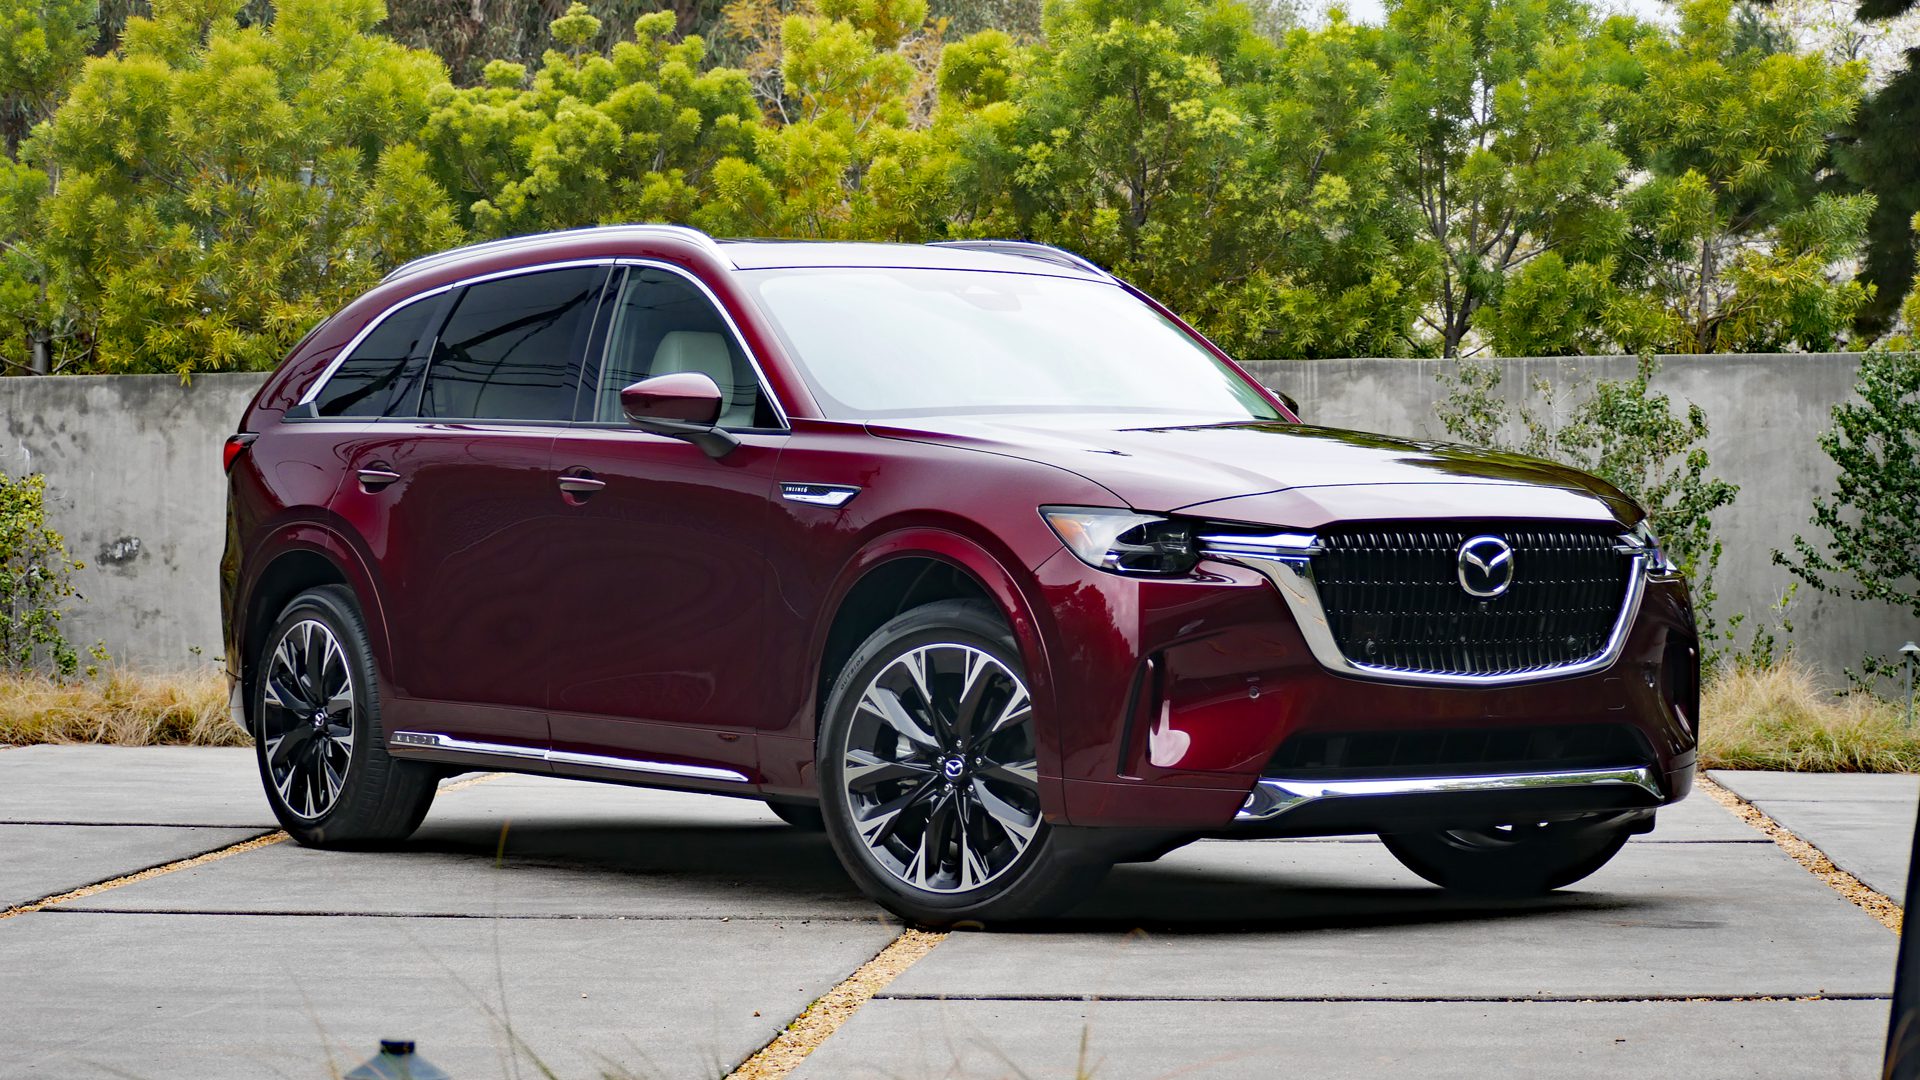
Mazda CX-90
Starting at $39,595
The 2023 Mazda CX-90 is not yet available, but it is expected to be released in the fall of 2023. It will be a new three-row luxury SUV that will replace the Mazda CX-9. The CX-90 will be powered by a new 3.3-liter turbocharged inline-six-cylinder engine that produces 335 horsepower and 369 lb-ft of torque. It will be paired with a 10-speed automatic transmission and standard all-wheel drive. The CX-90 is expected to start at around $40,000. It will compete with other luxury three-row SUVs like the Lexus GX, Lincoln Aviator, and BMW X7.
Mazda CX-90 PHEV
Starting at $47,4455
The 2024 Mazda CX-90 PHEV is a plug-in hybrid version of the upcoming 2023 Mazda CX-90. It is powered by a 2.5-liter four-cylinder engine and an electric motor that produce a combined output of 323 horsepower. It has an electric-only range of 26 miles and a total gas-electric range of 490 miles. The CX-90 PHEV will be available in two trim levels: Premium Plus and Signature. The Premium Plus starts at $47,445, and the Signature starts at $52,445.
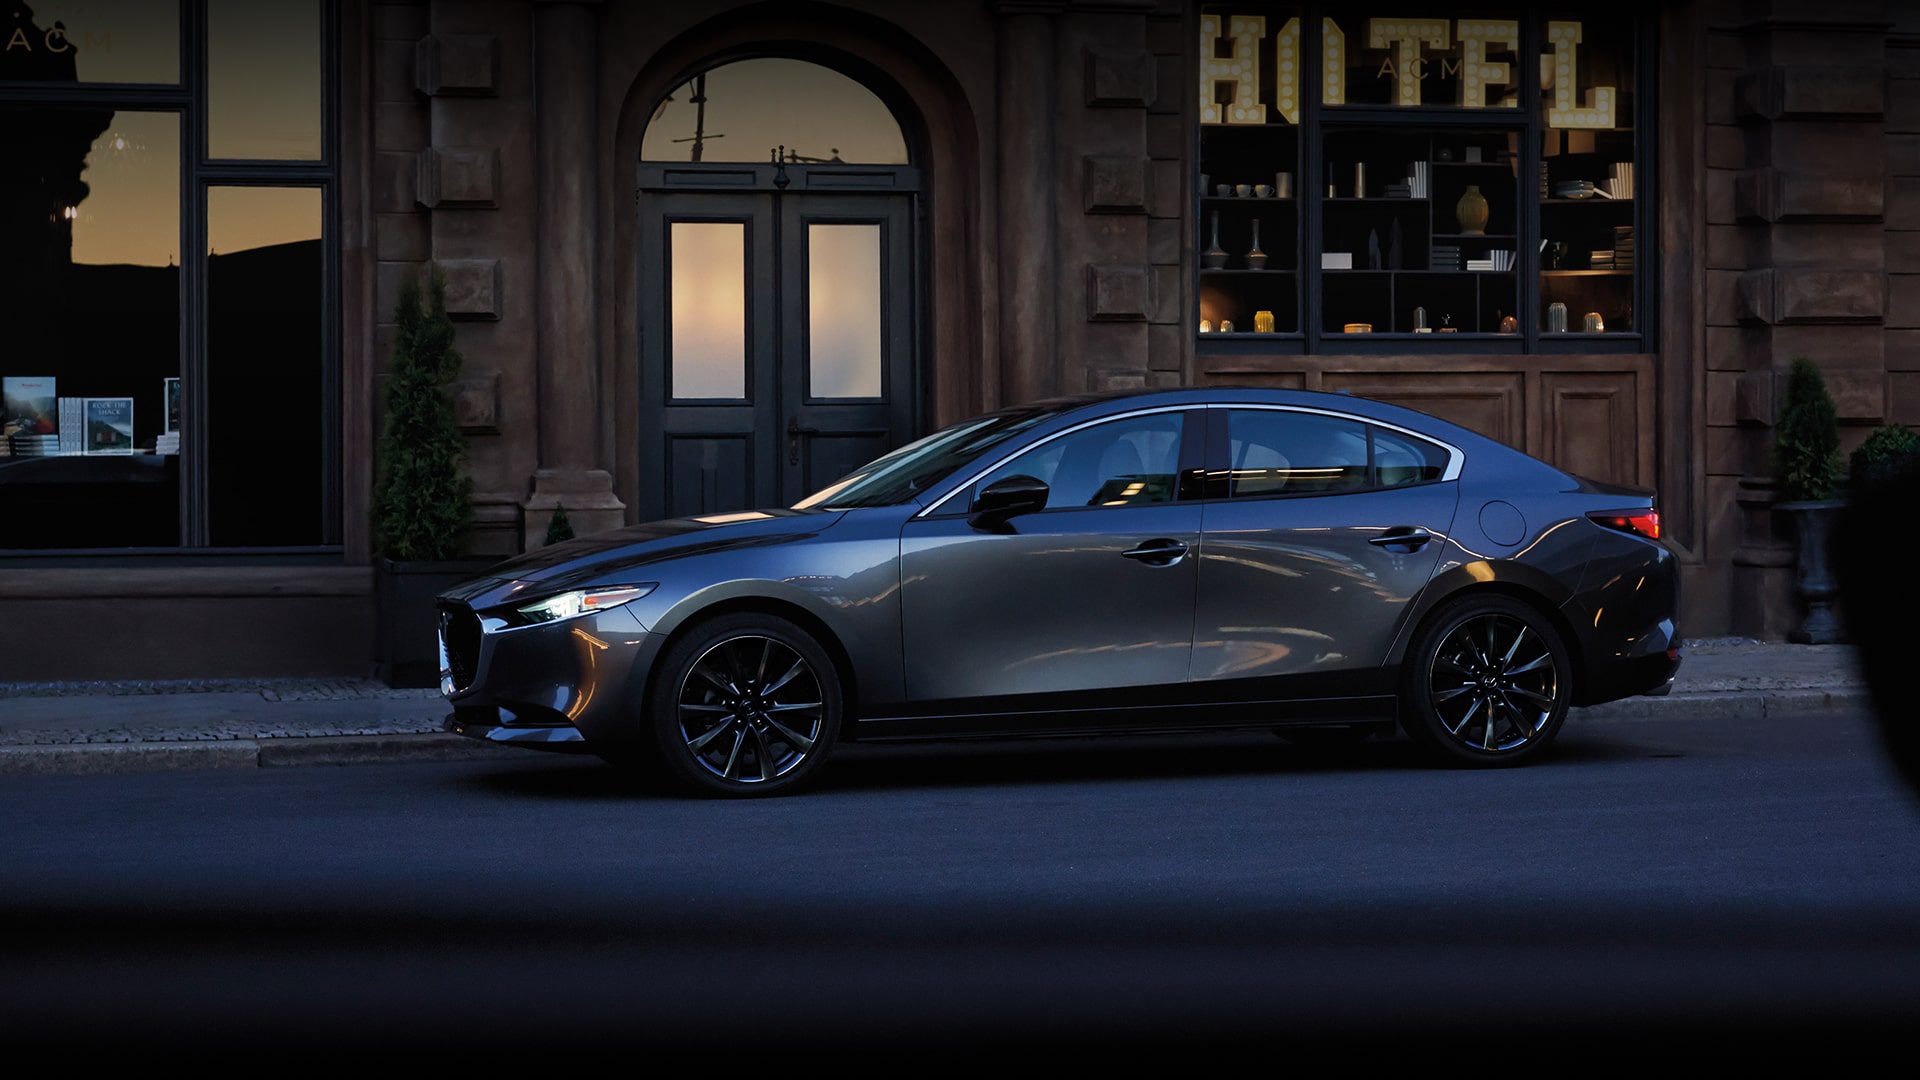
Mazda 3 Sedan / Hatchback
Starting at $24,1706 / Hatchback Starting at $25,6906
The Mazda3 is a compact car that is available in both sedan and hatchback body styles. It is known for its stylish design, fun-to-drive handling, and fuel-efficient engines. The Mazda3 is offered in a variety of trim levels, including the base Sport, the mid-level Select, the luxury-oriented Preferred, the sporty Carbon Edition, and the top-of-the-line Premium. The Mazda3 is powered by a 2.5-liter four-cylinder engine that produces 186 horsepower and 186 lb-ft of torque. It is paired with a six-speed automatic transmission. The Mazda3 gets an EPA-estimated 28 mpg in the city and 37 mpg on the highway. The Mazda3 is a great choice for those looking for a stylish, fun-to-drive, and fuel-efficient compact car. It is also a good option for those who want a car with a lot of standard features.
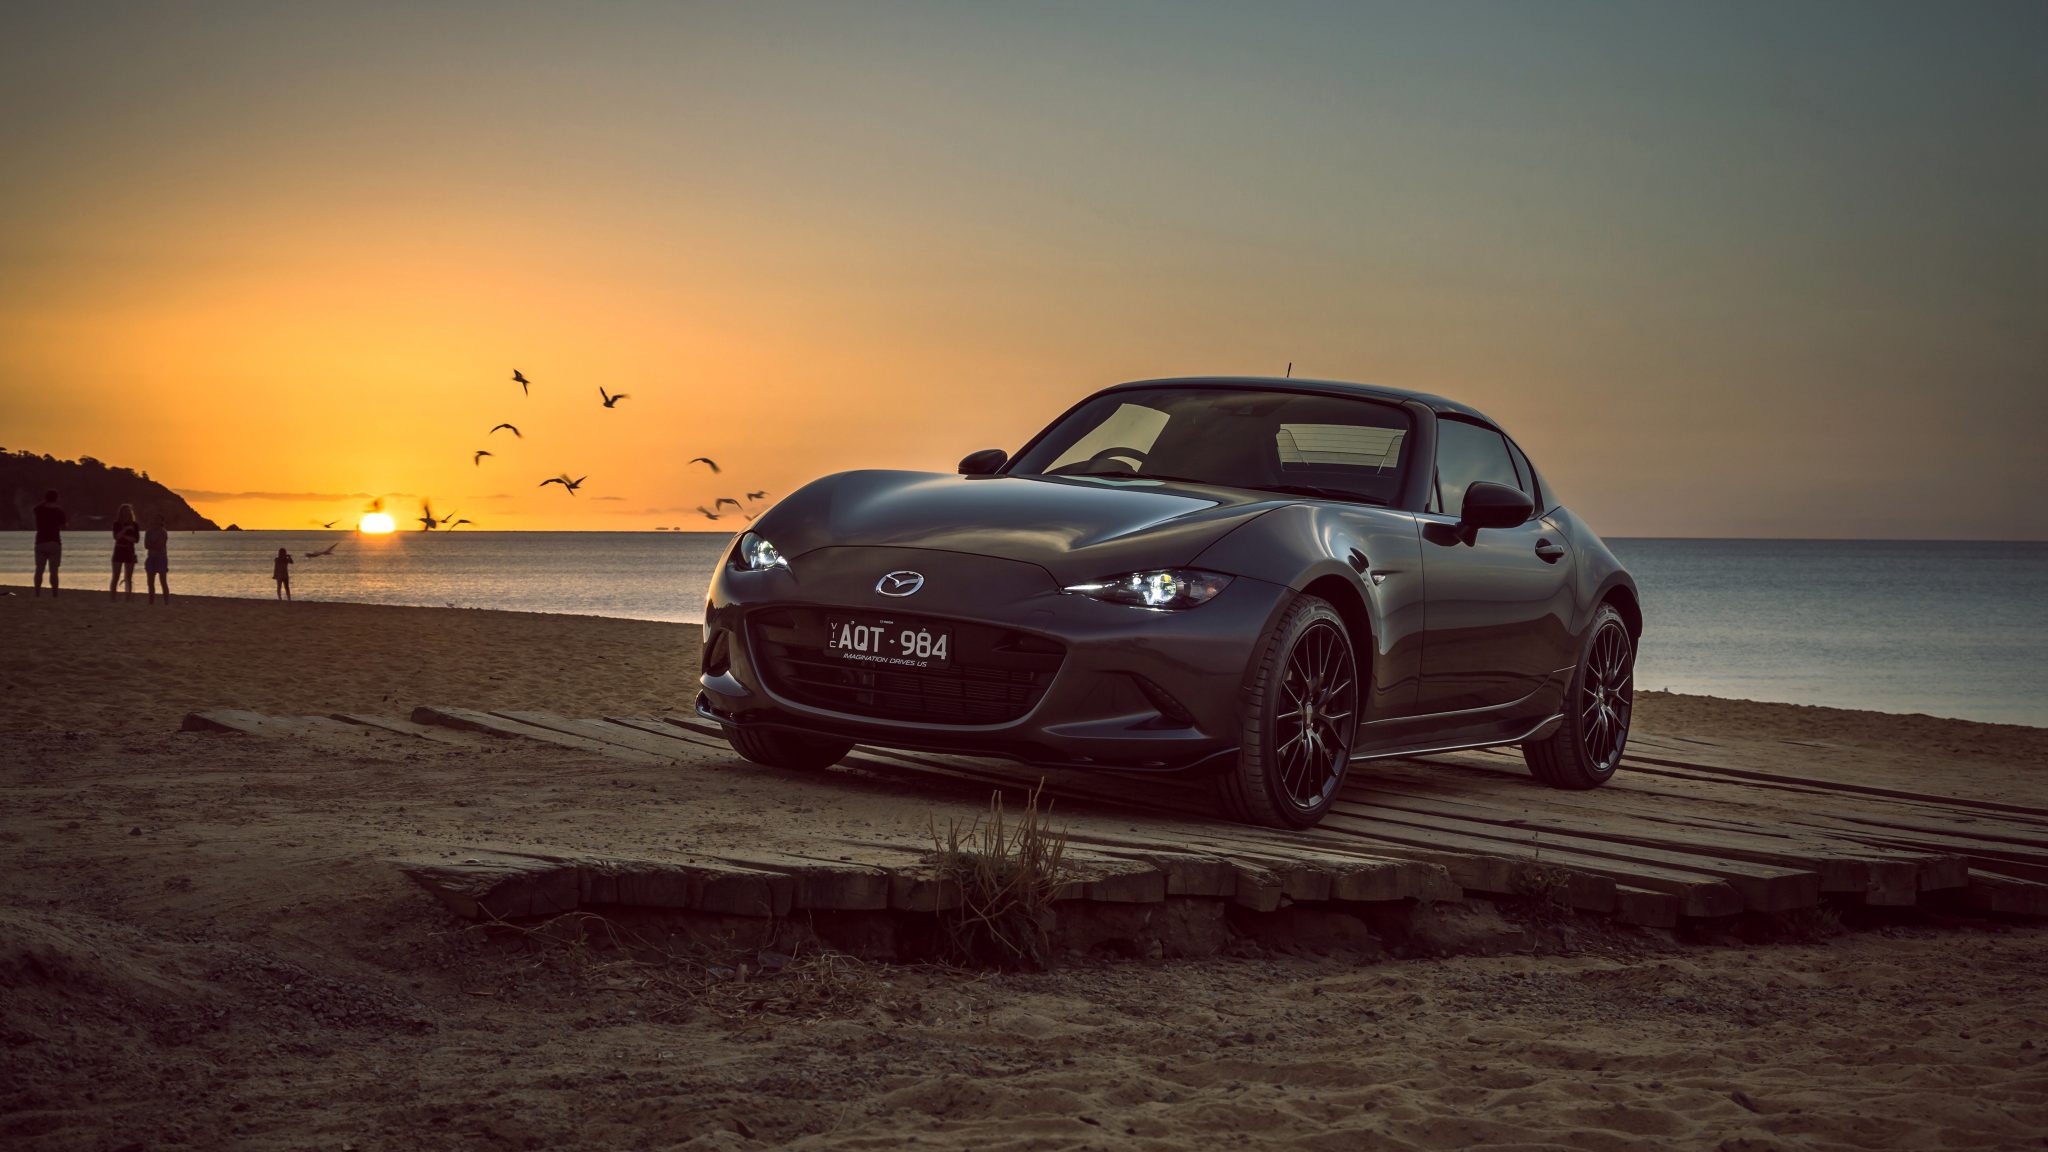
Mazda MX-5 Miata / Miata RF
Starting at $28,050 / RF Starting at $35,750
The 2023 Mazda MX-5 Miata is a two-seat convertible sports car that is known for its lightweight design, playful handling, and engaging driving experience. It is available in both soft-top and RF (Retractable Fastback) body styles. The MX-5 Miata is powered by a 2.0-liter four-cylinder engine that produces 181 horsepower and 151 lb-ft of torque. It is paired with a six-speed manual transmission or a six-speed automatic transmission. The MX-5 Miata is a great choice for those looking for a fun-to-drive, lightweight, and stylish convertible sports car. It is also a good option for those who want a car with a manual transmission.
Sources: Manufacturers, ANDC, JATO Dynamics.


sales in canada are declining while sales in the us are climbing
thats an astute observation