
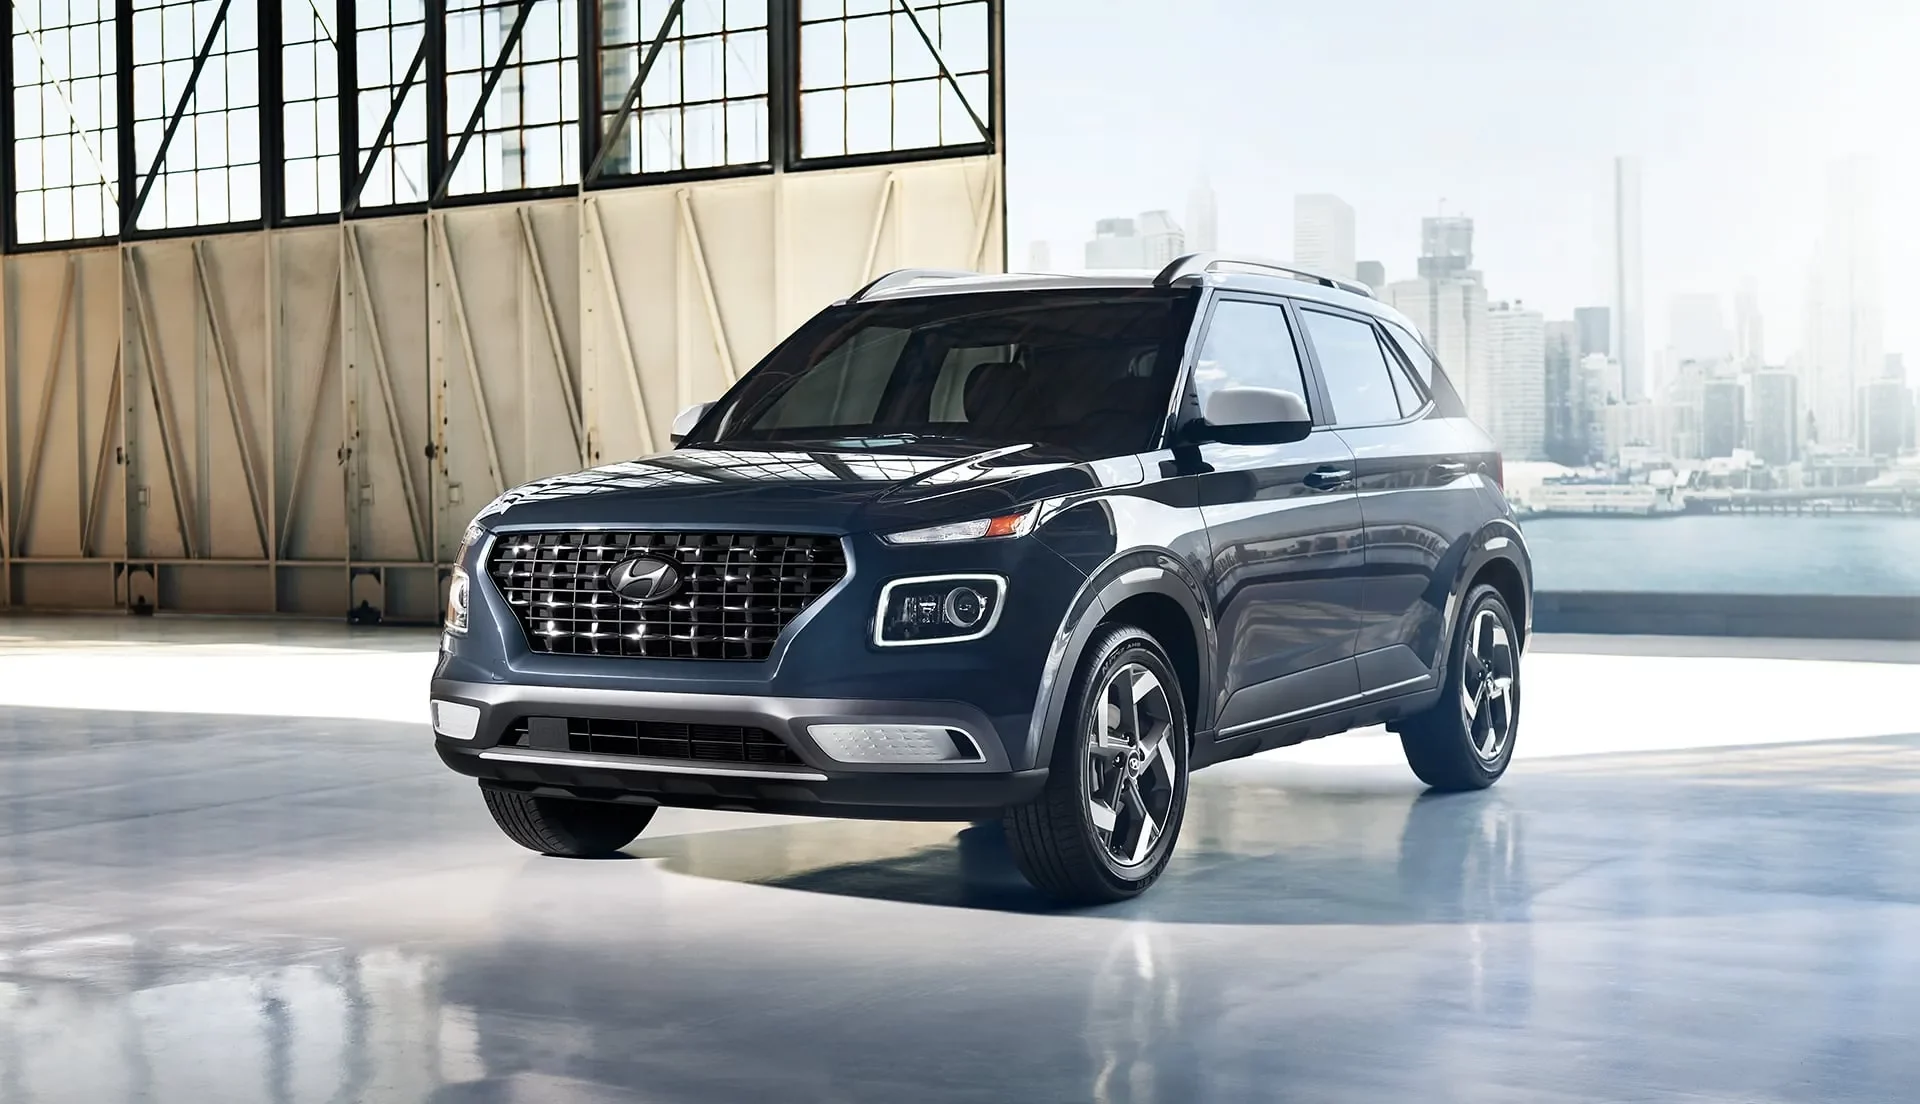
Hyundai Venue
Here you will find monthly and yearly United States and Canadian sales figures for the Hyundai Venue. The Venue is the entry point to Hyundai’s crossover lineup, a front-wheel-drive small SUV positioned below the Hyundai Kona that reached North America late in 2019. It remains in the lineup for the 2026 model year as a carry-over model, with the Limited trim dropped and a two-tone-roof version of the SEL added.
- Class: Small SUV; Hyundai markets it as a compact SUV and the EPA classes it as a small sport utility vehicle
- Current engine: 1.6-liter Smartstream four-cylinder rated 121 horsepower and 113 lb-ft of torque
- Transmission: Intelligent Variable Transmission, Hyundai’s continuously variable automatic
- Drivetrain: Front-wheel drive only, with no all-wheel drive offered on any trim
- Trims: SE, SEL and SEL with two-tone roof in the United States; Essential, Preferred and Ultimate in Canada
- Efficiency: 29 mpg city, 33 mpg highway and 31 mpg combined
- Chief rivals: Nissan Kicks, Chevrolet Trax, Kia Soul, Toyota Corolla Cross
Hyundai lists the Venue with five seats, 18.7 cubic feet of cargo space behind the rear seat and 31.9 cubic feet with the seat folded.
Hyundai Venue Sales in the United States
Hyundai launched the Venue in the United States in November 2019, so the 1,077 units logged that year cover just two months of selling. Volume built quickly from there, to 17,587 in 2020 and 20,669 in 2021, although both of those annual totals sit low because the dataset is missing June 2020 and April, July and November 2021. The Venue then posted 27,094 units in 2022 and 28,009 in 2023 before easing to 24,607 in 2024. 2025 was the best year the nameplate has recorded here, 29,805 units and a gain of about 21 percent, including a May that reached 4,349, the strongest single month in the series. Through June 2026 Hyundai has delivered 15,625 Venues, marginally ahead of the 15,463 sold over the same six months of 2025.
Hyundai Venue, United States calendar-year unit sales, 2019–2026. 2026 is January–Sep (partial).
Annual sales
| Year | Units | YoY |
|---|---|---|
| 2019 | 1,077 | — |
| 2020 | 17,587 | ▲ 1,533.0% |
| 2021 | 20,669 | ▲ 17.5% |
| 2022 | 27,094 | ▲ 31.1% |
| 2023 | 28,009 | ▲ 3.4% |
| 2024 | 24,607 | ▼ 12.1% |
| 2025 | 29,805 | ▲ 21.1% |
| 2026 (Jan–Sep) | 24,307 | ▲ 2.4% YTD |
Monthly sales
| Year | Jan | Feb | Mar | Apr | May | Jun | Jul | Aug | Sep | Oct | Nov | Dec | Total |
|---|---|---|---|---|---|---|---|---|---|---|---|---|---|
| 2019 | — | — | — | — | — | — | — | — | — | — | 290 | 787 | 1,077 |
| 2020 | 989 | 1,226 | 951 | 817 | 1,650 | — | 1,620 | 1,644 | 1,529 | 1,557 | 2,965 | 2,639 | 17,587 |
| 2021 | 1,347 | 1,869 | 2,568 | — | 3,615 | 3,033 | — | 1,768 | 1,768 | 2,255 | — | 2,446 | 20,669 |
| 2022 | 2,290 | 2,176 | 2,083 | 1,782 | 2,332 | 1,988 | 1,895 | 2,952 | 2,107 | 1,465 | 2,617 | 3,407 | 27,094 |
| 2023 | 2,441 | 2,537 | 3,625 | 2,648 | 2,413 | 2,695 | 2,581 | 2,197 | 1,732 | 1,757 | 1,716 | 1,667 | 28,009 |
| 2024 | 1,435 | 1,959 | 2,538 | 2,401 | 2,494 | 2,544 | 2,400 | 2,470 | 1,602 | 1,444 | 1,521 | 1,799 | 24,607 |
| 2025 | 1,600 | 1,829 | 2,634 | 2,467 | 4,349 | 2,584 | 2,567 | 2,862 | 2,836 | 2,156 | 2,059 | 1,862 | 29,805 |
| 2026 | 1,767 | 1,897 | 3,097 | 2,610 | 3,159 | 3,095 | 2,879 | 2,639 | 3,164 | — | — | — | 24,307 |
Hyundai Venue Sales in Canada
Canada takes an unusually large share of Venue volume for a vehicle of this size, routinely close to half the American total. After 313 units in the closing months of 2019 the Venue jumped to 8,706 in 2020 and 11,548 in 2021, then held between 11,300 and 13,600 through 2024. 2025 set the Canadian record at 14,629 units, up roughly 29 percent year over year, with every month from April through September clearing 1,400. The nameplate has stayed ahead of that pace in 2026, recording 7,941 sales through June against 7,517 a year earlier, and June 2026 was itself the single best month in the Canadian series at 1,921 units.
Hyundai Venue, Canada calendar-year unit sales, 2019–2026. 2026 is January–Sep (partial).
Annual sales
| Year | Units | YoY |
|---|---|---|
| 2019 | 313 | — |
| 2020 | 8,706 | ▲ 2,681.5% |
| 2021 | 11,548 | ▲ 32.6% |
| 2022 | 11,944 | ▲ 3.4% |
| 2023 | 13,592 | ▲ 13.8% |
| 2024 | 11,323 | ▼ 16.7% |
| 2025 | 14,629 | ▲ 29.2% |
| 2026 (Jan–Sep) | 11,998 | ▲ 1.2% YTD |
Monthly sales
| Year | Jan | Feb | Mar | Apr | May | Jun | Jul | Aug | Sep | Oct | Nov | Dec | Total |
|---|---|---|---|---|---|---|---|---|---|---|---|---|---|
| 2019 | 0 | 0 | 0 | 0 | 0 | 0 | 0 | 0 | 0 | 112 | 97 | 104 | 313 |
| 2020 | 497 | 452 | 499 | 541 | 491 | 542 | 1,014 | 967 | 969 | 939 | 854 | 941 | 8,706 |
| 2021 | 641 | 641 | 739 | 1,210 | 1,100 | 1,212 | 1,070 | 1,121 | 1,072 | 899 | 899 | 944 | 11,548 |
| 2022 | 831 | 791 | 911 | 1,120 | 1,120 | 1,176 | 975 | 1,121 | 1,024 | 958 | 958 | 959 | 11,944 |
| 2023 | 909 | 827 | 952 | 1,012 | 1,113 | 1,114 | 1,150 | 1,322 | 1,151 | 1,411 | 1,347 | 1,284 | 13,592 |
| 2024 | 926 | 884 | 886 | 1,035 | 1,035 | 942 | 950 | 950 | 866 | 1,023 | 890 | 936 | 11,323 |
| 2025 | 959 | 872 | 916 | 1,639 | 1,565 | 1,566 | 1,492 | 1,425 | 1,426 | 995 | 822 | 952 | 14,629 |
| 2026 | 858 | 808 | 1,352 | 1,352 | 1,650 | 1,921 | 1,741 | 1,359 | 957 | — | — | — | 11,998 |







