
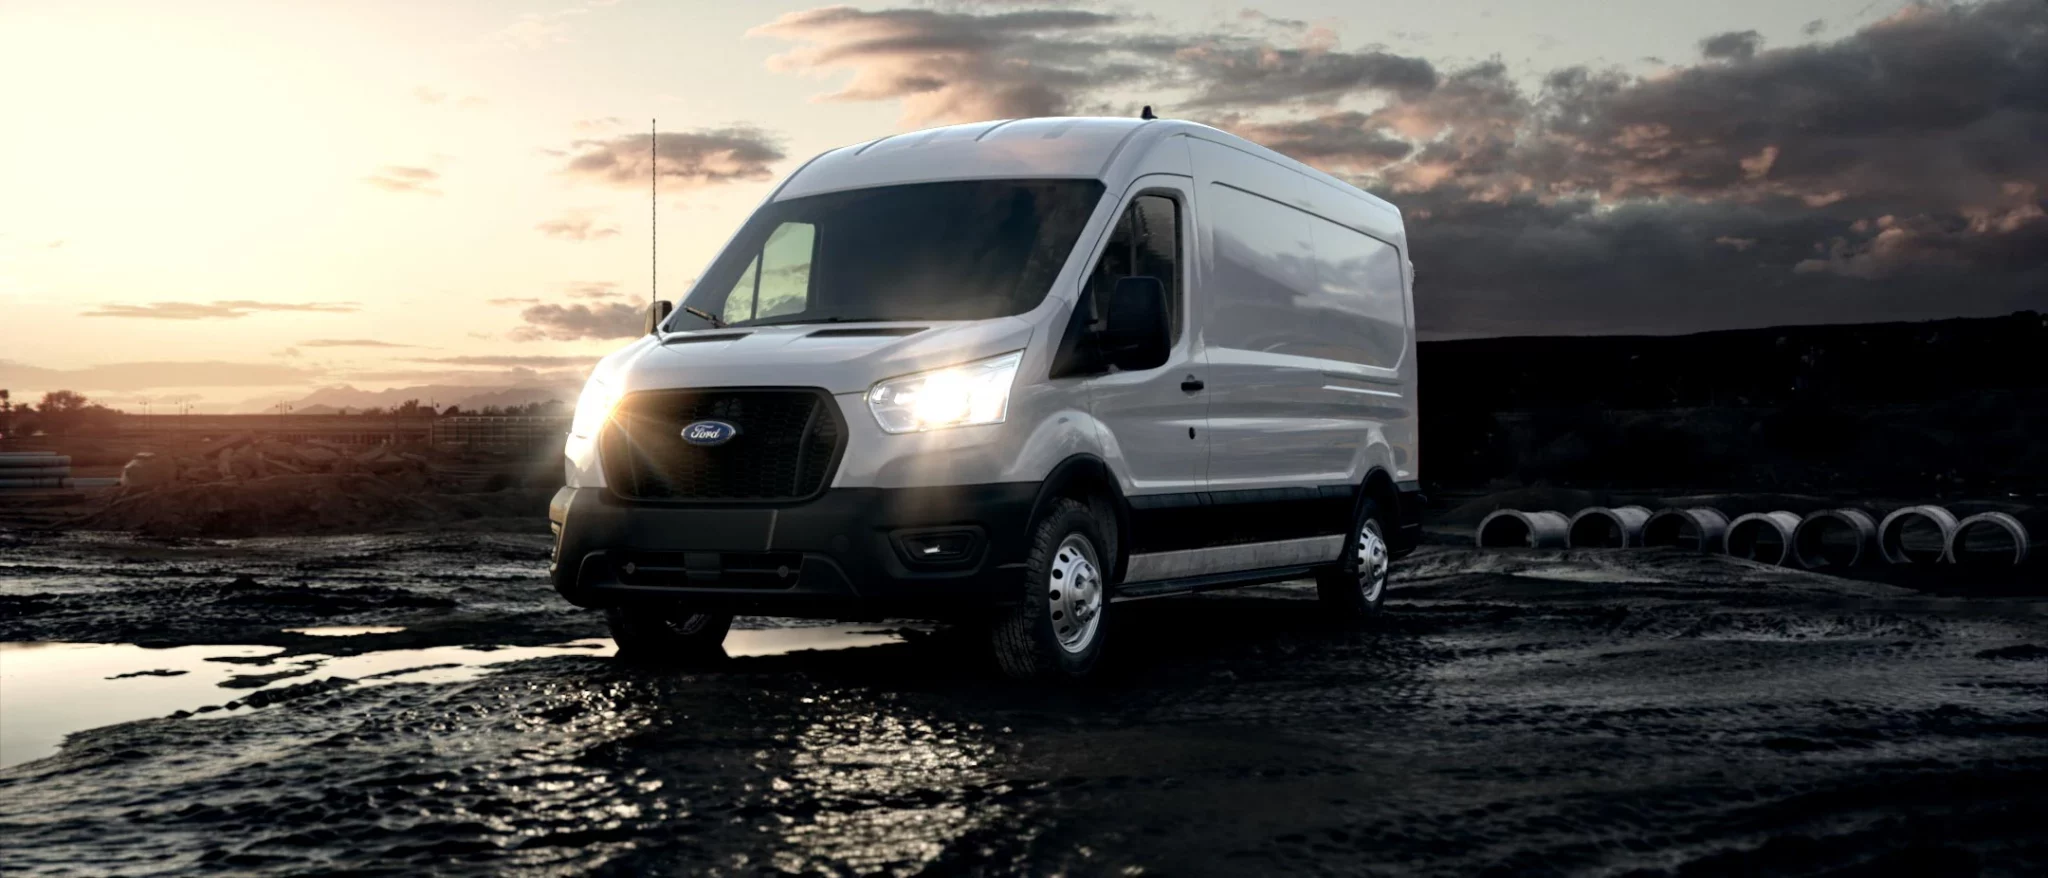
Ford E-Series
Here you will find monthly and yearly United States and Canadian sales figures for the Ford E-Series. First sold as the Ford Econoline, the E-Series is Ford’s long-running full-size van line, in production since 1961. After the Transit took over Ford’s passenger and cargo van duties in North America in 2015, the E-Series has continued primarily as cutaway and stripped-chassis models, the E-350 and E-450, that serve as the foundation for shuttle buses, box trucks, ambulances, and recreational vehicles.
- Class: Full-size commercial van, sold as cutaway and stripped-chassis models
- Chassis models: E-350 (single or dual rear wheels) and E-450 (dual rear wheels)
- Engine: 7.3L V8 gasoline, 325 hp and 450 lb-ft of torque
- Transmission: Six-speed TorqShift automatic
- Drivetrain: Rear-wheel drive
- Typical uses: Shuttle buses, box and delivery trucks, ambulances, and recreational-vehicle chassis
- Chief rivals: Chevrolet Express Cutaway, GMC Savana Cutaway, Ram ProMaster Chassis Cab
The E-Series is built as an incomplete cutaway or stripped chassis for commercial upfitting rather than as a finished passenger or cargo van; the Transit fills that role in Ford’s North American lineup.
Ford E-Series Sales in the United States
Ford E-Series sales in the United States reflect that change in mission. Through the mid-2000s the Econoline was a volume leader, moving 148,738 units as recently as 2005 when it still served as a mainstream passenger and cargo van. Deliveries fell through the 2010s as the Transit took over those roles, easing from roughly 50,500 units in 2015 to a low of 32,150 in 2022. The nameplate then stabilized in its commercial-chassis form, recovering to 42,957 in 2023 and 43,563 in 2024 before easing to 40,968 in 2025. Through June 2026 Ford had delivered 18,229 E-Series units, tracking slightly behind the 19,464 recorded over the same period of 2025.
Ford E-Series, United States calendar-year unit sales, 2005–2026. 2026 is January–Sep (partial).
Annual sales
| Year | Units | YoY |
|---|---|---|
| 2005 | 148,738 | — |
| 2006 | 148,043 | ▼ 0.5% |
| 2007 | 136,749 | ▼ 7.6% |
| 2008 | 97,919 | ▼ 28.4% |
| 2009 | 64,787 | ▼ 33.8% |
| 2010 | 84,459 | ▲ 30.4% |
| 2011 | 91,305 | ▲ 8.1% |
| 2012 | 98,649 | ▲ 8.0% |
| 2013 | 102,705 | ▲ 4.1% |
| 2014 | 88,896 | ▼ 13.4% |
| 2015 | 50,541 | ▼ 43.1% |
| 2016 | 54,245 | ▲ 7.3% |
| 2017 | 53,304 | ▼ 1.7% |
| 2018 | 47,936 | ▼ 10.1% |
| 2019 | 45,063 | ▼ 6.0% |
| 2020 | 37,001 | ▼ 17.9% |
| 2021 | 37,122 | ▲ 0.3% |
| 2022 | 32,150 | ▼ 13.4% |
| 2023 | 42,957 | ▲ 33.6% |
| 2024 | 40,778 | ▼ 5.1% |
| 2025 | 40,968 | ▲ 0.5% |
| 2026 (Jan–Sep) | 27,474 | ▼ 9.0% YTD |
Monthly sales
| Year | Jan | Feb | Mar | Apr | May | Jun | Jul | Aug | Sep | Oct | Nov | Dec | Total |
|---|---|---|---|---|---|---|---|---|---|---|---|---|---|
| 2005 | 9,429 | 11,158 | 12,989 | 13,858 | 13,478 | 13,016 | 11,022 | 12,187 | 12,603 | 12,134 | 15,034 | 11,830 | 148,738 |
| 2006 | 8,465 | 11,457 | 13,677 | 14,163 | 12,931 | 11,916 | 11,073 | 13,372 | 11,406 | 15,992 | 10,379 | 13,212 | 148,043 |
| 2007 | 10,911 | 11,601 | 15,541 | 11,777 | 14,691 | 10,788 | 9,159 | 11,383 | 10,090 | 10,076 | 9,262 | 11,470 | 136,749 |
| 2008 | 9,051 | 10,001 | 9,548 | 9,691 | 9,775 | 8,014 | 9,807 | 7,639 | 5,835 | 6,498 | 5,352 | 6,708 | 97,919 |
| 2009 | 4,810 | 4,690 | 5,692 | 5,812 | 5,825 | 6,557 | 6,636 | 4,624 | 5,072 | 4,723 | 3,702 | 6,644 | 64,787 |
| 2010 | 4,744 | 5,541 | 7,231 | 7,358 | 7,502 | 7,826 | 7,779 | 9,014 | 6,709 | 5,910 | 6,437 | 8,408 | 84,459 |
| 2011 | 6,139 | 6,824 | 8,971 | 9,052 | 8,386 | 7,952 | 7,309 | 7,915 | 6,639 | 5,688 | 6,013 | 10,417 | 91,305 |
| 2012 | 6,024 | 7,538 | 9,915 | 8,071 | 10,550 | 9,743 | 7,488 | 8,210 | 6,857 | 7,092 | 7,188 | 9,973 | 98,649 |
| 2013 | 6,901 | 6,488 | 9,082 | 9,376 | 9,412 | 10,801 | 8,856 | 7,801 | 7,649 | 7,795 | 8,082 | 10,462 | 102,705 |
| 2014 | 6,274 | 7,136 | 9,700 | 10,584 | 10,497 | 10,135 | 9,040 | 6,356 | 5,366 | 4,624 | 4,072 | 5,112 | 88,896 |
| 2015 | 3,249 | 4,371 | 6,192 | 4,753 | 4,355 | 4,799 | 3,337 | 3,822 | 3,980 | 4,034 | 3,927 | 3,722 | 50,541 |
| 2016 | 2,959 | 3,873 | 5,816 | 5,530 | 3,985 | 5,232 | 4,011 | 4,716 | 4,073 | 4,592 | 4,705 | 4,753 | 54,245 |
| 2017 | 3,290 | 4,016 | 4,769 | 5,199 | 5,389 | 4,951 | 3,316 | 4,894 | 4,810 | 4,265 | 4,494 | 3,911 | 53,304 |
| 2018 | 5,105 | 3,604 | 5,184 | 3,981 | 3,907 | 3,724 | 3,713 | 4,020 | 3,311 | 3,901 | 4,337 | 3,149 | 47,936 |
| 2019 | 3,550 | 3,408 | 3,834 | 3,757 | 4,335 | 3,468 | 3,248 | 3,638 | 2,988 | 4,227 | 4,383 | 4,227 | 45,063 |
| 2020 | 3,280 | 4,246 | 2,572 | 1,044 | 2,321 | 2,437 | 3,256 | 2,894 | 3,136 | 4,469 | 3,412 | 3,934 | 37,001 |
| 2021 | 3,036 | 3,956 | 3,581 | 2,549 | 2,086 | 2,127 | 2,468 | 3,437 | 3,227 | 4,078 | 2,771 | 3,806 | 37,122 |
| 2022 | 2,178 | 3,024 | 1,999 | 1,805 | 1,160 | 2,371 | 2,810 | 3,978 | 2,898 | 3,692 | 2,982 | 3,253 | 32,150 |
| 2023 | 2,848 | 3,514 | 4,423 | 3,183 | 2,732 | 2,820 | 4,558 | 3,613 | 2,811 | 4,218 | 4,150 | 4,087 | 42,957 |
| 2024 | 3,080 | 3,543 | 3,817 | 2,892 | 3,572 | 3,364 | 2,785 | 3,364 | 3,030 | 3,755 | 3,292 | 4,284 | 40,778 |
| 2025 | 2,939 | 2,968 | 3,772 | 3,699 | 3,379 | 2,707 | 3,576 | 3,531 | 3,624 | 4,591 | 2,974 | 3,208 | 40,968 |
| 2026 | 3,354 | 3,303 | 2,702 | 2,888 | 2,998 | 2,984 | 3,013 | 3,095 | 3,137 | — | — | — | 27,474 |
Ford E-Series Sales in Canada
In Canada the E-Series follows the same commercial pattern at lower volume. After ranging in the low thousands through the late 2010s and early 2020s, Canadian deliveries rose to 3,813 units in 2025 from 3,210 in 2024. The model has opened 2026 on a stronger note, with 1,848 units through June against 1,570 over the same months a year earlier.
Ford E-Series, Canada calendar-year unit sales, 2004–2026. 2026 is January–Jun (partial).
Annual sales
| Year | Units | YoY |
|---|---|---|
| 2004 | 14,047 | — |
| 2005 | 13,840 | ▼ 1.5% |
| 2006 | 11,932 | ▼ 13.8% |
| 2007 | 9,639 | ▼ 19.2% |
| 2008 | 8,383 | ▼ 13.0% |
| 2009 | 5,962 | ▼ 28.9% |
| 2010 | 9,041 | ▲ 51.6% |
| 2011 | 8,971 | ▼ 0.8% |
| 2012 | 9,342 | ▲ 4.1% |
| 2013 | 7,874 | ▼ 15.7% |
| 2014 | 7,667 | ▼ 2.6% |
| 2015 | 2,661 | ▼ 65.3% |
| 2016 | 3,478 | ▲ 30.7% |
| 2017 | 3,539 | ▲ 1.8% |
| 2018 | 4,244 | ▲ 19.9% |
| 2019 | 4,607 | ▲ 8.6% |
| 2020 | 3,047 | ▼ 33.9% |
| 2021 | 3,336 | ▲ 9.5% |
| 2022 | 3,562 | ▲ 6.8% |
| 2023 | 3,058 | ▼ 14.1% |
| 2024 | 3,210 | ▲ 5.0% |
| 2025 | 3,813 | ▲ 18.8% |
| 2026 (Jan–Jun) | 1,848 | ▲ 17.7% YTD |
Monthly sales
| Year | Jan | Feb | Mar | Apr | May | Jun | Jul | Aug | Sep | Oct | Nov | Dec | Total |
|---|---|---|---|---|---|---|---|---|---|---|---|---|---|
| 2004 | 565 | 932 | 1,272 | 1,750 | 1,814 | 1,399 | 1,155 | 1,381 | 858 | 921 | 1,033 | 967 | 14,047 |
| 2005 | 710 | 1,083 | 1,393 | 1,438 | 1,589 | 1,302 | 1,428 | 1,072 | 800 | 921 | 1,107 | 997 | 13,840 |
| 2006 | 368 | 824 | 1,008 | 1,043 | 1,327 | 1,330 | 1,525 | 958 | 1,066 | 1,032 | 692 | 759 | 11,932 |
| 2007 | 484 | 731 | 940 | 828 | 843 | 944 | 739 | 1,155 | 840 | 779 | 493 | 863 | 9,639 |
| 2008 | 805 | 593 | 682 | 792 | 1,002 | 863 | 754 | 429 | 453 | 746 | 535 | 729 | 8,383 |
| 2009 | 377 | 407 | 509 | 817 | 577 | 607 | 472 | 379 | 360 | 439 | 369 | 649 | 5,962 |
| 2010 | 433 | 644 | 1,023 | 1,174 | 1,207 | 694 | 657 | 540 | 1,101 | 625 | 464 | 479 | 9,041 |
| 2011 | 521 | 512 | 618 | 1,372 | 1,148 | 955 | 628 | 437 | 834 | 471 | 592 | 883 | 8,971 |
| 2012 | 402 | 644 | 776 | 1,073 | 1,434 | 1,361 | 961 | 763 | 547 | 445 | 448 | 488 | 9,342 |
| 2013 | 413 | 468 | 921 | 1,004 | 1,386 | 1,065 | 863 | 447 | 360 | 418 | 209 | 320 | 7,874 |
| 2014 | 349 | 566 | 717 | 1,077 | 1,086 | 1,116 | 1,037 | 730 | 217 | 263 | 204 | 305 | 7,667 |
| 2015 | 109 | 201 | 226 | 461 | 353 | 281 | 118 | 153 | 122 | 157 | 222 | 258 | 2,661 |
| 2016 | 244 | 258 | 571 | 619 | 484 | 252 | 190 | 151 | 194 | 171 | 154 | 190 | 3,478 |
| 2017 | 204 | 287 | 825 | 420 | 276 | 157 | 185 | 222 | 149 | 115 | 339 | 360 | 3,539 |
| 2018 | 267 | 492 | 649 | 344 | 326 | 373 | 367 | 283 | 268 | 226 | 421 | 228 | 4,244 |
| 2019 | 396 | 360 | 378 | 608 | 608 | 554 | 320 | 320 | 291 | 277 | 241 | 254 | 4,607 |
| 2020 | 380 | 345 | 381 | 168 | 153 | 169 | 239 | 228 | 230 | 259 | 235 | 260 | 3,047 |
| 2021 | 216 | 216 | 250 | 334 | 303 | 335 | 284 | 298 | 285 | 267 | 267 | 281 | 3,336 |
| 2022 | 188 | 179 | 206 | 183 | 183 | 192 | 352 | 405 | 371 | 434 | 434 | 435 | 3,562 |
| 2023 | 204 | 186 | 215 | 275 | 302 | 304 | 256 | 294 | 258 | 266 | 254 | 244 | 3,058 |
| 2024 | 206 | 197 | 198 | 271 | 271 | 248 | 297 | 297 | 270 | 343 | 298 | 314 | 3,210 |
| 2025 | 279 | 254 | 268 | 264 | 252 | 253 | 364 | 348 | 349 | 424 | 350 | 408 | 3,813 |
| 2026 | 324 | 290 | 319 | 333 | 316 | 266 | — | — | — | — | — | — | 1,848 |








I think it is the mistake of the decade of ford when abandon their E-series!