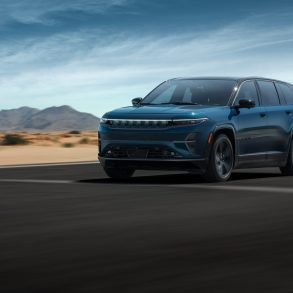
Toyota Venza
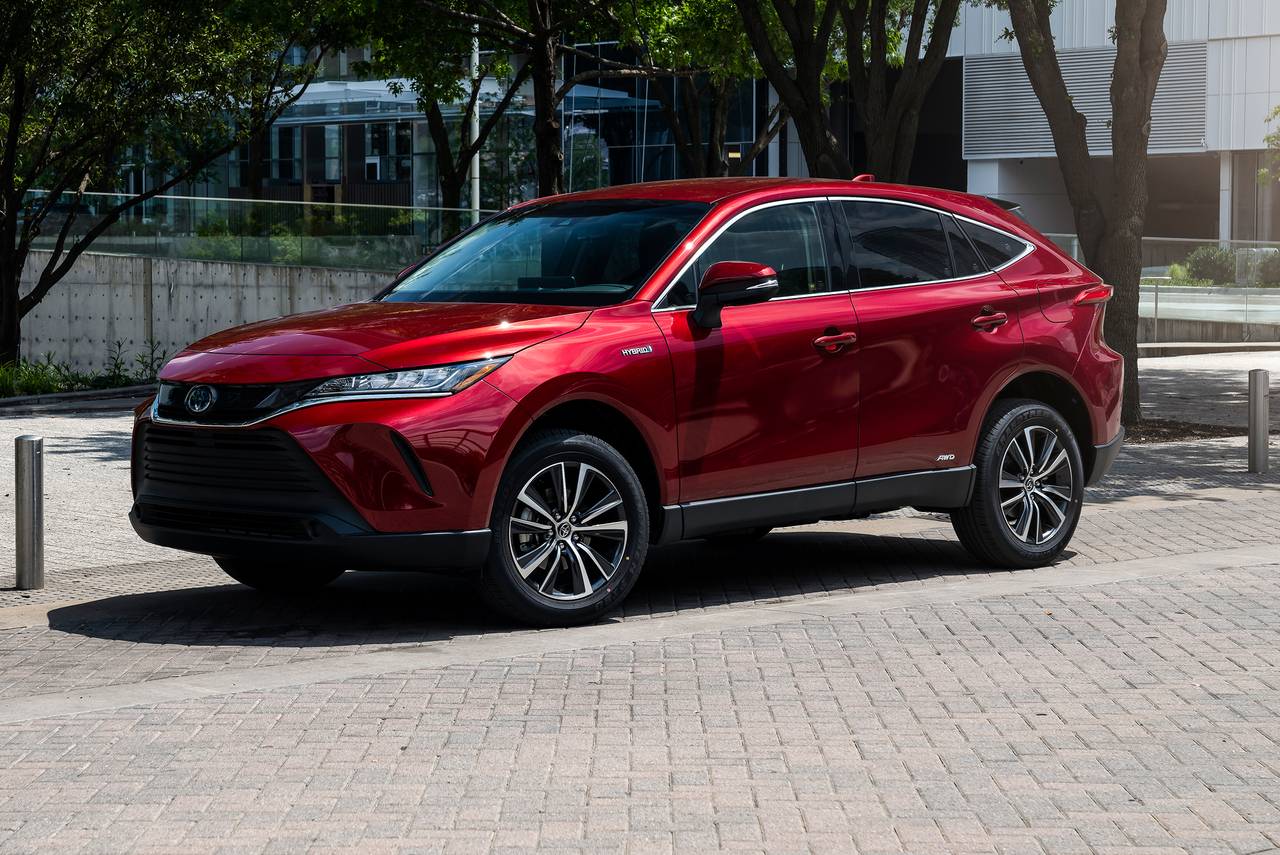
Here you will find monthly and yearly United States and Canadian sales figures for the Toyota Venza. The Venza has lived two lives. The first was a car-like crossover developed for North America and assembled in Georgetown, Kentucky, offered with four-cylinder and V6 power. The nameplate returned in the summer of 2020 as a hybrid-only midsize SUV with standard all-wheel drive, and its sales wound down again in early 2025.
- Class: Midsize two-row hybrid crossover SUV, five seats (2024 model year)
- Powertrain: 2.5L four-cylinder Toyota Hybrid System, 219 net system horsepower
- Transmission: Electronically controlled continuously variable transmission
- Drivetrain: Electronic on-demand all-wheel drive, standard
- Fuel economy: EPA 40 mpg city, 37 highway, 39 combined
- Trims: LE, XLE, Limited and Nightshade edition
- First generation (2015 model year): 2.7L four-cylinder with 181 hp and 182 lb-ft, or 3.5L V6 with 268 hp and 246 lb-ft; 6-speed automatic; front-wheel or all-wheel drive
- Chief rivals: Nissan Murano, Ford Edge, Hyundai Santa Fe Hybrid, Kia Sorento Hybrid
Toyota Venza Sales in the United States
The Venza chart for the United States begins with 1,474 sales in 2008. Its first full year, 2009, produced 54,410, with August 2009 the best month of the first generation at 8,435. Volume eased to 47,321 in 2010 and 38,904 in 2011, recovered to 43,094 in 2012, then fell each year to 21,351 in 2015. The run-out left 589 sales in 2016 and only a handful from 2017 to 2019, so there were no meaningful U.S. sales between generations. The hybrid Venza arrived in August 2020 and posted 13,073 sales by year end, then set the nameplate record of 61,718 in 2021, when May alone brought 9,318, the best month on record. Sales fell 45.4 percent to 33,683 in 2022 and 11.2 percent to 29,907 in 2023 before a 7.3 percent rise to 32,086 in 2024, a total weighted heavily toward the first half at 21,527. The run-out followed: 707 in 2025, 502 of them in January, and 12 from January to September 2026.
Toyota Venza, United States calendar-year unit sales, 2008–2026. 2026 is January–Oct (partial).
Annual sales
| Year | Units | YoY |
|---|---|---|
| 2008 | 1,474 | — |
| 2009 | 54,410 | ▲ 3,591.3% |
| 2010 | 47,321 | ▼ 13.0% |
| 2011 | 38,904 | ▼ 17.8% |
| 2012 | 43,094 | ▲ 10.8% |
| 2013 | 35,846 | ▼ 16.8% |
| 2014 | 29,991 | ▼ 16.3% |
| 2015 | 21,351 | ▼ 28.8% |
| 2016 | 589 | ▼ 97.2% |
| 2017 | 12 | ▼ 98.0% |
| 2018 | 9 | ▼ 25.0% |
| 2019 | 9 | ▲ 0.0% |
| 2020 | 13,073 | ▲ 145,155.6% |
| 2021 | 61,718 | ▲ 372.1% |
| 2022 | 33,683 | ▼ 45.4% |
| 2023 | 29,907 | ▼ 11.2% |
| 2024 | 32,086 | ▲ 7.3% |
| 2025 | 707 | ▼ 97.8% |
| 2026 (Jan–Oct) | 12 | ▼ 98.3% YTD |
Monthly sales
| Year | Jan | Feb | Mar | Apr | May | Jun | Jul | Aug | Sep | Oct | Nov | Dec | Total |
|---|---|---|---|---|---|---|---|---|---|---|---|---|---|
| 2008 | — | — | — | — | — | — | — | — | — | — | — | 1,474 | 1,474 |
| 2009 | 1,394 | 2,315 | 3,695 | 3,793 | 4,745 | 4,521 | 5,780 | 8,435 | 4,738 | 5,035 | 4,140 | 5,819 | 54,410 |
| 2010 | 3,564 | 3,414 | 5,227 | 4,854 | 4,625 | 3,512 | 4,024 | 3,644 | 3,546 | 3,551 | 3,364 | 3,996 | 47,321 |
| 2011 | 2,387 | 2,551 | 3,177 | 3,244 | 3,207 | 3,384 | 4,711 | 3,725 | 3,445 | 3,326 | 2,610 | 3,137 | 38,904 |
| 2012 | 2,460 | 2,670 | 3,503 | 3,051 | 3,608 | 4,210 | 3,995 | 3,687 | 4,229 | 3,598 | 3,660 | 4,423 | 43,094 |
| 2013 | 3,371 | 3,745 | 3,965 | 3,297 | 3,359 | 2,875 | 2,886 | 3,496 | 2,193 | 2,272 | 2,239 | 2,148 | 35,846 |
| 2014 | 1,993 | 2,472 | 3,090 | 3,053 | 3,324 | 2,322 | 2,540 | 2,793 | 1,858 | 1,896 | 2,231 | 2,419 | 29,991 |
| 2015 | 2,105 | 2,272 | 2,404 | 2,101 | 2,298 | 2,017 | 2,229 | 2,147 | 1,584 | 1,191 | 602 | 401 | 21,351 |
| 2016 | 184 | 124 | 107 | 57 | 31 | 40 | 20 | 11 | 6 | 4 | 4 | 1 | 589 |
| 2017 | 4 | 1 | 4 | 2 | — | — | — | — | 1 | — | — | — | 12 |
| 2018 | — | — | — | 0 | — | — | — | — | — | — | 1 | 8 | 9 |
| 2019 | — | — | 1 | 1 | — | — | — | 2 | 5 | — | — | — | 9 |
| 2020 | — | — | — | — | — | — | — | 43 | 1,625 | 3,510 | 3,400 | 4,495 | 13,073 |
| 2021 | 3,358 | 3,753 | 6,512 | 8,112 | 9,318 | 4,781 | 5,106 | 5,329 | 4,224 | 3,251 | 2,846 | 5,128 | 61,718 |
| 2022 | 4,464 | 3,736 | 2,636 | 2,309 | 2,975 | 2,546 | 2,064 | 1,098 | 1,303 | 3,705 | 3,923 | 2,924 | 33,683 |
| 2023 | 2,888 | 2,419 | 2,159 | 1,749 | 1,570 | 2,292 | 2,790 | 3,030 | 3,190 | 2,896 | 2,369 | 2,555 | 29,907 |
| 2024 | 2,189 | 2,424 | 3,348 | 4,416 | 5,017 | 4,133 | 3,378 | 3,137 | 1,748 | 803 | 178 | 1,315 | 32,086 |
| 2025 | 502 | 131 | 39 | 11 | 6 | 3 | 4 | 3 | 4 | 0 | 3 | 1 | 707 |
| 2026 | 0 | 3 | 1 | 1 | 1 | 1 | 2 | 2 | 1 | 0 | — | — | 12 |
Toyota Venza Sales in Canada
In Canada the Venza chart starts in January 2009 with 12,375 sales that year. The 2011 total of 13,159 is the Canadian record, after which sales declined every year to 5,971 in 2016. The first generation wound down with 1,680 in 2017, and no sales are recorded in 2018 or 2019. The hybrid returned in July 2020 with 890 sales for the year, climbed to 6,250 in 2021, then eased to 4,061 in 2022 and 3,263 in 2023 before rising 22.0 percent to 3,980 in 2024. Only 15 were sold in 2025, all in the first quarter, and none from January to September 2026.
Toyota Venza, Canada calendar-year unit sales, 2009–2026. 2026 is January–Sep (partial).
Annual sales
| Year | Units | YoY |
|---|---|---|
| 2009 | 12,375 | — |
| 2010 | 12,468 | ▲ 0.8% |
| 2011 | 13,159 | ▲ 5.5% |
| 2012 | 11,294 | ▼ 14.2% |
| 2013 | 9,167 | ▼ 18.8% |
| 2014 | 7,610 | ▼ 17.0% |
| 2015 | 6,129 | ▼ 19.5% |
| 2016 | 5,971 | ▼ 2.6% |
| 2017 | 1,680 | ▼ 71.9% |
| 2020 | 890 | ▼ 47.0% |
| 2021 | 6,250 | ▲ 602.2% |
| 2022 | 4,061 | ▼ 35.0% |
| 2023 | 3,263 | ▼ 19.7% |
| 2024 | 3,980 | ▲ 22.0% |
| 2025 | 15 | ▼ 99.6% |
| 2026 (Jan–Sep) | 0 | ▼ 100.0% YTD |
Monthly sales
| Year | Jan | Feb | Mar | Apr | May | Jun | Jul | Aug | Sep | Oct | Nov | Dec | Total |
|---|---|---|---|---|---|---|---|---|---|---|---|---|---|
| 2009 | 451 | 493 | 684 | 948 | 1,083 | 877 | 882 | 1,205 | 1,355 | 1,445 | 1,512 | 1,440 | 12,375 |
| 2010 | 968 | 1,048 | 1,207 | 1,058 | 1,006 | 1,062 | 1,045 | 1,030 | 1,293 | 1,169 | 902 | 680 | 12,468 |
| 2011 | 594 | 748 | 1,291 | 1,682 | 848 | 787 | 902 | 1,176 | 1,427 | 1,432 | 1,174 | 1,098 | 13,159 |
| 2012 | 791 | 712 | 1,102 | 1,051 | 1,124 | 1,005 | 993 | 985 | 849 | 1,030 | 863 | 789 | 11,294 |
| 2013 | 546 | 510 | 842 | 967 | 1,012 | 819 | 874 | 825 | 612 | 629 | 815 | 716 | 9,167 |
| 2014 | 493 | 466 | 680 | 783 | 945 | 711 | 781 | 693 | 650 | 594 | 468 | 346 | 7,610 |
| 2015 | 319 | 442 | 586 | 627 | 630 | 613 | 655 | 581 | 489 | 452 | 377 | 358 | 6,129 |
| 2016 | 312 | 514 | 581 | 651 | 512 | 500 | 458 | 469 | 527 | 558 | 525 | 364 | 5,971 |
| 2017 | 248 | 274 | 283 | 284 | 192 | 140 | 104 | 56 | 42 | 35 | 22 | 0 | 1,680 |
| 2020 | 0 | 0 | 0 | 0 | 0 | 0 | 56 | 54 | 55 | 249 | 226 | 250 | 890 |
| 2021 | 253 | 253 | 292 | 515 | 468 | 516 | 831 | 870 | 832 | 465 | 465 | 490 | 6,250 |
| 2022 | 377 | 359 | 414 | 455 | 455 | 478 | 218 | 251 | 230 | 274 | 274 | 276 | 4,061 |
| 2023 | 81 | 74 | 86 | 188 | 207 | 208 | 420 | 483 | 421 | 382 | 365 | 348 | 3,263 |
| 2024 | 534 | 510 | 511 | 492 | 492 | 449 | 284 | 284 | 259 | 59 | 51 | 55 | 3,980 |
| 2025 | 5 | 4 | 6 | 0 | 0 | 0 | 0 | 0 | 0 | 0 | 0 | 0 | 15 |
| 2026 | 0 | 0 | 0 | 0 | 0 | 0 | 0 | 0 | 0 | — | — | — | 0 |