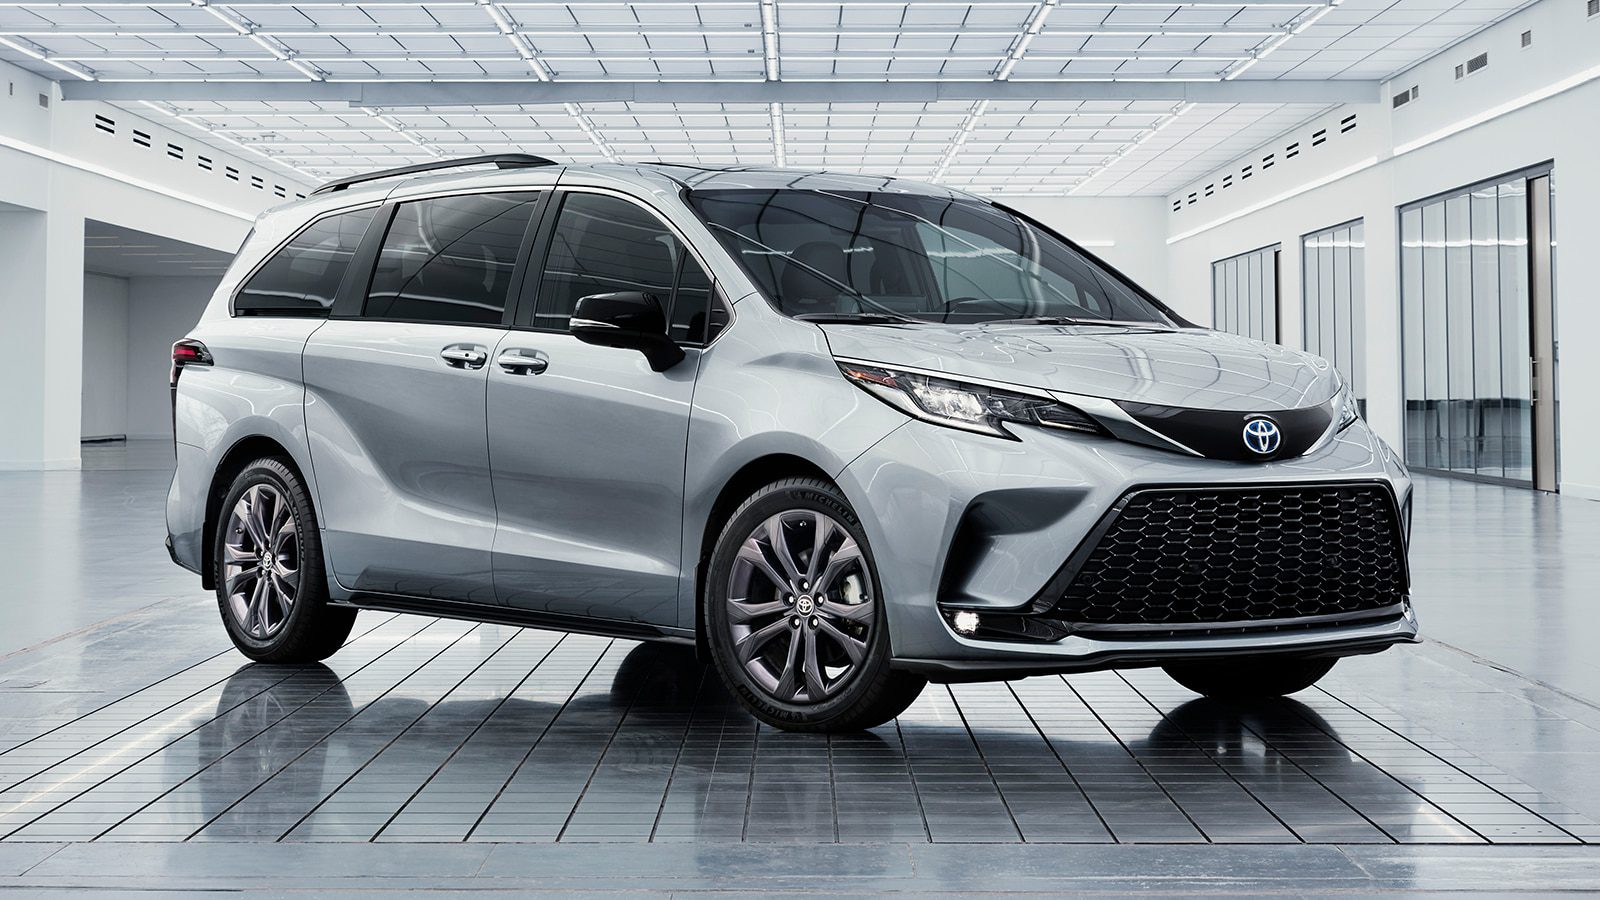
Toyota Sienna
Here you will find monthly and yearly United States and Canadian sales figures for the Toyota Sienna. The Sienna is Toyota’s minivan, sold exclusively as a hybrid since the fourth-generation model arrived for 2021 and built on the TNGA platform. It seats up to eight and competes with the Honda Odyssey, Chrysler Pacifica, and Kia Carnival.
- Class: Minivan
- Powertrain: 2.5L four-cylinder hybrid, 245 horsepower combined system output (offered only as a hybrid)
- Transmission: Electronically controlled continuously variable transmission
- Drivetrain: Front-wheel drive standard, with available electronic on-demand all-wheel drive
- Seating: Up to eight passengers
- Fuel economy: EPA-estimated up to 36 mpg combined
- Chief rivals: Honda Odyssey, Chrysler Pacifica, Kia Carnival
The Sienna is offered only as a hybrid; for 2026 Toyota added standard equipment across the LE and XSE grades.
Toyota Sienna Sales in the United States
Toyota Sienna sales in the United States show a clear generational cycle. The chart opens in 2005 at 161,380 and peaks in 2006 at 163,269, with July 2005 the best month on the chart at 18,293. Volume fell to 84,064 in 2009, then the third generation rebuilt it to 137,497 in 2015 before a steady slide to 73,585 in 2019 and 42,885 in 2020, when April dropped to 960 units. The hybrid-only fourth generation more than doubled sales to 107,990 in 2021, but volume settled at 69,751 in 2022 and 66,547 in 2023 before climbing to 75,037 in 2024 and 101,486 in 2025, up 35.2 percent and the best year since 2017 apart from 2021. The third quarter of 2026 brought 29,518 sales, up 27.7 percent on the 23,114 of the third quarter of 2025, though down 3.5 percent on the 30,600 of the second quarter. October then set the high for the year so far at 10,934, up 29.1 percent on the 8,470 of October 2025 and the best October on this chart since 2006, which lifts January to October 2026 to 95,704, up 13.5 percent on the 84,346 of the same months of 2025.
Toyota Sienna, United States calendar-year unit sales, 2005–2026. 2026 is January–Oct (partial).
Annual sales
| Year | Units | YoY |
|---|---|---|
| 2005 | 161,380 | — |
| 2006 | 163,269 | ▲ 1.2% |
| 2007 | 138,162 | ▼ 15.4% |
| 2008 | 115,944 | ▼ 16.1% |
| 2009 | 84,064 | ▼ 27.5% |
| 2010 | 98,337 | ▲ 17.0% |
| 2011 | 111,429 | ▲ 13.3% |
| 2012 | 114,722 | ▲ 3.0% |
| 2013 | 121,117 | ▲ 5.6% |
| 2014 | 124,502 | ▲ 2.8% |
| 2015 | 137,497 | ▲ 10.4% |
| 2016 | 127,791 | ▼ 7.1% |
| 2017 | 111,489 | ▼ 12.8% |
| 2018 | 87,672 | ▼ 21.4% |
| 2019 | 73,585 | ▼ 16.1% |
| 2020 | 42,885 | ▼ 41.7% |
| 2021 | 107,990 | ▲ 151.8% |
| 2022 | 69,751 | ▼ 35.4% |
| 2023 | 66,547 | ▼ 4.6% |
| 2024 | 75,037 | ▲ 12.8% |
| 2025 | 101,486 | ▲ 35.2% |
| 2026 (Jan–Oct) | 95,704 | ▲ 13.5% YTD |
Monthly sales
| Year | Jan | Feb | Mar | Apr | May | Jun | Jul | Aug | Sep | Oct | Nov | Dec | Total |
|---|---|---|---|---|---|---|---|---|---|---|---|---|---|
| 2005 | 9,279 | 11,877 | 13,287 | 13,471 | 14,823 | 15,327 | 18,293 | 14,479 | 12,579 | 11,081 | 11,769 | 15,115 | 161,380 |
| 2006 | 11,774 | 12,329 | 16,287 | 13,912 | 13,102 | 13,381 | 13,834 | 12,807 | 14,348 | 11,870 | 13,535 | 16,090 | 163,269 |
| 2007 | 10,849 | 11,039 | 13,071 | 12,773 | 12,837 | 12,780 | 11,599 | 11,099 | 9,865 | 9,610 | 10,290 | 12,350 | 138,162 |
| 2008 | 10,406 | 11,262 | 12,631 | 11,215 | 12,178 | 8,578 | 8,726 | 10,244 | 9,647 | 8,003 | 6,153 | 6,901 | 115,944 |
| 2009 | 6,526 | 5,334 | 7,807 | 6,181 | 7,124 | 5,442 | 7,067 | 7,849 | 6,442 | 8,249 | 7,488 | 8,555 | 84,064 |
| 2010 | 2,582 | 4,033 | 7,775 | 8,688 | 10,666 | 9,357 | 10,381 | 8,729 | 9,920 | 9,253 | 8,125 | 8,828 | 98,337 |
| 2011 | 6,343 | 8,806 | 10,449 | 11,462 | 8,618 | 9,267 | 10,620 | 8,648 | 8,975 | 8,767 | 7,910 | 11,564 | 111,429 |
| 2012 | 6,305 | 7,652 | 10,240 | 9,451 | 14,606 | 10,728 | 9,636 | 9,664 | 8,902 | 7,799 | 8,854 | 10,885 | 114,722 |
| 2013 | 7,781 | 9,209 | 12,062 | 9,948 | 11,837 | 11,722 | 10,608 | 11,858 | 9,306 | 8,586 | 8,820 | 9,380 | 121,117 |
| 2014 | 7,696 | 7,364 | 11,027 | 11,134 | 13,330 | 11,740 | 11,661 | 12,386 | 8,592 | 8,938 | 8,946 | 11,688 | 124,502 |
| 2015 | 8,933 | 10,935 | 12,855 | 11,353 | 14,397 | 12,908 | 11,416 | 11,249 | 10,527 | 10,455 | 10,062 | 12,407 | 137,497 |
| 2016 | 10,992 | 11,541 | 11,996 | 10,795 | 11,485 | 11,416 | 11,734 | 10,282 | 9,269 | 7,859 | 9,253 | 11,169 | 127,791 |
| 2017 | 7,285 | 8,965 | 9,770 | 10,242 | 10,434 | 9,462 | 11,100 | 10,853 | 9,512 | 7,255 | 7,670 | 8,941 | 111,489 |
| 2018 | 8,548 | 7,512 | 7,559 | 7,938 | 7,346 | 7,101 | 6,757 | 7,092 | 7,520 | 6,854 | 6,726 | 6,719 | 87,672 |
| 2019 | 4,979 | 5,286 | 8,351 | 6,951 | 8,353 | 7,163 | 6,552 | 6,172 | 4,438 | 4,801 | 5,363 | 5,176 | 73,585 |
| 2020 | 3,934 | 4,778 | 3,164 | 960 | 2,133 | 2,239 | 3,462 | 3,987 | 4,124 | 2,812 | 3,779 | 7,513 | 42,885 |
| 2021 | 6,944 | 7,838 | 11,796 | 10,703 | 11,527 | 8,834 | 9,353 | 8,728 | 7,724 | 8,292 | 8,169 | 8,082 | 107,990 |
| 2022 | 6,359 | 6,862 | 6,840 | 4,852 | 4,691 | 4,805 | 4,376 | 4,375 | 6,498 | 6,965 | 7,021 | 6,107 | 69,751 |
| 2023 | 2,506 | 2,745 | 5,236 | 4,768 | 6,267 | 6,418 | 6,158 | 7,344 | 6,311 | 6,343 | 6,594 | 5,857 | 66,547 |
| 2024 | 5,138 | 5,731 | 5,205 | 5,995 | 5,380 | 5,419 | 4,403 | 6,853 | 6,665 | 8,291 | 8,925 | 7,032 | 75,037 |
| 2025 | 6,448 | 8,080 | 9,033 | 10,315 | 10,541 | 8,345 | 7,466 | 7,846 | 7,802 | 8,470 | 8,393 | 8,747 | 101,486 |
| 2026 | 7,345 | 8,103 | 9,204 | 9,448 | 10,511 | 10,641 | 9,607 | 10,133 | 9,778 | 10,934 | — | — | 95,704 |
Toyota Sienna Sales in Canada
In Canada the Sienna peaked at 17,043 units in 2004 and recorded 15,470 in 2017. Volume slid to 4,482 in 2023 during the changeover to the new generation before rebounding to 11,843 in 2024 and 15,218 in 2025, its best result since 2017. The third quarter of 2026 brought 4,437 sales, up 3.7 percent on the 4,278 of the third quarter of 2025, though down 13.2 percent on the 5,113 of the second quarter, when April was the strongest month of the year at 1,786. That leaves January to September 2026 at 12,094, up 12.5 percent on the 10,753 of the same months of 2025.
Toyota Sienna, Canada calendar-year unit sales, 2004–2026. 2026 is January–Sep (partial).
Annual sales
| Year | Units | YoY |
|---|---|---|
| 2004 | 17,043 | — |
| 2005 | 13,622 | ▼ 20.1% |
| 2006 | 11,579 | ▼ 15.0% |
| 2007 | 9,820 | ▼ 15.2% |
| 2008 | 7,000 | ▼ 28.7% |
| 2009 | 6,345 | ▼ 9.4% |
| 2010 | 9,960 | ▲ 57.0% |
| 2011 | 10,835 | ▲ 8.8% |
| 2012 | 11,858 | ▲ 9.4% |
| 2013 | 11,756 | ▼ 0.9% |
| 2014 | 11,596 | ▼ 1.4% |
| 2015 | 13,981 | ▲ 20.6% |
| 2016 | 13,404 | ▼ 4.1% |
| 2017 | 15,470 | ▲ 15.4% |
| 2018 | 15,117 | ▼ 2.3% |
| 2019 | 14,631 | ▼ 3.2% |
| 2020 | 8,027 | ▼ 45.1% |
| 2021 | 11,868 | ▲ 47.9% |
| 2022 | 5,883 | ▼ 50.4% |
| 2023 | 4,482 | ▼ 23.8% |
| 2024 | 11,843 | ▲ 164.2% |
| 2025 | 15,218 | ▲ 28.5% |
| 2026 (Jan–Sep) | 12,094 | ▲ 12.5% YTD |
Monthly sales
| Year | Jan | Feb | Mar | Apr | May | Jun | Jul | Aug | Sep | Oct | Nov | Dec | Total |
|---|---|---|---|---|---|---|---|---|---|---|---|---|---|
| 2004 | 825 | 1,059 | 1,496 | 1,768 | 1,709 | 1,683 | 1,767 | 1,561 | 1,644 | 1,396 | 1,163 | 972 | 17,043 |
| 2005 | 684 | 726 | 1,224 | 1,474 | 1,491 | 1,341 | 1,312 | 1,267 | 939 | 1,259 | 983 | 922 | 13,622 |
| 2006 | 680 | 805 | 1,138 | 1,147 | 1,136 | 1,008 | 1,100 | 1,115 | 883 | 905 | 857 | 805 | 11,579 |
| 2007 | 786 | 746 | 919 | 873 | 1,032 | 1,097 | 937 | 900 | 820 | 606 | 473 | 631 | 9,820 |
| 2008 | 440 | 555 | 676 | 796 | 857 | 669 | 636 | 527 | 644 | 510 | 338 | 352 | 7,000 |
| 2009 | 346 | 260 | 535 | 561 | 668 | 692 | 581 | 676 | 509 | 366 | 434 | 717 | 6,345 |
| 2010 | 260 | 175 | 560 | 1,027 | 1,205 | 1,037 | 1,449 | 1,105 | 982 | 812 | 771 | 577 | 9,960 |
| 2011 | 584 | 592 | 967 | 1,080 | 951 | 1,105 | 1,013 | 1,035 | 1,003 | 992 | 871 | 642 | 10,835 |
| 2012 | 693 | 922 | 968 | 871 | 1,296 | 1,308 | 1,233 | 1,115 | 876 | 842 | 955 | 779 | 11,858 |
| 2013 | 620 | 544 | 1,027 | 1,143 | 1,255 | 1,327 | 1,269 | 1,183 | 878 | 939 | 800 | 771 | 11,756 |
| 2014 | 579 | 526 | 924 | 1,188 | 1,125 | 1,279 | 1,138 | 1,230 | 1,049 | 970 | 676 | 912 | 11,596 |
| 2015 | 787 | 1,025 | 1,099 | 1,126 | 1,615 | 1,711 | 1,319 | 1,271 | 1,194 | 908 | 1,037 | 889 | 13,981 |
| 2016 | 982 | 1,128 | 1,141 | 1,335 | 1,078 | 1,373 | 1,185 | 1,250 | 999 | 1,047 | 941 | 945 | 13,404 |
| 2017 | 975 | 1,004 | 1,345 | 1,261 | 1,567 | 1,905 | 1,224 | 1,239 | 1,402 | 1,303 | 1,184 | 1,061 | 15,470 |
| 2018 | 1,048 | 912 | 1,636 | 1,647 | 1,562 | 1,468 | 1,220 | 879 | 859 | 956 | 1,243 | 1,687 | 15,117 |
| 2019 | 1,373 | 1,248 | 1,311 | 1,455 | 1,455 | 1,323 | 1,344 | 1,344 | 1,224 | 917 | 798 | 839 | 14,631 |
| 2020 | 414 | 376 | 416 | 653 | 593 | 654 | 972 | 928 | 930 | 718 | 653 | 720 | 8,027 |
| 2021 | 720 | 720 | 831 | 1,200 | 1,090 | 1,201 | 1,154 | 1,209 | 1,155 | 849 | 849 | 890 | 11,868 |
| 2022 | 672 | 640 | 736 | 594 | 594 | 624 | 313 | 360 | 329 | 340 | 340 | 341 | 5,883 |
| 2023 | 179 | 163 | 189 | 399 | 438 | 440 | 380 | 437 | 382 | 515 | 491 | 469 | 4,482 |
| 2024 | 824 | 786 | 788 | 1,011 | 1,011 | 921 | 1,173 | 1,173 | 1,068 | 1,109 | 965 | 1,014 | 11,843 |
| 2025 | 802 | 729 | 767 | 1,435 | 1,370 | 1,372 | 1,470 | 1,403 | 1,405 | 1,604 | 1,325 | 1,536 | 15,218 |
| 2026 | 793 | 524 | 1,227 | 1,786 | 1,720 | 1,607 | 1,361 | 1,403 | 1,673 | — | — | — | 12,094 |