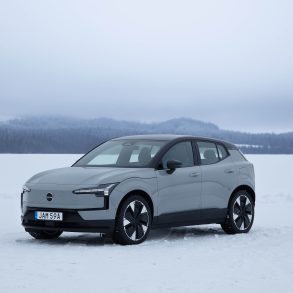
Toyota C-HR
Here you will find monthly and yearly United States and Canadian sales figures for the Toyota C-HR. The original C-HR was a subcompact crossover with a coupe-like profile that went on sale in America in the spring of 2017 and ran out in 2023. The nameplate returned in 2026 as an all-new battery-electric compact SUV built on Toyota’s e-TNGA platform, so the charts below show two very different vehicles separated by an almost empty stretch.
- Class: Battery-electric compact SUV, five seats (2026 model year)
- Powertrain: Dual electric motors, 338 hp net combined, all-wheel drive standard in the U.S. (Canada also offers a front-drive SE)
- Battery and range: 77 kWh battery (Toyota Canada); EPA-estimated 287 miles with 18-inch wheels and 273 miles with 20-inch wheels
- Charging: NACS port; DC fast charging from 10 to 80 percent in about 30 minutes
- Transmission: Single-speed
- Trims: SE and XSE in the U.S.; SE, XSE AWD and XSE Premium AWD in Canada
- Cargo: Up to 25.3 cubic feet behind the rear seats
- Chief rivals: Hyundai Kona Electric, Kia Niro EV, Chevrolet Equinox EV, Volvo EX30
Toyota C-HR Sales in the United States
The first-generation C-HR chart opens in April 2017, and the crossover found 25,755 buyers over the rest of that year. Its first full year, 2018, was the best at 49,642, and 2019 came close at 48,930. Sales then eased to 42,936 in 2020 and 35,707 in 2021 before dropping 66.0 percent to 12,141 in 2022 as the model wound down. Just 777 sold in 2023, nearly nine in ten of them in January and February, and there were no meaningful U.S. sales in 2024 or 2025. The battery-electric C-HR arrived in the spring of 2026, and from January to September it has found 7,215 buyers, with 3,735 in the second quarter, 3,467 in the third and a best month of 1,594 in June.
Toyota C-HR, United States calendar-year unit sales, 2017–2026. 2026 is January–Sep (partial).
Annual sales
| Year | Units | YoY |
|---|---|---|
| 2017 | 25,755 | — |
| 2018 | 49,642 | ▲ 92.7% |
| 2019 | 48,930 | ▼ 1.4% |
| 2020 | 42,936 | ▼ 12.3% |
| 2021 | 35,707 | ▼ 16.8% |
| 2022 | 12,141 | ▼ 66.0% |
| 2023 | 777 | ▼ 93.6% |
| 2025 | 1 | ▼ 99.9% |
| 2026 (Jan–Sep) | 7,215 | ▲ 721,400.0% YTD |
Monthly sales
| Year | Jan | Feb | Mar | Apr | May | Jun | Jul | Aug | Sep | Oct | Nov | Dec | Total |
|---|---|---|---|---|---|---|---|---|---|---|---|---|---|
| 2017 | — | — | — | 550 | 1,848 | 3,100 | 3,444 | 2,901 | 3,017 | 3,638 | 3,391 | 3,866 | 25,755 |
| 2018 | 3,946 | 4,420 | 5,253 | 3,923 | 4,366 | 4,331 | 3,688 | 3,823 | 4,180 | 3,683 | 3,732 | 4,297 | 49,642 |
| 2019 | 4,102 | 4,743 | 5,676 | 3,656 | 3,994 | 3,640 | 3,591 | 4,935 | 3,440 | 3,900 | 3,950 | 3,303 | 48,930 |
| 2020 | 2,961 | 4,439 | 2,972 | 1,989 | 4,421 | 4,642 | 3,677 | 3,897 | 4,606 | 3,358 | 2,666 | 3,308 | 42,936 |
| 2021 | 2,839 | 3,049 | 4,513 | 5,242 | 6,004 | 2,796 | 3,661 | 2,411 | 1,873 | 1,296 | 1,082 | 941 | 35,707 |
| 2022 | 785 | 1,662 | 1,808 | 2,001 | 1,680 | 1,144 | 634 | 291 | 308 | 496 | 728 | 604 | 12,141 |
| 2023 | 346 | 345 | 59 | 13 | 6 | 5 | — | 1 | 1 | — | — | 1 | 777 |
| 2025 | — | — | — | — | — | — | 0 | 1 | 0 | 0 | 0 | 0 | 1 |
| 2026 | 0 | 0 | 13 | 632 | 1,509 | 1,594 | 1,189 | 1,384 | 894 | — | — | — | 7,215 |
Toyota C-HR Sales in Canada
In Canada the C-HR chart starts in May 2017 with 4,321 sales for the year. Volume climbed to 6,819 in 2018 and 7,283 in 2019, dipped to 6,618 in 2020, then set the Canadian record of 8,176 in 2021. The 2022 total fell 63.4 percent to 2,990, followed by a run-out of just 3 sales in 2023 and none in 2024 or 2025. The electric C-HR has sold 2,705 in Canada from January to September 2026, including 1,389 in the second quarter and 1,303 in the third.
Toyota C-HR, Canada calendar-year unit sales, 2017–2026. 2026 is January–Sep (partial).
Annual sales
| Year | Units | YoY |
|---|---|---|
| 2017 | 4,321 | — |
| 2018 | 6,819 | ▲ 57.8% |
| 2019 | 7,283 | ▲ 6.8% |
| 2020 | 6,618 | ▼ 9.1% |
| 2021 | 8,176 | ▲ 23.5% |
| 2022 | 2,990 | ▼ 63.4% |
| 2023 | 3 | ▼ 99.9% |
| 2026 (Jan–Sep) | 2,705 | ▲ 90,066.7% YTD |
Monthly sales
| Year | Jan | Feb | Mar | Apr | May | Jun | Jul | Aug | Sep | Oct | Nov | Dec | Total |
|---|---|---|---|---|---|---|---|---|---|---|---|---|---|
| 2017 | 0 | 0 | 0 | 0 | 690 | 641 | 580 | 526 | 448 | 527 | 446 | 463 | 4,321 |
| 2018 | 410 | 408 | 531 | 521 | 732 | 679 | 707 | 575 | 625 | 597 | 644 | 390 | 6,819 |
| 2019 | 504 | 459 | 483 | 851 | 851 | 775 | 667 | 667 | 608 | 509 | 443 | 466 | 7,283 |
| 2020 | 497 | 452 | 498 | 614 | 558 | 616 | 655 | 625 | 627 | 507 | 461 | 508 | 6,618 |
| 2021 | 493 | 493 | 567 | 900 | 818 | 902 | 937 | 982 | 938 | 376 | 376 | 394 | 8,176 |
| 2022 | 384 | 366 | 423 | 374 | 374 | 392 | 169 | 195 | 179 | 44 | 44 | 46 | 2,990 |
| 2023 | 1 | 1 | 0 | 0 | 0 | 0 | 0 | 0 | 1 | 0 | 0 | 0 | 3 |
| 2026 | 0 | 0 | 13 | 262 | 507 | 620 | 556 | 412 | 335 | — | — | — | 2,705 |