
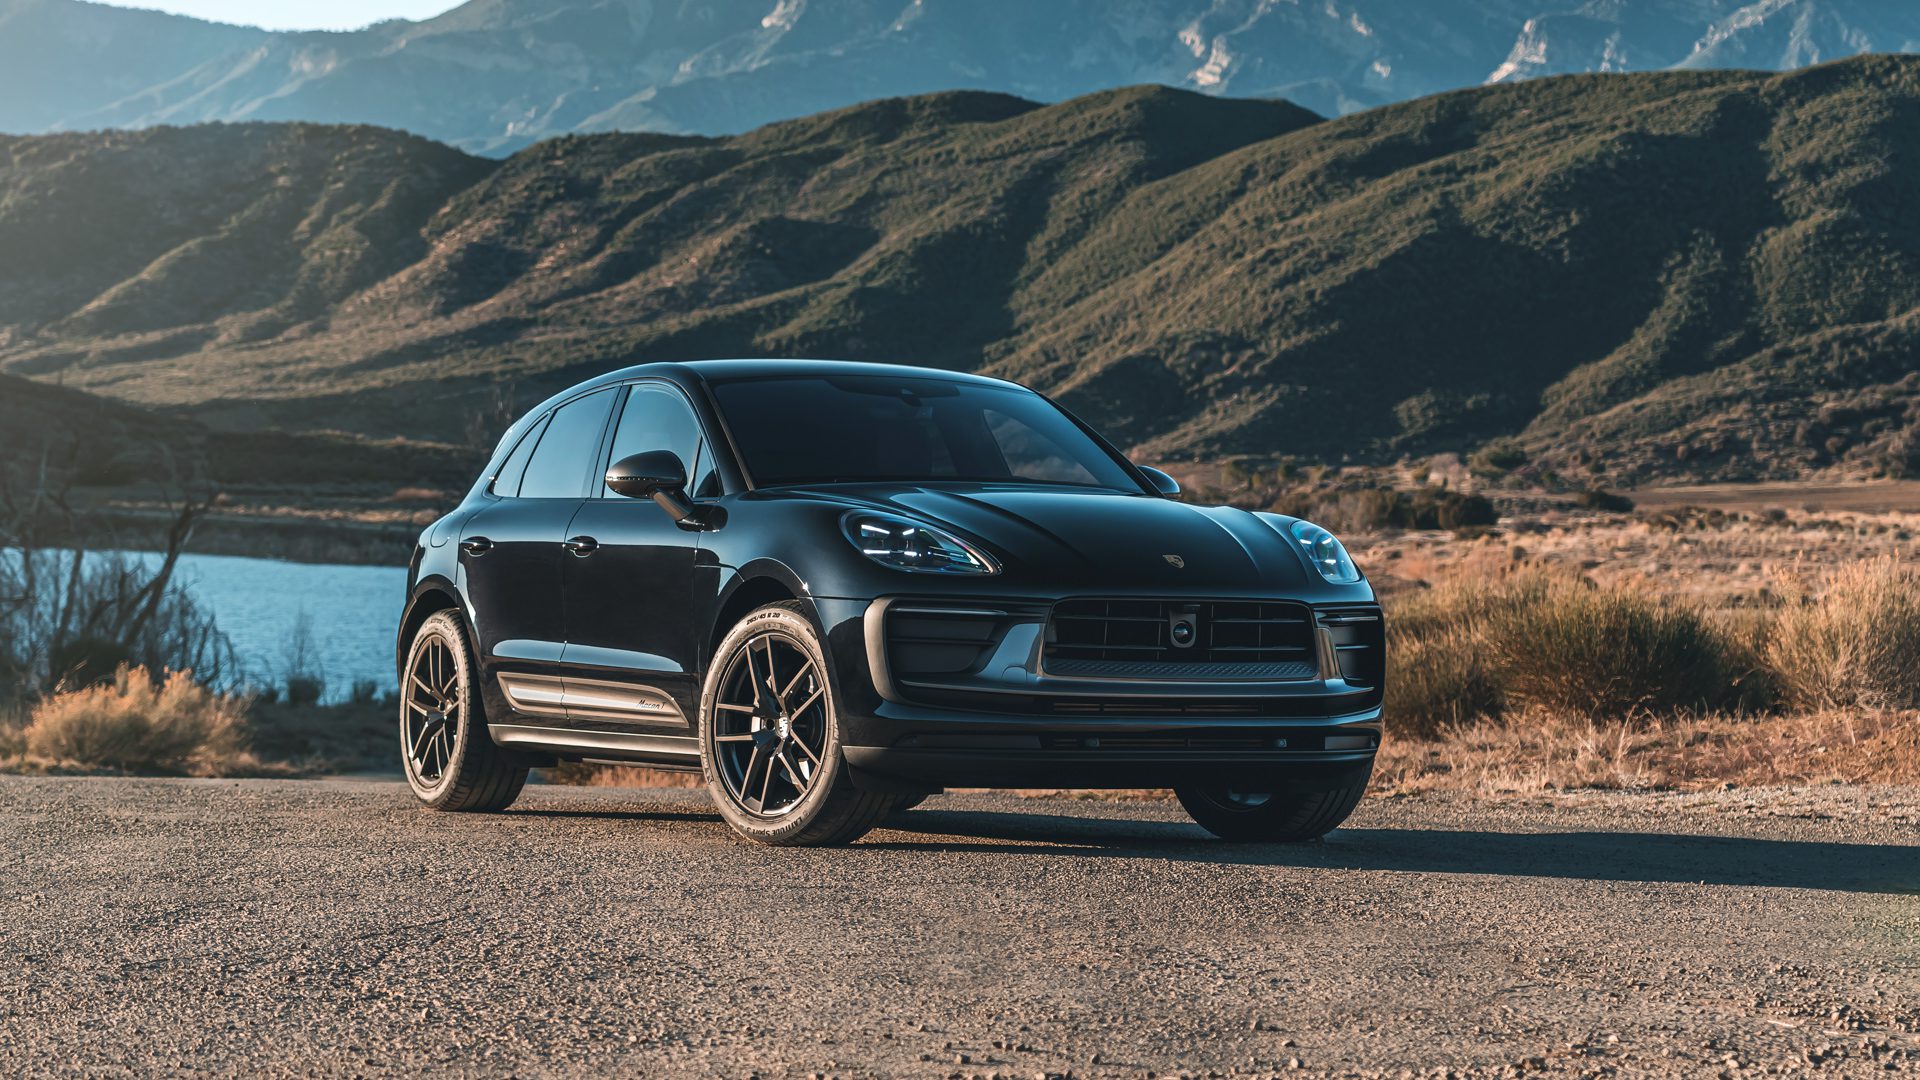
Porsche Macan
Here you will find monthly and yearly Porsche Macan sales figures for the United States and Canada. The Macan is Porsche’s compact luxury SUV, launched for the 2015 model year as a smaller companion to the Cayenne, and it has been the brand’s volume leader through most of the decade since. The nameplate now runs as two parallel families: a gasoline Macan built around a turbocharged four with V6 variants above it, and the Macan Electric, an 800 volt battery model that spans five variants from the rear-drive base car to the 630 horsepower Turbo. The figures below cover every Macan variant sold in each market. The Macan competes with the Audi Q5, BMW X3, Mercedes-Benz GLC and Genesis GV70.
- Class: Compact luxury SUV, sold as parallel gasoline and electric lines
- Gasoline engines: 2.0L turbocharged four rated at 261 horsepower in the Macan and Macan T, with the Macan S at 375 horsepower and the Macan GTS at 434 horsepower
- Electric powertrains: 355 horsepower and 415 lb-ft in the rear-drive Macan Electric, 402 horsepower in the Macan 4, 509 in the Macan 4S, 563 in the GTS and 630 in the Turbo
- Transmission: Seven-speed PDK dual-clutch on the gasoline models, single-speed on the electric models
- Drivetrain: Porsche Traction Management all-wheel drive on the gasoline cars, rear-wheel drive on the base Macan Electric and all-wheel drive on the rest of the electric range
- Charging: 800 volt architecture, 10 to 80 percent state of charge in about 21 minutes under optimal conditions
- Fuel economy: The EPA rates the 2026 gasoline Macan at 21 mpg combined
- Chief rivals: Audi Q5, BMW X3, Mercedes-Benz GLC, Genesis GV70
Porsche lists the electric range from $80,300 for the Macan Electric to $112,700 for the Macan Turbo Electric, and the gasoline range from $65,400.
Porsche Macan Sales in the United States
The Macan reached the United States in 2014 and recorded 7,241 units in a partial first year, then climbed steadily to 22,954 by 2018 and held above 22,000 through the pandemic dip of 2020. It set its American record in 2023 at 27,400 units and followed with 26,720 in 2024. The database returns 23,869 for 2025, but February is absent from that year’s monthly series, so the real 2025 total is higher than the figure shown and the headline drop against 2024 is larger than reality. Comparing only the months present in both years, the first half of 2026 stands at 9,632 units against 10,934 a year earlier, a decline of about 12 percent. Reported deliveries across the full first half of 2026 come to 11,552.
Porsche Macan, United States calendar-year unit sales, 2014–2026. 2026 is January–Jun (partial).
Annual sales
| Year | Units | YoY |
|---|---|---|
| 2014 | 7,241 | — |
| 2015 | 13,533 | ▲ 86.9% |
| 2016 | 19,332 | ▲ 42.9% |
| 2017 | 21,429 | ▲ 10.8% |
| 2018 | 22,954 | ▲ 7.1% |
| 2019 | 22,667 | ▼ 1.3% |
| 2020 | 18,633 | ▼ 17.8% |
| 2021 | 22,002 | ▲ 18.1% |
| 2022 | 23,687 | ▲ 7.7% |
| 2023 | 27,400 | ▲ 15.7% |
| 2024 | 26,720 | ▼ 2.5% |
| 2025 | 23,869 | ▼ 10.7% |
| 2026 (Jan–Jun) | 11,552 | ▲ 5.7% YTD |
Monthly sales
| Year | Jan | Feb | Mar | Apr | May | Jun | Jul | Aug | Sep | Oct | Nov | Dec | Total |
|---|---|---|---|---|---|---|---|---|---|---|---|---|---|
| 2014 | — | — | — | — | 1,263 | 763 | 952 | 969 | 702 | 741 | 987 | 864 | 7,241 |
| 2015 | 796 | 624 | 1,180 | 1,537 | 1,046 | 1,065 | 1,533 | 1,340 | 1,160 | 908 | 962 | 1,382 | 13,533 |
| 2016 | 1,469 | 1,012 | 1,123 | 1,877 | 1,426 | 1,222 | 931 | 2,304 | 1,998 | 2,120 | 2,054 | 1,796 | 19,332 |
| 2017 | 1,960 | 1,575 | 1,802 | 1,700 | 1,730 | 1,871 | 1,600 | 1,641 | 2,346 | 1,779 | 1,981 | 1,444 | 21,429 |
| 2018 | 1,638 | 1,506 | 1,746 | 1,700 | 2,241 | 2,269 | 2,114 | 2,107 | 2,232 | 1,955 | 2,101 | 1,345 | 22,954 |
| 2019 | 1,418 | 1,403 | 1,387 | 1,114 | 1,740 | 2,649 | 2,300 | 2,038 | 2,142 | 2,330 | 2,471 | 1,675 | 22,667 |
| 2020 | 1,227 | 1,588 | 962 | 714 | 1,586 | 1,665 | 1,917 | 1,704 | 1,846 | 1,830 | 1,503 | 2,091 | 18,633 |
| 2021 | 2,045 | 2,045 | 2,301 | 1,721 | 1,655 | 1,721 | 1,718 | 1,654 | 1,718 | 1,808 | 1,808 | 1,808 | 22,002 |
| 2022 | 1,527 | 1,527 | 1,718 | 2,020 | 1,945 | 1,945 | 1,735 | 1,801 | 1,735 | 2,578 | 2,475 | 2,681 | 23,687 |
| 2023 | 2,118 | 2,033 | 2,287 | 2,474 | 2,379 | 2,474 | 2,412 | 2,605 | 2,508 | 2,010 | 2,010 | 2,090 | 27,400 |
| 2024 | 1,865 | 1,865 | 1,940 | 2,379 | 2,474 | 2,474 | 2,150 | 2,408 | 1,978 | 2,119 | 2,488 | 2,580 | 26,720 |
| 2025 | 1,890 | — | 1,966 | 2,390 | 2,482 | 2,206 | 2,568 | 2,246 | 2,144 | 1,868 | 1,896 | 2,213 | 23,869 |
| 2026 | 2,080 | 1,920 | 2,079 | 1,778 | 1,934 | 1,761 | — | — | — | — | — | — | 11,552 |
Porsche Macan Sales in Canada
Canada took 1,223 Macans in the 2014 launch year and moved past 3,700 by 2017. The Canadian record remains 3,960 units in 2018, and after a trough of 2,483 in 2020 the series has climbed back to just under that mark, at 3,779 in 2024 and 3,877 in 2025, the second best year the Macan has posted here. 2026 has opened stronger still, with 1,890 units through June against 1,699 over the same six months of 2025, a gain of about 11 percent. Canada is also the steadier of the two North American markets, and the fourth quarter has been its strongest stretch in each of the last two years.
Porsche Macan, Canada calendar-year unit sales, 2014–2026. 2026 is January–Jun (partial).
Annual sales
| Year | Units | YoY |
|---|---|---|
| 2014 | 1,223 | — |
| 2015 | 2,121 | ▲ 73.4% |
| 2016 | 2,800 | ▲ 32.0% |
| 2017 | 3,767 | ▲ 34.5% |
| 2018 | 3,960 | ▲ 5.1% |
| 2019 | 3,487 | ▼ 11.9% |
| 2020 | 2,483 | ▼ 28.8% |
| 2021 | 3,657 | ▲ 47.3% |
| 2022 | 3,376 | ▼ 7.7% |
| 2023 | 3,907 | ▲ 15.7% |
| 2024 | 3,779 | ▼ 3.3% |
| 2025 | 3,877 | ▲ 2.6% |
| 2026 (Jan–Jun) | 1,890 | ▲ 11.2% YTD |
Monthly sales
| Year | Jan | Feb | Mar | Apr | May | Jun | Jul | Aug | Sep | Oct | Nov | Dec | Total |
|---|---|---|---|---|---|---|---|---|---|---|---|---|---|
| 2014 | 0 | 0 | 0 | 0 | 104 | 168 | 191 | 199 | 136 | 142 | 131 | 152 | 1,223 |
| 2015 | 56 | 52 | 143 | 265 | 195 | 239 | 241 | 241 | 240 | 173 | 130 | 146 | 2,121 |
| 2016 | 112 | 134 | 164 | 278 | 225 | 255 | 167 | 309 | 356 | 323 | 264 | 213 | 2,800 |
| 2017 | 218 | 250 | 331 | 407 | 227 | 329 | 312 | 304 | 342 | 346 | 338 | 363 | 3,767 |
| 2018 | 166 | 145 | 224 | 340 | 408 | 309 | 425 | 507 | 388 | 395 | 373 | 280 | 3,960 |
| 2019 | 150 | 136 | 145 | 393 | 393 | 359 | 370 | 370 | 338 | 299 | 260 | 274 | 3,487 |
| 2020 | 113 | 103 | 115 | 180 | 163 | 181 | 364 | 347 | 348 | 195 | 177 | 197 | 2,483 |
| 2021 | 226 | 226 | 261 | 360 | 328 | 362 | 260 | 273 | 262 | 360 | 360 | 379 | 3,657 |
| 2022 | 309 | 294 | 339 | 277 | 277 | 291 | 222 | 256 | 235 | 292 | 292 | 292 | 3,376 |
| 2023 | 366 | 333 | 385 | 401 | 441 | 443 | 264 | 304 | 266 | 245 | 234 | 225 | 3,907 |
| 2024 | 230 | 220 | 221 | 345 | 345 | 314 | 275 | 275 | 252 | 467 | 406 | 429 | 3,779 |
| 2025 | 238 | 216 | 229 | 349 | 333 | 334 | 338 | 323 | 325 | 428 | 353 | 411 | 3,877 |
| 2026 | 248 | 222 | 244 | 405 | 391 | 380 | — | — | — | — | — | — | 1,890 |







