
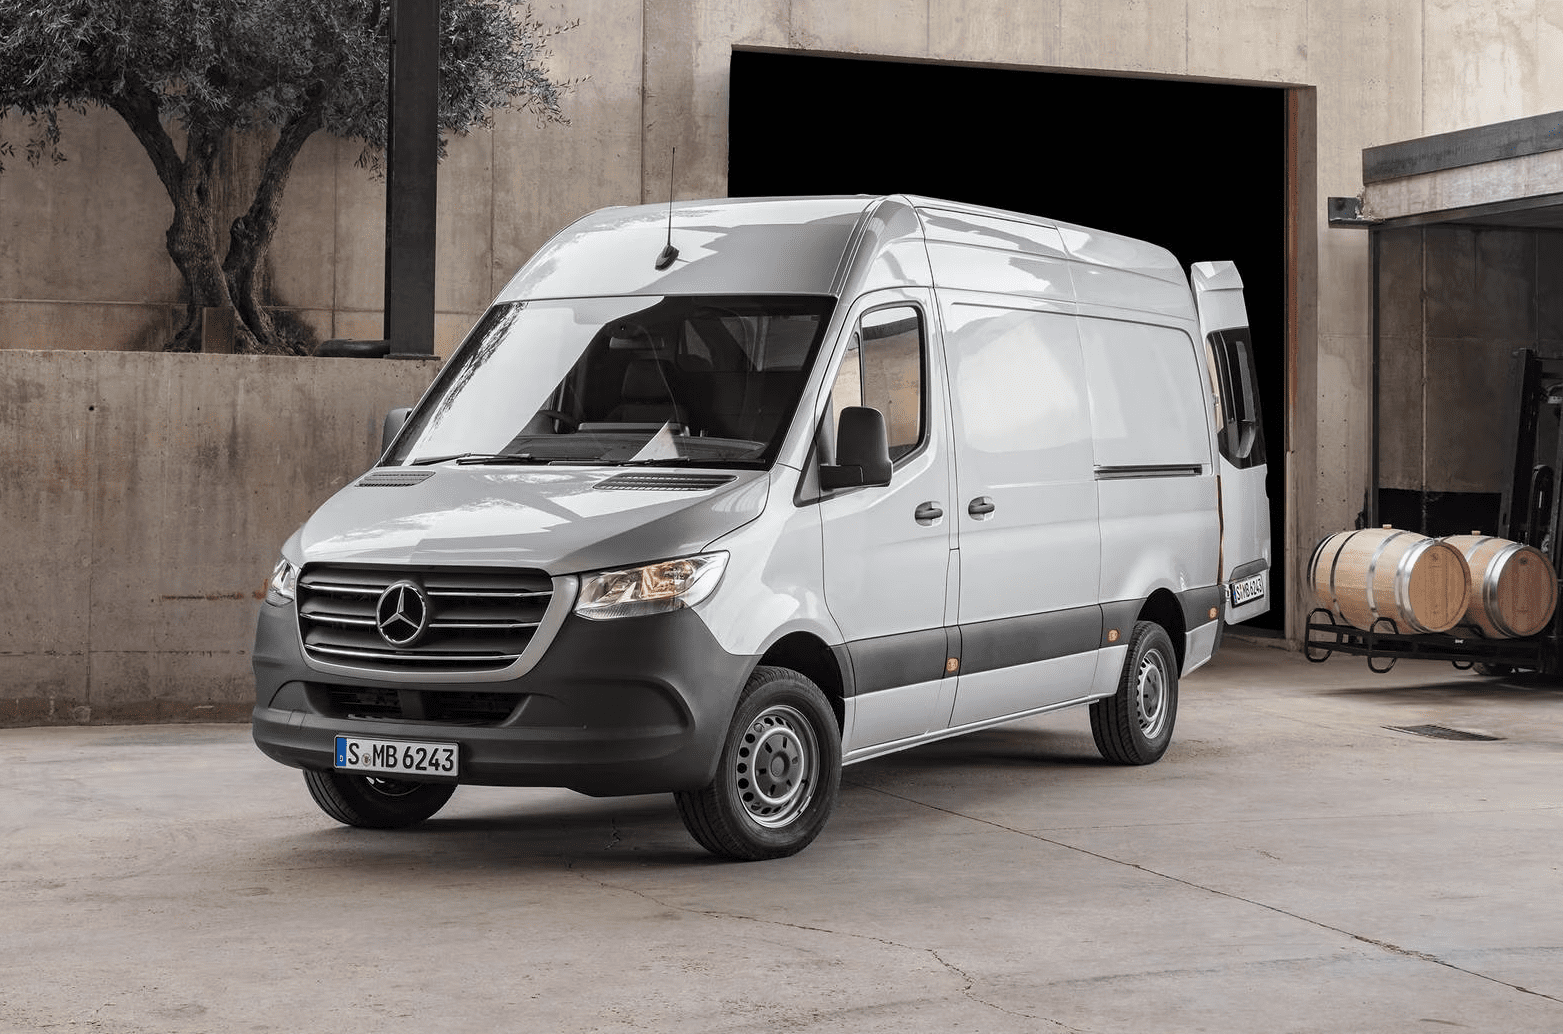
Mercedes-Benz Sprinter
Here you will find monthly and yearly United States and Canadian sales figures for the Mercedes-Benz Sprinter. The Sprinter is Mercedes-Benz’s full-size commercial van, offered as a cargo van, crew van, passenger van and cab chassis, and it is the segment benchmark against which the Ford Transit and Ram ProMaster are usually measured. A note on the history below: every Sprinter sold in America between 2003 and 2009 wore Dodge badges, as did 253 of the 2010 total, and United States figures include the Metris from October 2015 through February 2016. In Canada, Dodge Sprinter sales cover 2004 through 2009 plus 136 units of the 2010 total.
- Class: Full-size commercial van
- Standard-output engine: 2.0L four-cylinder turbodiesel, 170 horsepower and 295 lb-ft of torque
- High-output engine: 2.0L four-cylinder turbodiesel, 211 horsepower and 332 lb-ft of torque
- Transmission: Nine-speed 9G-TRONIC automatic
- Drivetrain: Rear-wheel drive, with all-wheel drive available on high-output configurations
- Body styles: Cargo van, crew van, passenger van and cab chassis, on 144-inch and 170-inch wheelbases with standard and high roofs
- Chief rivals: Ford Transit, Ram ProMaster, Chevrolet Express, GMC Savana
Mercedes-Benz Sprinter Sales in the United States
The Sprinter took a decade to find its footing in the United States, moving 1,941 units in its 2003 debut year, peaking near 21,961 in 2006 and then collapsing to 7,154 in 2009. Growth resumed once Mercedes-Benz took the nameplate over outright, carrying volume from 16,577 in 2011 to 28,519 in 2015. The real surge came with the pandemic-era boom in delivery and upfit work: deliveries jumped to 37,513 in 2020, 40,534 in 2021 and an all-time high of 46,533 in 2022, with 46,229 in 2023 close behind. Volume has since eased, to 43,425 in 2024 and 38,460 in 2025. November 2024 is still absent from the underlying monthly series, so the 2024 total understates the true figure and the 11.4 percent decline it implies for 2025 is overstated. Through June 2026 the Sprinter has recorded 17,900 United States deliveries, essentially level with the 17,833 of the first half of 2025.
Mercedes-Benz Sprinter, United States calendar-year unit sales, 2003–2026. 2026 is January–Jun (partial).
Annual sales
| Year | Units | YoY |
|---|---|---|
| 2003 | 1,941 | — |
| 2004 | 10,232 | ▲ 427.2% |
| 2005 | 19,662 | ▲ 92.2% |
| 2006 | 21,961 | ▲ 11.7% |
| 2007 | 16,586 | ▼ 24.5% |
| 2008 | 14,600 | ▼ 12.0% |
| 2009 | 7,154 | ▼ 51.0% |
| 2010 | 8,559 | ▲ 19.6% |
| 2011 | 16,577 | ▲ 93.7% |
| 2012 | 20,929 | ▲ 26.3% |
| 2013 | 21,816 | ▲ 4.2% |
| 2014 | 25,745 | ▲ 18.0% |
| 2015 | 28,519 | ▲ 10.8% |
| 2016 | 28,320 | ▼ 0.7% |
| 2017 | 27,415 | ▼ 3.2% |
| 2018 | 29,787 | ▲ 8.7% |
| 2019 | 29,757 | ▼ 0.1% |
| 2020 | 37,513 | ▲ 26.1% |
| 2021 | 40,534 | ▲ 8.1% |
| 2022 | 46,533 | ▲ 14.8% |
| 2023 | 46,229 | ▼ 0.7% |
| 2024 | 43,425 | ▼ 6.1% |
| 2025 | 38,460 | ▼ 11.4% |
| 2026 (Jan–Jun) | 17,900 | ▲ 0.4% YTD |
Monthly sales
| Year | Jan | Feb | Mar | Apr | May | Jun | Jul | Aug | Sep | Oct | Nov | Dec | Total |
|---|---|---|---|---|---|---|---|---|---|---|---|---|---|
| 2003 | — | — | — | — | — | — | — | — | — | — | — | 1,941 | 1,941 |
| 2004 | — | — | — | — | — | — | — | — | — | — | — | 10,232 | 10,232 |
| 2005 | 743 | 896 | 1,384 | 1,585 | 1,802 | 1,486 | 1,940 | 2,540 | 2,045 | 1,855 | 1,536 | 1,850 | 19,662 |
| 2006 | 1,360 | 1,398 | 2,060 | 1,646 | 2,012 | 1,866 | 1,880 | 2,267 | 2,288 | 2,289 | 1,587 | 1,308 | 21,961 |
| 2007 | 750 | 627 | 876 | 1,208 | 1,351 | 1,626 | 1,360 | 1,906 | 1,489 | 2,466 | 1,275 | 1,652 | 16,586 |
| 2008 | 1,402 | 1,134 | 1,279 | 1,317 | 1,781 | 1,490 | 1,098 | 976 | 831 | 921 | 1,239 | 1,132 | 14,600 |
| 2009 | 483 | 378 | 435 | 287 | 564 | 605 | 705 | 1,148 | 798 | 446 | 959 | 346 | 7,154 |
| 2010 | 436 | 515 | 386 | 600 | 628 | 728 | 681 | 848 | 804 | 725 | 829 | 1,379 | 8,559 |
| 2011 | 875 | 712 | 1,062 | 1,115 | 1,420 | 1,911 | 1,732 | 1,846 | 1,779 | 1,485 | 1,045 | 1,595 | 16,577 |
| 2012 | 924 | 830 | 1,375 | 1,966 | 2,041 | 2,140 | 2,203 | 2,129 | 1,794 | 1,666 | 1,630 | 2,231 | 20,929 |
| 2013 | 1,077 | 1,228 | 1,529 | 1,855 | 1,828 | 1,966 | 1,915 | 1,390 | 2,152 | 2,038 | 2,010 | 2,828 | 21,816 |
| 2014 | 1,288 | 1,421 | 1,915 | 2,394 | 2,264 | 2,201 | 2,214 | 1,880 | 2,208 | 2,140 | 2,532 | 3,288 | 25,745 |
| 2015 | 1,505 | 1,675 | 2,379 | 2,764 | 2,769 | 2,442 | 2,163 | 2,260 | 2,315 | 2,661 | 2,255 | 3,331 | 28,519 |
| 2016 | 1,547 | 1,786 | 2,529 | 2,140 | 2,438 | 2,648 | 2,907 | 2,601 | 2,404 | 2,166 | 2,125 | 3,029 | 28,320 |
| 2017 | 1,651 | 2,133 | 2,407 | 1,626 | 2,376 | 2,570 | 2,154 | 2,851 | 2,519 | 1,809 | 2,256 | 3,063 | 27,415 |
| 2018 | 1,775 | 2,498 | 2,349 | 2,224 | 2,419 | 2,190 | 2,277 | 2,959 | 3,558 | 3,346 | 1,054 | 3,138 | 29,787 |
| 2019 | 947 | 2,128 | 2,442 | 2,011 | 1,872 | 2,005 | 2,014 | 3,761 | 3,199 | 2,984 | 2,656 | 3,738 | 29,757 |
| 2020 | 1,710 | 2,214 | 1,341 | 1,307 | 2,904 | 3,049 | 3,506 | 3,117 | 3,377 | 5,056 | 4,153 | 5,779 | 37,513 |
| 2021 | 2,798 | 2,798 | 3,148 | 2,783 | 2,676 | 2,783 | 4,335 | 4,174 | 4,335 | 3,568 | 3,568 | 3,568 | 40,534 |
| 2022 | 3,285 | 3,285 | 3,696 | 5,057 | 4,870 | 4,870 | 3,775 | 3,920 | 3,775 | 3,333 | 3,200 | 3,467 | 46,533 |
| 2023 | 3,289 | 3,158 | 3,553 | 4,052 | 3,896 | 4,052 | 2,857 | 3,085 | 2,971 | 5,038 | 5,038 | 5,240 | 46,229 |
| 2024 | 5,069 | 5,069 | 5,272 | 3,550 | 3,692 | 3,692 | 3,738 | 4,187 | 3,439 | 2,578 | — | 3,139 | 43,425 |
| 2025 | 2,485 | 2,840 | 3,515 | 2,816 | 3,166 | 3,011 | 2,877 | 3,383 | 3,087 | 3,526 | 3,578 | 4,176 | 38,460 |
| 2026 | 2,437 | 2,762 | 3,201 | 3,086 | 3,357 | 3,057 | — | — | — | — | — | — | 17,900 |
Mercedes-Benz Sprinter Sales in Canada
Canada has been a steadier market for the Sprinter. Volume built from 1,081 units in 2004 to 4,761 in 2015 and then held in the 4,000s through the end of the decade before the same commercial-van boom lifted it to 5,423 in 2022 and a record 6,459 in 2023. The nameplate has held that higher plateau since, with 5,883 in 2024 and 6,083 in 2025, the second-best Canadian year on record. The first half of 2026 has been softer, at 2,567 units against 3,352 over the same six months of 2025.
Mercedes-Benz Sprinter, Canada calendar-year unit sales, 2004–2026. 2026 is January–Jun (partial).
Annual sales
| Year | Units | YoY |
|---|---|---|
| 2004 | 1,081 | — |
| 2005 | 1,952 | ▲ 80.6% |
| 2006 | 2,475 | ▲ 26.8% |
| 2007 | 2,068 | ▼ 16.4% |
| 2008 | 2,486 | ▲ 20.2% |
| 2009 | 1,161 | ▼ 53.3% |
| 2010 | 136 | ▼ 88.3% |
| 2011 | 2,479 | ▲ 1,722.8% |
| 2012 | 3,010 | ▲ 21.4% |
| 2013 | 3,424 | ▲ 13.8% |
| 2014 | 4,077 | ▲ 19.1% |
| 2015 | 4,761 | ▲ 16.8% |
| 2016 | 4,677 | ▼ 1.8% |
| 2017 | 4,697 | ▲ 0.4% |
| 2018 | 4,963 | ▲ 5.7% |
| 2019 | 4,367 | ▼ 12.0% |
| 2020 | 4,328 | ▼ 0.9% |
| 2021 | 4,070 | ▼ 6.0% |
| 2022 | 5,423 | ▲ 33.2% |
| 2023 | 6,459 | ▲ 19.1% |
| 2024 | 5,883 | ▼ 8.9% |
| 2025 | 6,083 | ▲ 3.4% |
| 2026 (Jan–Jun) | 2,567 | ▼ 23.4% YTD |
Monthly sales
| Year | Jan | Feb | Mar | Apr | May | Jun | Jul | Aug | Sep | Oct | Nov | Dec | Total |
|---|---|---|---|---|---|---|---|---|---|---|---|---|---|
| 2004 | 52 | 34 | 57 | 71 | 35 | 56 | 87 | 102 | 135 | 140 | 132 | 180 | 1,081 |
| 2005 | 100 | 113 | 97 | 103 | 170 | 167 | 253 | 226 | 192 | 189 | 174 | 168 | 1,952 |
| 2006 | 135 | 179 | 183 | 147 | 164 | 219 | 254 | 261 | 292 | 243 | 211 | 187 | 2,475 |
| 2007 | 116 | 126 | 148 | 98 | 155 | 256 | 233 | 248 | 198 | 153 | 122 | 215 | 2,068 |
| 2008 | 126 | 176 | 168 | 195 | 252 | 205 | 247 | 171 | 258 | 284 | 111 | 293 | 2,486 |
| 2009 | 78 | 70 | 108 | 117 | 80 | 99 | 260 | 27 | 41 | 76 | 88 | 117 | 1,161 |
| 2010 | 35 | 29 | 12 | 11 | 11 | 4 | 7 | 4 | 10 | 4 | 9 | 0 | 136 |
| 2011 | 80 | 153 | 253 | 229 | 234 | 283 | 168 | 143 | 218 | 153 | 215 | 350 | 2,479 |
| 2012 | 197 | 161 | 251 | 246 | 207 | 310 | 205 | 190 | 269 | 277 | 405 | 292 | 3,010 |
| 2013 | 212 | 245 | 297 | 279 | 341 | 323 | 311 | 228 | 396 | 261 | 237 | 294 | 3,424 |
| 2014 | 242 | 280 | 345 | 382 | 473 | 356 | 363 | 311 | 460 | 299 | 269 | 297 | 4,077 |
| 2015 | 311 | 303 | 390 | 442 | 479 | 500 | 381 | 379 | 566 | 334 | 312 | 364 | 4,761 |
| 2016 | 203 | 293 | 409 | 389 | 491 | 518 | 367 | 300 | 452 | 386 | 416 | 453 | 4,677 |
| 2017 | 407 | 522 | 450 | 395 | 290 | 398 | 372 | 313 | 401 | 322 | 389 | 438 | 4,697 |
| 2018 | 432 | 303 | 432 | 475 | 515 | 531 | 423 | 461 | 450 | 297 | 356 | 288 | 4,963 |
| 2019 | 317 | 288 | 305 | 385 | 385 | 352 | 430 | 430 | 393 | 388 | 338 | 356 | 4,367 |
| 2020 | 260 | 237 | 262 | 298 | 271 | 299 | 433 | 413 | 414 | 495 | 450 | 496 | 4,328 |
| 2021 | 417 | 417 | 482 | 159 | 144 | 160 | 420 | 440 | 421 | 331 | 331 | 348 | 4,070 |
| 2022 | 495 | 471 | 543 | 463 | 463 | 486 | 501 | 577 | 528 | 298 | 298 | 300 | 5,423 |
| 2023 | 504 | 458 | 528 | 455 | 500 | 502 | 630 | 725 | 631 | 532 | 508 | 486 | 6,459 |
| 2024 | 422 | 403 | 405 | 499 | 499 | 455 | 575 | 575 | 525 | 548 | 476 | 501 | 5,883 |
| 2025 | 626 | 569 | 599 | 535 | 511 | 512 | 495 | 472 | 473 | 463 | 383 | 445 | 6,083 |
| 2026 | 410 | 366 | 403 | 450 | 459 | 479 | — | — | — | — | — | — | 2,567 |

Between 2001 and now, the Sprinter is/was also sold by Freightliner, (still) a division of Daimler. I don't think your 2003-2006 (at least) sales figures include that channel (my memory says 27,000 total sold in 2005). A small number were also sold by Daimler Vans, converted to bus-doored shuttle vans.