
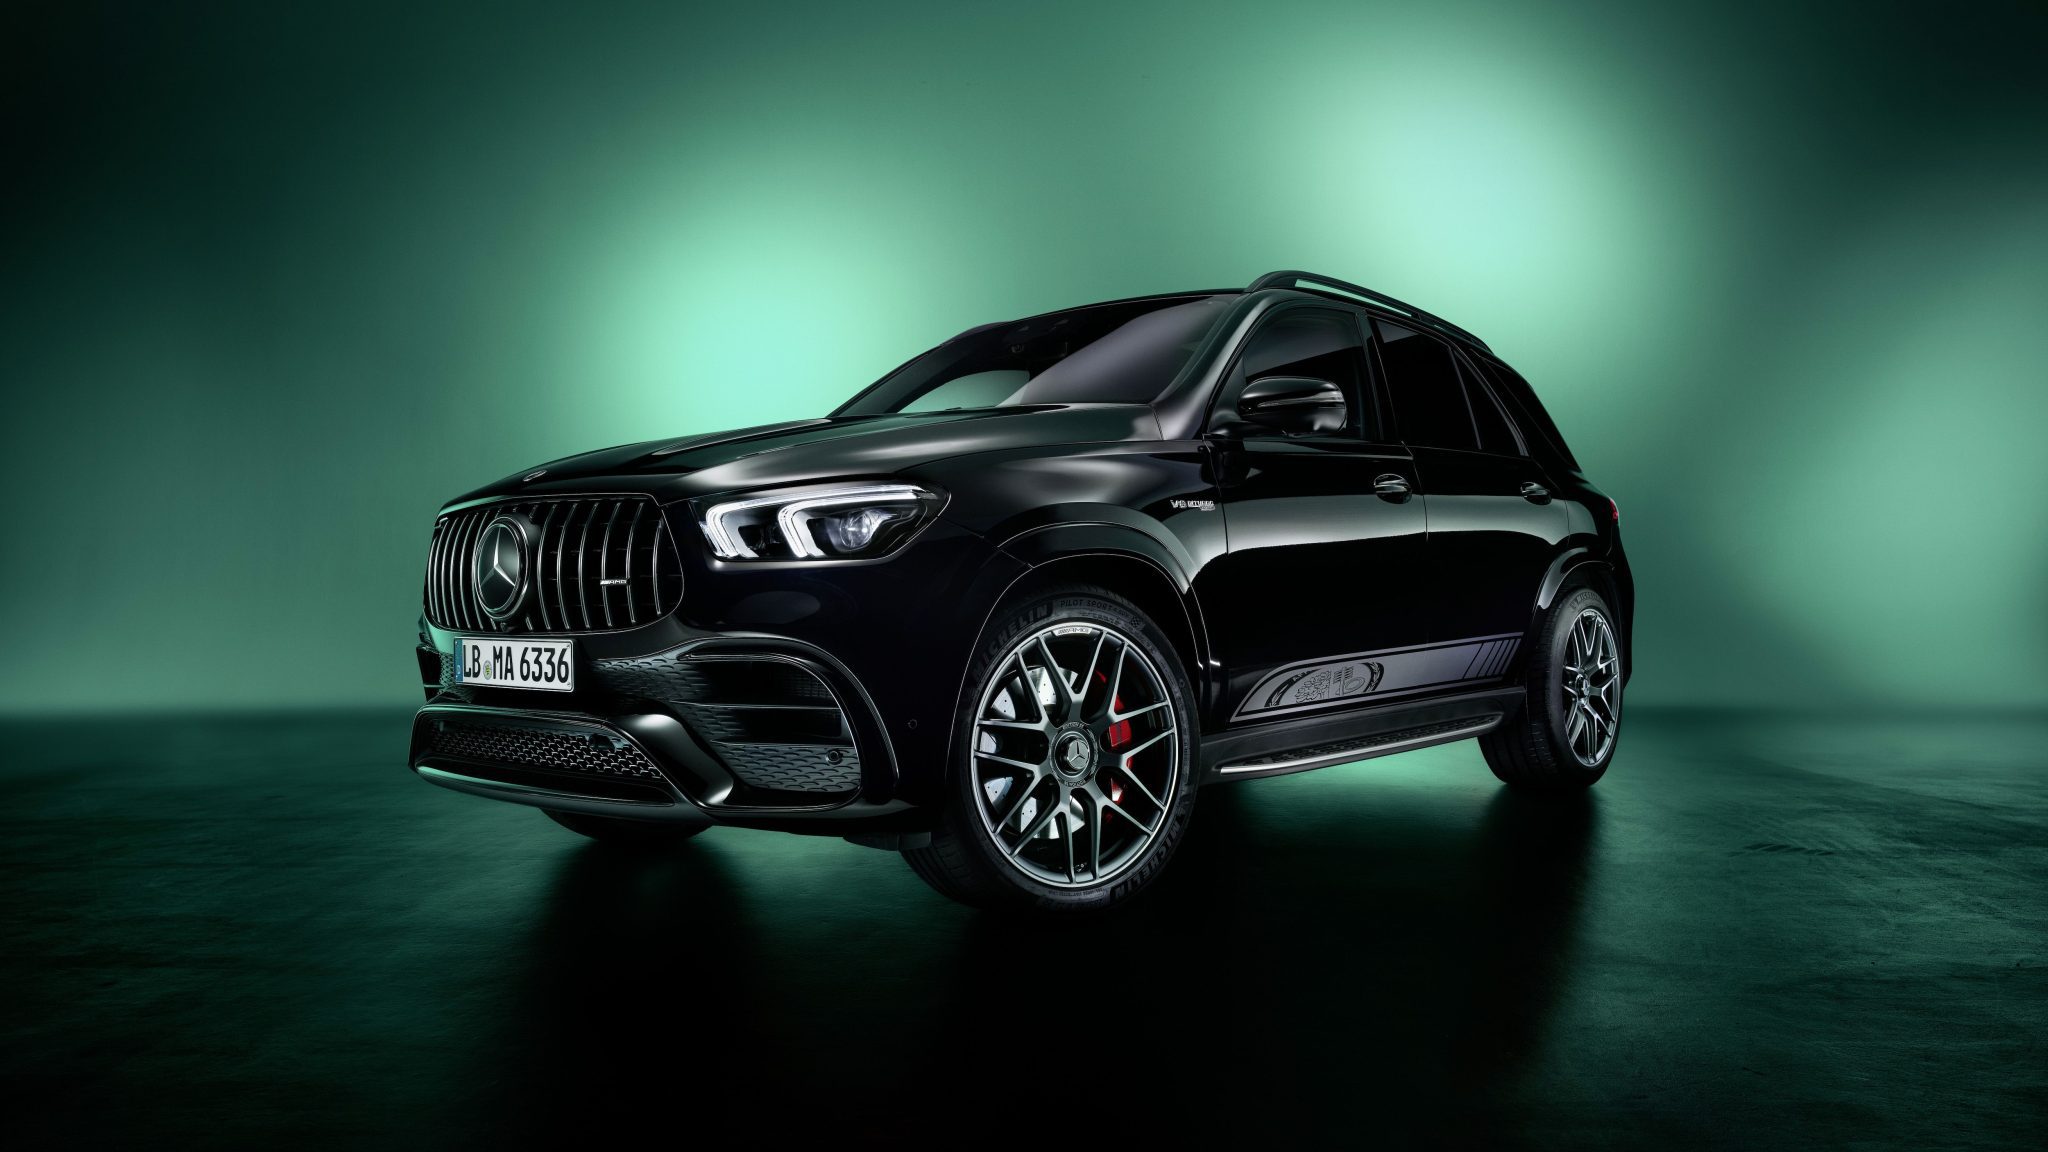
Mercedes-Benz GLE-Class
Here you will find yearly and monthly United States and Canadian sales figures for the Mercedes-Benz GLE-Class. The GLE is Mercedes-Benz’s midsize luxury SUV and a direct rival to the BMW X5, Audi Q7, Lexus TX, Volvo XC90, and Genesis GV80. This chart spans the full history of the nameplate: it begins with the M-Class (the ML), the SUV that helped define the segment from the late 1990s, and continues with the GLE badge that Mercedes adopted for the 2016 model year to tie the SUV to its E-Class line.
- Class: Midsize luxury SUV, also sold in a lower-roof Coupe body
- Engines: GLE 350 uses a 2.0-liter turbocharged inline-four with mild-hybrid drive rated at 255 horsepower and 295 lb-ft; the GLE 450 4MATIC uses a 3.0-liter turbocharged inline-six with mild-hybrid drive rated at 375 horsepower and 369 lb-ft; the GLE 450e 4MATIC plug-in hybrid is rated at 381 horsepower and 479 lb-ft combined; the GLE 580 4MATIC makes 510 horsepower and 538 lb-ft; the AMG GLE 53 4MATIC+ makes 429 horsepower and 413 lb-ft, and the biturbo V8 AMG GLE 63 S 4MATIC+ makes 603 horsepower and 627 lb-ft
- Transmission: 9G-TRONIC nine-speed automatic
- Drivetrain: Rear-wheel drive on the GLE 350, 4MATIC all-wheel drive on every other model
- Trims: GLE 350, GLE 350 4MATIC, GLE 450 4MATIC, GLE 450e 4MATIC, GLE 580 4MATIC, AMG GLE 53 4MATIC+ and AMG GLE 63 S 4MATIC+
- Chief rivals: BMW X5, Audi Q7, Porsche Cayenne, Volvo XC90, Genesis GV80
The GLE 350 mild-hybrid system uses an integrated starter-generator and a 48-volt lithium-ion battery that can add up to 20 horsepower and 148 lb-ft.
Mercedes-Benz GLE-Class Sales in the United States
The GLE-Class and its M-Class predecessor have long been core to Mercedes-Benz’s US SUV business. The M-Class sold 34,959 units in 2005, fell to 25,799 in the 2009 recession, then climbed to a peak of 54,595 in 2017. Sales held between 46,000 and 50,000 a year from 2018 to 2020, stepped up to 65,073 in 2021 and have stayed above 57,000 every year since. The GLE set a record of 67,927 in 2024 and topped it in 2025 with 71,326 units, up 5.0 percent, closing the year with its best month on this chart at 7,849 in December. The pace has quickened again in 2026: 37,008 units through June, up 16.1 percent on the 31,873 of the first half of 2025, and the first quarter’s 19,277 was the strongest opening quarter on this chart.
Mercedes-Benz GLE, United States calendar-year unit sales, 2005–2026. 2026 is January–Jun (partial).
Annual sales
| Year | Units | YoY |
|---|---|---|
| 2005 | 34,959 | — |
| 2006 | 31,632 | ▼ 9.5% |
| 2007 | 33,879 | ▲ 7.1% |
| 2008 | 34,320 | ▲ 1.3% |
| 2009 | 25,799 | ▼ 24.8% |
| 2010 | 29,698 | ▲ 15.1% |
| 2011 | 35,835 | ▲ 20.7% |
| 2012 | 38,101 | ▲ 6.3% |
| 2013 | 41,326 | ▲ 8.5% |
| 2014 | 46,726 | ▲ 13.1% |
| 2015 | 53,217 | ▲ 13.9% |
| 2016 | 51,791 | ▼ 2.7% |
| 2017 | 54,595 | ▲ 5.4% |
| 2018 | 46,010 | ▼ 15.7% |
| 2019 | 49,980 | ▲ 8.6% |
| 2020 | 48,153 | ▼ 3.7% |
| 2021 | 65,073 | ▲ 35.1% |
| 2022 | 63,050 | ▼ 3.1% |
| 2023 | 57,696 | ▼ 8.5% |
| 2024 | 67,927 | ▲ 17.7% |
| 2025 | 71,326 | ▲ 5.0% |
| 2026 (Jan–Jun) | 37,008 | ▲ 16.1% YTD |
Monthly sales
| Year | Jan | Feb | Mar | Apr | May | Jun | Jul | Aug | Sep | Oct | Nov | Dec | Total |
|---|---|---|---|---|---|---|---|---|---|---|---|---|---|
| 2005 | 980 | 944 | 2,283 | 3,248 | 3,319 | 3,516 | 3,526 | 3,455 | 2,727 | 2,641 | 2,980 | 5,340 | 34,959 |
| 2006 | 1,962 | 2,155 | 2,740 | 2,590 | 2,278 | 2,601 | 2,446 | 2,312 | 2,706 | 2,770 | 3,183 | 3,889 | 31,632 |
| 2007 | 2,351 | 2,431 | 2,619 | 2,382 | 2,601 | 2,551 | 3,015 | 3,062 | 2,948 | 2,942 | 3,015 | 3,962 | 33,879 |
| 2008 | 3,237 | 3,081 | 3,189 | 2,582 | 2,706 | 2,601 | 2,691 | 2,430 | 2,981 | 3,150 | 2,911 | 2,761 | 34,320 |
| 2009 | 1,355 | 1,353 | 1,675 | 1,838 | 2,021 | 2,362 | 1,674 | 2,577 | 2,552 | 2,370 | 2,679 | 3,343 | 25,799 |
| 2010 | 1,927 | 1,655 | 2,154 | 2,269 | 2,264 | 2,124 | 1,973 | 2,473 | 2,780 | 2,826 | 3,470 | 3,783 | 29,698 |
| 2011 | 2,484 | 1,924 | 2,792 | 1,990 | 1,928 | 3,071 | 2,778 | 2,191 | 2,477 | 4,091 | 4,796 | 5,313 | 35,835 |
| 2012 | 4,002 | 3,408 | 4,070 | 3,057 | 3,198 | 2,891 | 1,790 | 2,243 | 2,439 | 2,868 | 3,894 | 4,241 | 38,101 |
| 2013 | 2,928 | 2,733 | 3,501 | 3,280 | 3,219 | 3,651 | 3,092 | 3,816 | 3,180 | 3,113 | 4,328 | 4,485 | 41,326 |
| 2014 | 2,824 | 3,258 | 4,052 | 3,831 | 4,084 | 3,891 | 3,276 | 3,438 | 3,460 | 3,797 | 5,190 | 5,625 | 46,726 |
| 2015 | 3,144 | 3,316 | 4,023 | 4,945 | 3,991 | 3,541 | 3,851 | 4,485 | 5,151 | 4,880 | 5,250 | 6,640 | 53,217 |
| 2016 | 3,663 | 3,948 | 4,730 | 4,327 | 4,003 | 4,515 | 4,412 | 3,756 | 4,127 | 4,042 | 4,694 | 5,574 | 51,791 |
| 2017 | 3,970 | 4,017 | 4,919 | 4,468 | 4,631 | 4,824 | 3,879 | 3,750 | 4,583 | 4,817 | 4,914 | 5,823 | 54,595 |
| 2018 | 3,488 | 3,595 | 4,573 | 4,110 | 3,657 | 3,318 | 4,447 | 3,622 | 3,807 | 3,671 | 3,988 | 3,734 | 46,010 |
| 2019 | 2,142 | 2,197 | 2,196 | 2,566 | 3,882 | 4,843 | 5,301 | 5,370 | 4,862 | 4,782 | 6,052 | 5,787 | 49,980 |
| 2020 | 3,833 | 4,963 | 3,006 | 1,710 | 3,800 | 3,990 | 3,807 | 3,384 | 3,666 | 5,396 | 4,432 | 6,166 | 48,153 |
| 2021 | 5,334 | 5,334 | 6,000 | 6,428 | 6,181 | 6,428 | 4,007 | 3,858 | 4,007 | 5,832 | 5,832 | 5,832 | 65,073 |
| 2022 | 5,117 | 5,117 | 5,756 | 5,625 | 5,417 | 5,417 | 4,542 | 4,717 | 4,542 | 5,600 | 5,376 | 5,824 | 63,050 |
| 2023 | 5,234 | 5,024 | 5,652 | 4,650 | 4,471 | 4,650 | 4,317 | 4,662 | 4,489 | 4,499 | 4,744 | 5,304 | 57,696 |
| 2024 | 4,966 | 4,966 | 5,164 | 5,123 | 5,328 | 5,328 | 5,024 | 5,627 | 4,622 | 6,422 | 7,539 | 7,818 | 67,927 |
| 2025 | 4,322 | 4,621 | 5,946 | 5,900 | 5,745 | 5,339 | 6,326 | 6,134 | 5,793 | 6,626 | 6,725 | 7,849 | 71,326 |
| 2026 | 6,595 | 6,087 | 6,595 | 5,760 | 6,266 | 5,705 | — | — | — | — | — | — | 37,008 |
Mercedes-Benz GLE-Class Sales in Canada
In Canada the GLE-Class and its M-Class predecessor peaked at 7,480 units in 2018. More recently Canadian sales have held in the low-to-mid 6,000s, with 6,266 units in 2024 and 6,239 in 2025. Through June 2026 Mercedes had sold 2,861 GLEs in Canada, down 11.4 percent on the 3,230 of the first half of 2025.
Mercedes-Benz GLE, Canada calendar-year unit sales, 2004–2026. 2026 is January–Jun (partial).
Annual sales
| Year | Units | YoY |
|---|---|---|
| 2004 | 1,823 | — |
| 2005 | 2,253 | ▲ 23.6% |
| 2006 | 2,172 | ▼ 3.6% |
| 2007 | 2,689 | ▲ 23.8% |
| 2008 | 3,525 | ▲ 31.1% |
| 2009 | 3,146 | ▼ 10.8% |
| 2010 | 3,871 | ▲ 23.0% |
| 2011 | 3,846 | ▼ 0.6% |
| 2012 | 5,539 | ▲ 44.0% |
| 2013 | 4,804 | ▼ 13.3% |
| 2014 | 5,532 | ▲ 15.2% |
| 2015 | 6,009 | ▲ 8.6% |
| 2016 | 7,281 | ▲ 21.2% |
| 2017 | 6,446 | ▼ 11.5% |
| 2018 | 7,480 | ▲ 16.0% |
| 2019 | 5,739 | ▼ 23.3% |
| 2020 | 6,149 | ▲ 7.1% |
| 2021 | 6,998 | ▲ 13.8% |
| 2022 | 6,582 | ▼ 5.9% |
| 2023 | 5,431 | ▼ 17.5% |
| 2024 | 6,266 | ▲ 15.4% |
| 2025 | 6,239 | ▼ 0.4% |
| 2026 (Jan–Jun) | 2,861 | ▼ 11.4% YTD |
Monthly sales
| Year | Jan | Feb | Mar | Apr | May | Jun | Jul | Aug | Sep | Oct | Nov | Dec | Total |
|---|---|---|---|---|---|---|---|---|---|---|---|---|---|
| 2004 | 99 | 148 | 136 | 181 | 138 | 122 | 118 | 122 | 132 | 143 | 207 | 277 | 1,823 |
| 2005 | 70 | 59 | 128 | 204 | 218 | 219 | 168 | 227 | 254 | 218 | 216 | 272 | 2,253 |
| 2006 | 116 | 138 | 178 | 146 | 175 | 269 | 160 | 183 | 185 | 233 | 171 | 218 | 2,172 |
| 2007 | 158 | 154 | 209 | 279 | 251 | 233 | 175 | 253 | 224 | 292 | 204 | 257 | 2,689 |
| 2008 | 158 | 233 | 287 | 265 | 321 | 318 | 386 | 250 | 272 | 328 | 349 | 358 | 3,525 |
| 2009 | 145 | 188 | 275 | 280 | 269 | 276 | 224 | 259 | 260 | 349 | 325 | 296 | 3,146 |
| 2010 | 248 | 274 | 364 | 320 | 338 | 283 | 138 | 310 | 310 | 381 | 419 | 486 | 3,871 |
| 2011 | 253 | 238 | 354 | 202 | 317 | 269 | 186 | 128 | 220 | 615 | 615 | 449 | 3,846 |
| 2012 | 484 | 602 | 630 | 537 | 475 | 514 | 335 | 225 | 466 | 414 | 455 | 402 | 5,539 |
| 2013 | 283 | 325 | 430 | 356 | 351 | 340 | 371 | 424 | 522 | 538 | 407 | 457 | 4,804 |
| 2014 | 283 | 437 | 587 | 487 | 509 | 497 | 461 | 509 | 436 | 460 | 491 | 375 | 5,532 |
| 2015 | 338 | 378 | 594 | 507 | 544 | 462 | 411 | 696 | 689 | 477 | 456 | 457 | 6,009 |
| 2016 | 605 | 525 | 797 | 722 | 681 | 701 | 577 | 647 | 667 | 481 | 444 | 434 | 7,281 |
| 2017 | 469 | 426 | 538 | 521 | 607 | 759 | 542 | 533 | 541 | 497 | 543 | 470 | 6,446 |
| 2018 | 490 | 579 | 851 | 895 | 805 | 540 | 569 | 473 | 591 | 778 | 419 | 490 | 7,480 |
| 2019 | 400 | 363 | 383 | 435 | 435 | 397 | 586 | 586 | 533 | 582 | 506 | 533 | 5,739 |
| 2020 | 548 | 499 | 550 | 383 | 348 | 384 | 531 | 507 | 509 | 649 | 590 | 651 | 6,149 |
| 2021 | 538 | 538 | 621 | 692 | 629 | 693 | 535 | 561 | 536 | 543 | 543 | 569 | 6,998 |
| 2022 | 518 | 493 | 568 | 730 | 730 | 767 | 532 | 612 | 560 | 357 | 357 | 358 | 6,582 |
| 2023 | 446 | 405 | 468 | 500 | 551 | 552 | 423 | 487 | 425 | 409 | 391 | 374 | 5,431 |
| 2024 | 546 | 521 | 522 | 596 | 596 | 542 | 448 | 448 | 410 | 588 | 511 | 538 | 6,266 |
| 2025 | 566 | 514 | 541 | 553 | 527 | 529 | 420 | 400 | 402 | 642 | 530 | 615 | 6,239 |
| 2026 | 485 | 434 | 476 | 486 | 496 | 484 | — | — | — | — | — | — | 2,861 |







