
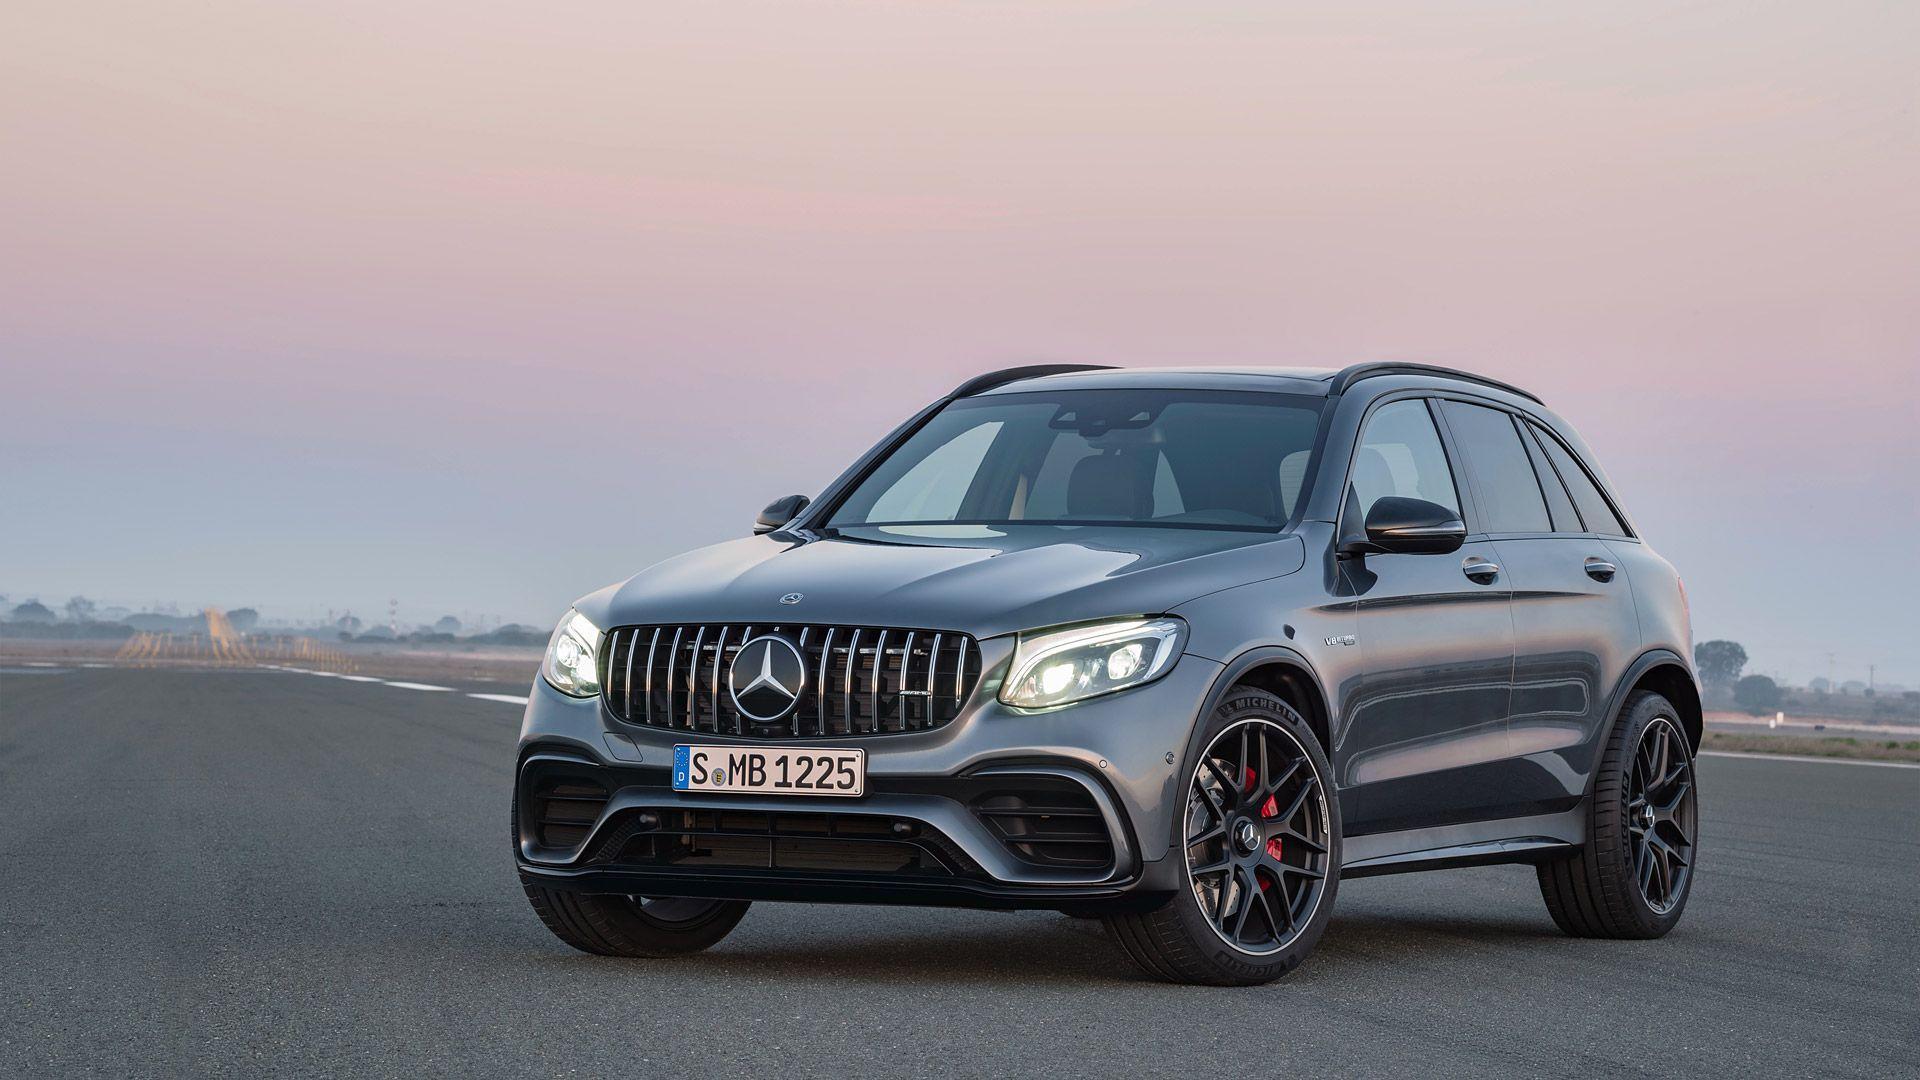
Mercedes-Benz GLC-Class
Here you will find yearly and monthly United States and Canadian sales figures for the Mercedes-Benz GLC-Class. The GLC is Mercedes-Benz’s compact luxury SUV and one of the brand’s best-selling models worldwide. This chart carries the full lineage of the nameplate: the figures begin with the GLK-Class that Mercedes introduced for 2009, and continue with the GLC that replaced it for the 2016 model year when the company realigned its SUV naming. The GLC competes with the BMW X3, Audi Q5, Lexus NX, Volvo XC60, and Genesis GV70.
- Class: Compact luxury SUV, also sold in a lower-roof Coupe body
- Engines: GLC 300 and GLC 300 4MATIC use a 2.0-liter turbocharged inline-four with mild-hybrid drive rated at 255 horsepower and 295 lb-ft; the GLC 350e 4MATIC plug-in hybrid is rated at 313 horsepower and 406 lb-ft combined; the AMG GLC 43 makes 416 horsepower and 369 lb-ft; the AMG GLC 63 S E Performance makes 671 horsepower and 752 lb-ft
- Transmission: 9G-TRONIC nine-speed automatic
- Drivetrain: Rear-wheel drive on the GLC 300, 4MATIC all-wheel drive on every other model
- Trims: GLC 300, GLC 300 4MATIC, GLC 350e 4MATIC, AMG GLC 43 and AMG GLC 63 S E Performance
- Chief rivals: BMW X3, Audi Q5, Lexus NX, Volvo XC60, Genesis GV70
Mercedes-Benz quotes 5.9 seconds to 60 mph for the rear-drive GLC 300 and 3.5 seconds for the AMG GLC 63 S E Performance, with the GLC 300 starting at $49,550.
Mercedes-Benz GLC-Class Sales in the United States
In the United States the GLC-Class has been a steady high-volume performer. GLK-era sales built from about 21,900 units in 2009 to 35,000 by 2014, and the switch to the GLC lifted the nameplate to a peak of 72,439 in 2019. After pandemic-era swings and a changeover lull in 2023, US volume recovered to 64,164 in 2024 and climbed 12.1 percent to 71,941 in 2025, within 500 units of the 2019 record, ending the year with its best month on this chart at 8,446 in December. Mercedes has kept that momentum into 2026, delivering 34,895 GLCs through June, up 24.0 percent on the 28,144 of the first half of 2025.
Mercedes-Benz GLC, United States calendar-year unit sales, 2009–2026. 2026 is January–Jun (partial).
Annual sales
| Year | Units | YoY |
|---|---|---|
| 2009 | 21,944 | — |
| 2010 | 20,946 | ▼ 4.5% |
| 2011 | 24,310 | ▲ 16.1% |
| 2012 | 29,364 | ▲ 20.8% |
| 2013 | 32,553 | ▲ 10.9% |
| 2014 | 35,000 | ▲ 7.5% |
| 2015 | 27,902 | ▼ 20.3% |
| 2016 | 47,872 | ▲ 71.6% |
| 2017 | 48,643 | ▲ 1.6% |
| 2018 | 69,729 | ▲ 43.3% |
| 2019 | 72,439 | ▲ 3.9% |
| 2020 | 52,626 | ▼ 27.4% |
| 2021 | 51,805 | ▼ 1.6% |
| 2022 | 65,531 | ▲ 26.5% |
| 2023 | 40,250 | ▼ 38.6% |
| 2024 | 64,164 | ▲ 59.4% |
| 2025 | 71,941 | ▲ 12.1% |
| 2026 (Jan–Jun) | 34,895 | ▲ 24.0% YTD |
Monthly sales
| Year | Jan | Feb | Mar | Apr | May | Jun | Jul | Aug | Sep | Oct | Nov | Dec | Total |
|---|---|---|---|---|---|---|---|---|---|---|---|---|---|
| 2009 | 1,300 | 1,918 | 2,598 | 1,869 | 1,759 | 1,539 | 1,809 | 1,665 | 1,558 | 1,833 | 1,724 | 2,372 | 21,944 |
| 2010 | 1,803 | 2,126 | 2,333 | 1,799 | 1,814 | 1,487 | 1,805 | 1,426 | 1,685 | 1,394 | 1,590 | 1,684 | 20,946 |
| 2011 | 1,625 | 1,853 | 1,963 | 1,927 | 2,214 | 1,930 | 1,628 | 1,933 | 1,934 | 2,494 | 2,463 | 2,346 | 24,310 |
| 2012 | 1,976 | 1,630 | 2,422 | 2,067 | 2,133 | 2,052 | 1,880 | 2,775 | 3,206 | 2,943 | 3,276 | 3,004 | 29,364 |
| 2013 | 2,396 | 2,420 | 2,694 | 2,702 | 2,728 | 2,806 | 2,780 | 2,372 | 2,387 | 2,695 | 3,344 | 3,229 | 32,553 |
| 2014 | 2,302 | 2,624 | 3,345 | 3,144 | 3,457 | 3,766 | 3,870 | 3,075 | 2,646 | 2,588 | 2,326 | 1,857 | 35,000 |
| 2015 | 1,398 | 1,781 | 2,478 | 3,071 | 2,558 | 2,549 | 2,318 | 2,168 | 2,056 | 1,943 | 1,216 | 4,366 | 27,902 |
| 2016 | 2,849 | 3,278 | 4,871 | 4,439 | 4,183 | 3,771 | 3,411 | 4,715 | 4,873 | 3,588 | 3,876 | 4,018 | 47,872 |
| 2017 | 3,065 | 2,765 | 3,126 | 3,305 | 3,737 | 3,729 | 4,002 | 4,498 | 4,662 | 4,245 | 5,357 | 6,152 | 48,643 |
| 2018 | 4,793 | 5,403 | 6,064 | 5,853 | 6,424 | 6,608 | 4,446 | 4,926 | 6,070 | 5,649 | 6,199 | 7,294 | 69,729 |
| 2019 | 4,908 | 4,176 | 6,282 | 5,378 | 5,378 | 6,568 | 5,539 | 6,336 | 6,840 | 7,083 | 7,515 | 6,436 | 72,439 |
| 2020 | 4,254 | 5,508 | 3,336 | 1,703 | 3,784 | 3,974 | 4,007 | 3,562 | 3,859 | 6,288 | 5,165 | 7,186 | 52,626 |
| 2021 | 4,982 | 4,982 | 5,605 | 4,923 | 4,734 | 4,923 | 2,694 | 2,594 | 2,694 | 4,558 | 4,558 | 4,558 | 51,805 |
| 2022 | 5,411 | 5,411 | 6,088 | 6,545 | 6,302 | 6,302 | 6,403 | 6,650 | 6,403 | 3,339 | 3,205 | 3,472 | 65,531 |
| 2023 | 1,200 | 1,152 | 1,296 | 4,812 | 4,627 | 4,812 | 3,687 | 3,982 | 3,835 | 3,568 | 3,568 | 3,711 | 40,250 |
| 2024 | 2,834 | 2,834 | 2,947 | 5,679 | 5,906 | 5,906 | 6,678 | 7,480 | 6,144 | 5,236 | 6,146 | 6,374 | 64,164 |
| 2025 | 4,057 | 4,325 | 5,588 | 4,797 | 4,914 | 4,463 | 6,584 | 7,421 | 6,976 | 7,132 | 7,238 | 8,446 | 71,941 |
| 2026 | 5,603 | 5,172 | 5,603 | 6,016 | 6,544 | 5,957 | — | — | — | — | — | — | 34,895 |
Mercedes-Benz GLC-Class Sales in Canada
In Canada the GLC-Class reached a high of 10,883 units in 2019 and remains one of Mercedes’ stronger SUV lines. Canadian sales grew from 7,004 in 2024 to 8,747 in 2025, one of the nameplate’s best years, and 2026 has continued in that vein with 4,642 units through June, up 10.2 percent on the 4,212 of the first half of 2025.
Mercedes-Benz GLC, Canada calendar-year unit sales, 2009–2026. 2026 is January–Jun (partial).
Annual sales
| Year | Units | YoY |
|---|---|---|
| 2009 | 5,012 | — |
| 2010 | 5,852 | ▲ 16.8% |
| 2011 | 5,294 | ▼ 9.5% |
| 2012 | 5,279 | ▼ 0.3% |
| 2013 | 5,445 | ▲ 3.1% |
| 2014 | 5,599 | ▲ 2.8% |
| 2015 | 5,304 | ▼ 5.3% |
| 2016 | 4,774 | ▼ 10.0% |
| 2017 | 8,742 | ▲ 83.1% |
| 2018 | 8,982 | ▲ 2.7% |
| 2019 | 10,883 | ▲ 21.2% |
| 2020 | 6,982 | ▼ 35.8% |
| 2021 | 6,887 | ▼ 1.4% |
| 2022 | 8,661 | ▲ 25.8% |
| 2023 | 6,786 | ▼ 21.6% |
| 2024 | 7,004 | ▲ 3.2% |
| 2025 | 8,747 | ▲ 24.9% |
| 2026 (Jan–Jun) | 4,642 | ▲ 10.2% YTD |
Monthly sales
| Year | Jan | Feb | Mar | Apr | May | Jun | Jul | Aug | Sep | Oct | Nov | Dec | Total |
|---|---|---|---|---|---|---|---|---|---|---|---|---|---|
| 2009 | 237 | 281 | 424 | 601 | 555 | 564 | 432 | 322 | 513 | 375 | 349 | 359 | 5,012 |
| 2010 | 391 | 327 | 507 | 604 | 526 | 720 | 481 | 466 | 460 | 420 | 492 | 458 | 5,852 |
| 2011 | 208 | 328 | 483 | 455 | 617 | 603 | 478 | 476 | 394 | 460 | 387 | 405 | 5,294 |
| 2012 | 315 | 357 | 537 | 436 | 493 | 545 | 386 | 313 | 457 | 447 | 431 | 562 | 5,279 |
| 2013 | 256 | 395 | 779 | 610 | 565 | 619 | 460 | 383 | 549 | 0 | 413 | 416 | 5,445 |
| 2014 | 287 | 339 | 617 | 406 | 555 | 582 | 297 | 321 | 649 | 434 | 628 | 484 | 5,599 |
| 2015 | 280 | 220 | 565 | 512 | 564 | 570 | 430 | 440 | 529 | 351 | 256 | 587 | 5,304 |
| 2016 | 274 | 247 | 304 | 430 | 389 | 339 | 322 | 411 | 407 | 581 | 583 | 487 | 4,774 |
| 2017 | 428 | 510 | 724 | 567 | 783 | 861 | 840 | 707 | 867 | 803 | 967 | 685 | 8,742 |
| 2018 | 610 | 634 | 715 | 813 | 814 | 1,052 | 745 | 429 | 790 | 787 | 765 | 828 | 8,982 |
| 2019 | 839 | 763 | 803 | 1,019 | 1,019 | 928 | 909 | 909 | 829 | 1,029 | 895 | 941 | 10,883 |
| 2020 | 611 | 555 | 612 | 488 | 444 | 489 | 795 | 759 | 761 | 504 | 458 | 506 | 6,982 |
| 2021 | 506 | 506 | 583 | 760 | 690 | 761 | 557 | 583 | 558 | 453 | 453 | 477 | 6,887 |
| 2022 | 632 | 602 | 693 | 898 | 898 | 942 | 674 | 775 | 708 | 613 | 613 | 613 | 8,661 |
| 2023 | 426 | 387 | 446 | 485 | 534 | 536 | 799 | 918 | 800 | 508 | 485 | 462 | 6,786 |
| 2024 | 562 | 536 | 538 | 709 | 709 | 647 | 636 | 636 | 580 | 521 | 453 | 477 | 7,004 |
| 2025 | 661 | 601 | 632 | 796 | 760 | 762 | 792 | 756 | 757 | 801 | 662 | 767 | 8,747 |
| 2026 | 722 | 646 | 710 | 803 | 875 | 886 | — | — | — | — | — | — | 4,642 |







