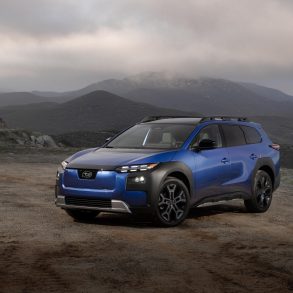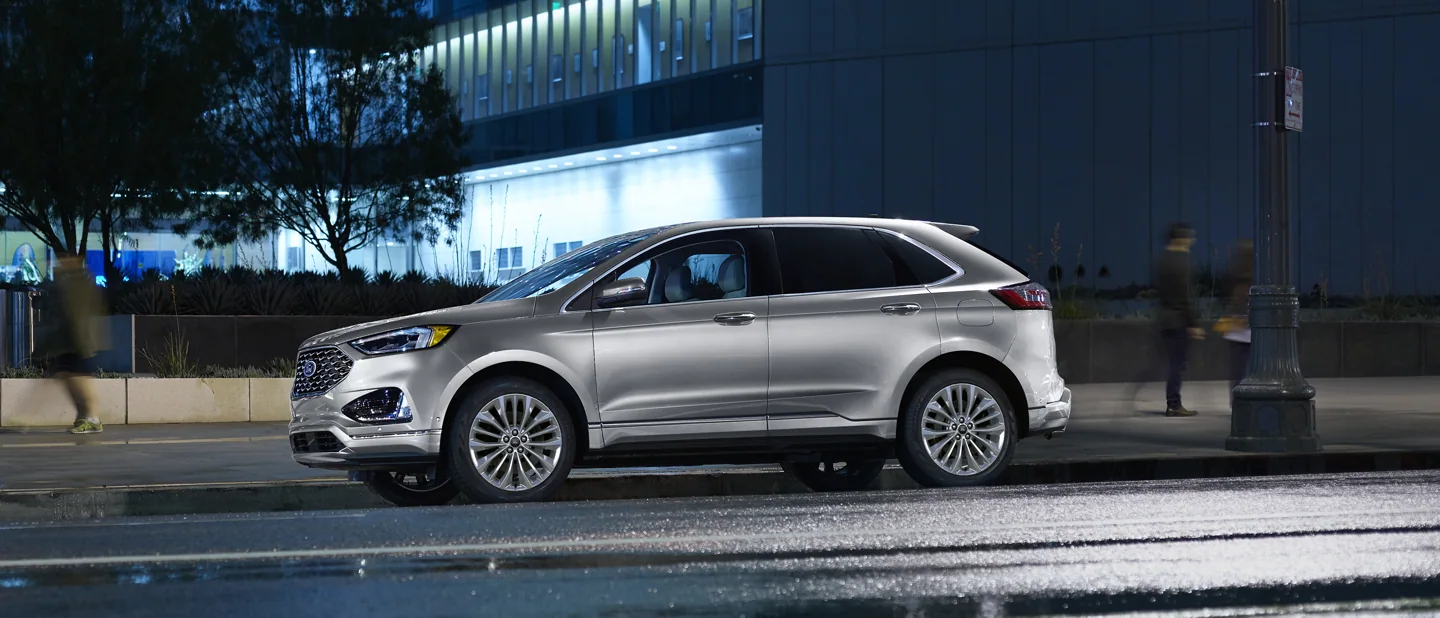
Ford Edge
Here you will find monthly and yearly United States and Canadian sales figures for the Ford Edge. The Edge arrived for the 2007 model year as a two-row midsize crossover positioned between the Escape and the Explorer. Ford has since phased out the Edge: 2024 was its final model year, and the last new examples were reported sold in the first four months of 2025.
- Class: Midsize two-row crossover, five seats (production ended; 2024 was the final model year)
- Engine: 2.0-liter turbocharged four-cylinder in the final 2024 model year; a 2.7-liter turbocharged V6 also appears in EPA listings for 2024
- Transmission: Eight-speed automatic
- Drivetrain: All-wheel drive on every 2024 Edge
- EPA fuel economy: 2.0-liter AWD rated at 21 mpg city, 28 highway and 23 combined for 2024
- Chief rivals: Chevrolet Blazer, Hyundai Santa Fe, Nissan Murano, Honda Passport
Ford Edge Sales in the United States
The Ford Edge chart for the United States opens with 2,201 sales in 2006, its launch year, and 130,125 in 2007, the first full year. Volume dipped to 88,548 in 2009, and the Edge then climbed to more than 120,000 a year for most of the next decade, peaking at 142,603 in 2017 and holding at 138,514 in 2019. Sales fell to 108,886 in 2020 and about 85,000 in each of 2021 and 2022, then rebounded to 106,098 in 2023. The wind-down shows clearly in 2024: March brought 14,392 sales, December just 1,219, and the year closed at 66,436, down 37.4 percent on 2023. The final 3,040 were reported between January and April 2025, and the chart reads zero from May 2025 onward.
Ford Edge, United States calendar-year unit sales, 2006–2026. 2026 is January–Sep (partial).
Annual sales
| Year | Units | YoY |
|---|---|---|
| 2006 | 2,201 | — |
| 2007 | 130,125 | ▲ 5,812.1% |
| 2008 | 110,798 | ▼ 14.9% |
| 2009 | 88,548 | ▼ 20.1% |
| 2010 | 118,637 | ▲ 34.0% |
| 2011 | 121,702 | ▲ 2.6% |
| 2012 | 127,969 | ▲ 5.1% |
| 2013 | 129,109 | ▲ 0.9% |
| 2014 | 108,864 | ▼ 15.7% |
| 2015 | 124,120 | ▲ 14.0% |
| 2016 | 134,588 | ▲ 8.4% |
| 2017 | 142,603 | ▲ 6.0% |
| 2018 | 134,122 | ▼ 5.9% |
| 2019 | 138,514 | ▲ 3.3% |
| 2020 | 108,886 | ▼ 21.4% |
| 2021 | 85,225 | ▼ 21.7% |
| 2022 | 85,465 | ▲ 0.3% |
| 2023 | 106,098 | ▲ 24.1% |
| 2024 | 66,436 | ▼ 37.4% |
| 2025 | 3,040 | ▼ 95.4% |
| 2026 (Jan–Sep) | 0 | ▼ 100.0% YTD |
Monthly sales
| Year | Jan | Feb | Mar | Apr | May | Jun | Jul | Aug | Sep | Oct | Nov | Dec | Total |
|---|---|---|---|---|---|---|---|---|---|---|---|---|---|
| 2006 | — | — | — | — | — | — | — | — | — | — | — | 2,201 | 2,201 |
| 2007 | 5,586 | 7,977 | 10,915 | 9,134 | 12,701 | 12,470 | 9,096 | 10,165 | 11,632 | 14,133 | 12,594 | 13,722 | 130,125 |
| 2008 | 10,888 | 11,638 | 13,508 | 10,333 | 12,367 | 9,993 | 8,508 | 9,962 | 6,633 | 5,951 | 5,080 | 5,937 | 110,798 |
| 2009 | 4,973 | 5,214 | 6,134 | 7,628 | 9,582 | 7,729 | 7,857 | 10,845 | 4,477 | 8,185 | 6,461 | 9,463 | 88,548 |
| 2010 | 6,243 | 8,694 | 10,254 | 9,003 | 13,660 | 8,173 | 9,342 | 8,951 | 12,815 | 10,185 | 10,025 | 11,292 | 118,637 |
| 2011 | 8,918 | 10,138 | 12,388 | 9,361 | 9,486 | 9,663 | 9,731 | 9,414 | 11,680 | 9,161 | 9,685 | 12,077 | 121,702 |
| 2012 | 8,315 | 10,535 | 14,058 | 10,520 | 11,749 | 10,259 | 9,177 | 11,603 | 10,771 | 8,406 | 10,142 | 12,434 | 127,969 |
| 2013 | 9,614 | 9,683 | 12,237 | 10,357 | 13,501 | 13,579 | 10,541 | 11,529 | 8,548 | 8,681 | 8,761 | 12,078 | 129,109 |
| 2014 | 9,411 | 10,965 | 12,862 | 7,374 | 10,756 | 9,700 | 8,564 | 8,724 | 7,695 | 7,225 | 7,648 | 7,940 | 108,864 |
| 2015 | 7,581 | 6,526 | 9,405 | 13,097 | 14,399 | 12,587 | 10,020 | 11,832 | 10,262 | 10,011 | 8,137 | 10,263 | 124,120 |
| 2016 | 9,533 | 12,455 | 14,005 | 11,484 | 12,384 | 11,177 | 10,512 | 11,204 | 10,322 | 8,064 | 10,757 | 12,691 | 134,588 |
| 2017 | 9,091 | 11,126 | 11,730 | 12,147 | 13,752 | 13,411 | 11,156 | 10,838 | 11,476 | 11,036 | 13,180 | 13,660 | 142,603 |
| 2018 | 8,519 | 10,216 | 13,919 | 11,240 | 12,332 | 11,822 | 10,150 | 11,563 | 9,177 | 10,264 | 9,787 | 15,133 | 134,122 |
| 2019 | 10,171 | 9,764 | 10,985 | 10,827 | 12,493 | 9,994 | 12,059 | 13,506 | 11,094 | 12,388 | 12,846 | 12,387 | 138,514 |
| 2020 | 9,614 | 12,446 | 7,539 | 3,789 | 8,421 | 8,842 | 9,191 | 8,170 | 8,850 | 10,387 | 9,096 | 12,541 | 108,886 |
| 2021 | 6,837 | 6,495 | 8,818 | 8,046 | 5,077 | 4,082 | 3,349 | 5,509 | 6,738 | 9,329 | 9,489 | 11,456 | 85,225 |
| 2022 | 7,355 | 7,009 | 12,048 | 11,298 | 9,202 | 4,541 | 5,334 | 5,290 | 5,546 | 5,133 | 5,816 | 6,893 | 85,465 |
| 2023 | 4,969 | 6,513 | 8,800 | 11,034 | 7,685 | 7,483 | 9,633 | 6,259 | 8,325 | 11,015 | 9,939 | 14,443 | 106,098 |
| 2024 | 7,402 | 13,363 | 14,392 | 7,858 | 4,808 | 3,856 | 3,981 | 2,858 | 2,894 | 2,144 | 1,661 | 1,219 | 66,436 |
| 2025 | 633 | 797 | 648 | 962 | 0 | 0 | 0 | 0 | 0 | 0 | 0 | 0 | 3,040 |
| 2026 | 0 | 0 | 0 | 0 | 0 | 0 | 0 | 0 | 0 | — | — | — | 0 |
Ford Edge Sales in Canada
In Canada the Edge chart starts with 161 sales in 2006 and 10,349 in 2007, then grew to a peak of 20,517 in 2016 and stayed close to 20,000 a year through 2019. Volume dropped to 13,214 in 2020 and held between 11,830 and 14,008 from 2021 to 2023. The 2024 total fell to 9,553 as production wound down, and 2025 brought only 615, 400 of them in the first quarter. The chart reads zero for every reported month of 2026.
Ford Edge, Canada calendar-year unit sales, 2006–2026. 2026 is January–Jun (partial).
Annual sales
| Year | Units | YoY |
|---|---|---|
| 2006 | 161 | — |
| 2007 | 10,349 | ▲ 6,328.0% |
| 2008 | 11,834 | ▲ 14.3% |
| 2009 | 12,060 | ▲ 1.9% |
| 2010 | 17,040 | ▲ 41.3% |
| 2011 | 15,633 | ▼ 8.3% |
| 2012 | 18,837 | ▲ 20.5% |
| 2013 | 17,274 | ▼ 8.3% |
| 2014 | 17,940 | ▲ 3.9% |
| 2015 | 16,580 | ▼ 7.6% |
| 2016 | 20,517 | ▲ 23.7% |
| 2017 | 19,967 | ▼ 2.7% |
| 2018 | 19,156 | ▼ 4.1% |
| 2019 | 19,856 | ▲ 3.7% |
| 2020 | 13,214 | ▼ 33.5% |
| 2021 | 11,830 | ▼ 10.5% |
| 2022 | 13,213 | ▲ 11.7% |
| 2023 | 14,008 | ▲ 6.0% |
| 2024 | 9,553 | ▼ 31.8% |
| 2025 | 615 | ▼ 93.6% |
| 2026 (Jan–Jun) | 0 | ▼ 100.0% YTD |
Monthly sales
| Year | Jan | Feb | Mar | Apr | May | Jun | Jul | Aug | Sep | Oct | Nov | Dec | Total |
|---|---|---|---|---|---|---|---|---|---|---|---|---|---|
| 2006 | 0 | 0 | 0 | 0 | 0 | 0 | 0 | 0 | 0 | 56 | 53 | 52 | 161 |
| 2007 | 314 | 420 | 905 | 910 | 1,151 | 1,314 | 1,124 | 1,239 | 489 | 852 | 754 | 877 | 10,349 |
| 2008 | 788 | 832 | 1,048 | 1,169 | 1,336 | 1,348 | 934 | 1,345 | 594 | 709 | 784 | 947 | 11,834 |
| 2009 | 626 | 532 | 824 | 1,031 | 1,144 | 1,662 | 1,395 | 946 | 795 | 975 | 976 | 1,154 | 12,060 |
| 2010 | 723 | 1,084 | 1,221 | 1,508 | 1,889 | 1,448 | 1,447 | 1,371 | 2,176 | 1,367 | 1,389 | 1,417 | 17,040 |
| 2011 | 751 | 845 | 1,427 | 1,283 | 1,257 | 2,251 | 1,631 | 1,320 | 1,557 | 1,128 | 1,051 | 1,132 | 15,633 |
| 2012 | 910 | 655 | 1,549 | 1,601 | 2,625 | 2,747 | 2,350 | 1,356 | 1,509 | 1,249 | 1,275 | 1,011 | 18,837 |
| 2013 | 789 | 783 | 1,385 | 1,655 | 1,960 | 2,612 | 1,561 | 1,505 | 1,568 | 1,294 | 1,252 | 910 | 17,274 |
| 2014 | 843 | 931 | 1,488 | 1,140 | 2,089 | 2,607 | 1,769 | 1,653 | 1,659 | 1,458 | 1,207 | 1,096 | 17,940 |
| 2015 | 750 | 514 | 602 | 1,876 | 2,133 | 2,885 | 2,019 | 1,717 | 1,838 | 973 | 754 | 519 | 16,580 |
| 2016 | 1,139 | 1,200 | 2,259 | 2,091 | 2,333 | 2,169 | 1,717 | 1,682 | 1,980 | 1,488 | 1,377 | 1,082 | 20,517 |
| 2017 | 972 | 944 | 1,489 | 2,551 | 2,672 | 2,091 | 1,713 | 1,754 | 1,850 | 1,446 | 1,538 | 947 | 19,967 |
| 2018 | 874 | 1,003 | 1,602 | 2,437 | 2,070 | 2,118 | 1,575 | 1,694 | 1,459 | 1,489 | 2,034 | 801 | 19,156 |
| 2019 | 1,347 | 1,225 | 1,287 | 2,306 | 2,306 | 2,099 | 1,784 | 1,784 | 1,623 | 1,471 | 1,279 | 1,345 | 19,856 |
| 2020 | 904 | 821 | 905 | 987 | 898 | 989 | 1,467 | 1,401 | 1,402 | 1,182 | 1,075 | 1,183 | 13,214 |
| 2021 | 801 | 801 | 923 | 840 | 763 | 841 | 1,119 | 1,172 | 1,120 | 1,132 | 1,132 | 1,186 | 11,830 |
| 2022 | 854 | 814 | 937 | 1,629 | 1,629 | 1,707 | 1,048 | 1,205 | 1,101 | 763 | 763 | 763 | 13,213 |
| 2023 | 940 | 855 | 984 | 1,248 | 1,373 | 1,375 | 1,184 | 1,362 | 1,185 | 1,222 | 1,167 | 1,113 | 14,008 |
| 2024 | 622 | 594 | 595 | 933 | 933 | 849 | 967 | 967 | 881 | 794 | 691 | 727 | 9,553 |
| 2025 | 139 | 126 | 135 | 34 | 32 | 34 | 30 | 29 | 31 | 8 | 7 | 10 | 615 |
| 2026 | 0 | 0 | 0 | 0 | 0 | 0 | — | — | — | — | — | — | 0 |