
Chrysler Sales Data, Trends, Analysis & Current Lineup for the U.S Automotive Market
This is your hub for all of the Chrysler sales data for the U.S market. Chrysler is one of the largest automobile manufacturers in the world. It is also one of the so-called “Big-Three” automobile manufacturers in the United States along with General Motors and Ford. Since their inception in the 1920s, Chrysler has quickly made a reputation for producing vehicles with sleek and luxurious design. Chrysler engineers and designers have always used innovative technologies for developing each subsequent models so their vehicles can get better and better.
Today, Chrysler has become the representation of the American spirit. The company has always pushed itself to become better in developing high-quality vehicles that looks great and expertly designed. The brand’s impact on America’s modern car culture can also be felt on their focus on family vehicles. They were the first to adopt the minivan concept in the 1980s and revolutionized it to become a prime piece of family transportation and resulted to a new arm of automobiles.
Please note: Fiat Chrysler Automobiles stopped reporting monthly US sales figures in Q3 of 2019 and switched to reporting its US sales quarterly. From Q3 of 2019 onwards you will find Q1 data in the March data field, Q2 data in June, Q3 data in September and Q4 data in December.
Chrysler U.S Sales Figures & Recent Highlights
The overall sales of the Chrysler company has been very positive so far in the US. It’s no wonder why the company is one of the “Big Three” automobile manufacturers in the United States. Things are not the same though for the Chrysler branded vehicles. As of late, the sales of the Chrysler brand alone has dropped continuously every year. After peaking in 2005 for selling 641,406 Chrysler vehicles, the brand saw its sales figures dropped for more than 10 years now. In 2019, the Chrysler brand only sold 126,972 vehicles in the US, its lowest mark since 1981.
Chrysler sales in the U.S. decreased by 34.7% in 2020, to 234,940 vehicles. This was due to the COVID-19 pandemic, which caused a decline in demand for new cars. Chrysler sales in the U.S. decreased by 33.1% in 2021, to 154,275 vehicles. This was due to the chip shortage, which limited the production of new cars. Chrysler sales in the U.S. increased by 107.4% in 2022, to 321,854 vehicles. This was due to the easing of the chip shortage and the launch of new models, such as the Chrysler Pacifica Hybrid minivan. Chrysler sales in the U.S. decreased by 13.9% in the first quarter of 2023, to 71,277 vehicles. This was due to the ongoing chip shortage and rising inflation.
Overall, Chrysler is facing some challenges in the United States. The brand is seeing declining sales due to the chip shortage and rising inflation. However, Chrysler is investing heavily in new products, such as the Pacifica Hybrid minivan, and it is hoping that these products will help the brand to regain market share. The Chrysler Pacifica Hybrid minivan was named the 2023 Green Car of Texas by the Texas Auto Writers Association. The Pacifica Hybrid is powered by a hybrid powertrain that delivers up to 84 MPGe in city driving.
Chrysler Monthly Sales Data in the United States
Below we have a table that shows Chrysler sales for the United States automotive market, but this time it is broken out by month. This is on a unit basis. This is Chrysler new vehicle sales in the US.
Chrysler Annual Sales, Growth & Market Share in the United States
Below we have a table that shows total Chrysler sales volumes for the US automotive market, broken out by year. This data captures all Chrysler vehicle sales for the entire United States automotive market.
| Year | Sales | YOY Change | US Marketshare | Marketshare Change |
|---|---|---|---|---|
| 1979 | 0 | 0.00 | 0.00 | 0.00 |
| 1980 | 112,924 | 0.00 | 11.38 | 100.00 |
| 1981 | 81,259 | -28.04 | 6.31 | -80.40 |
| 1982 | 178,970 | 120.25 | 14.64 | 56.89 |
| 1983 | 262,037 | 46.41 | 15.89 | 7.91 |
| 1984 | 243,593 | -7.04 | 11.54 | -37.70 |
| 1985 | 387,103 | 58.91 | 10.44 | -10.56 |
| 1986 | 356,460 | -7.92 | 8.95 | -16.64 |
| 1987 | 306,342 | -14.06 | 8.40 | -6.53 |
| 1988 | 279,123 | -8.89 | 7.24 | -16.10 |
| 1989 | 196,125 | -29.74 | 5.63 | -28.58 |
| 1990 | 183,095 | -6.64 | 6.08 | 7.50 |
| 1991 | 92,507 | -49.48 | 3.38 | -80.21 |
| 1992 | 100,107 | 8.22 | 3.86 | 12.45 |
| 1993 | 143,881 | 43.73 | 5.23 | 26.26 |
| 1994 | 133,652 | -7.11 | 5.55 | 5.84 |
| 1995 | 139,347 | 4.26 | 5.11 | -8.73 |
| 1996 | 123,340 | -11.49 | 4.47 | -14.25 |
| 1997 | 188,929 | 53.18 | 6.51 | 31.29 |
| 1998 | 500,508 | 164.92 | 16.03 | 59.42 |
| 1999 | 334,361 | -33.20 | 11.28 | -42.11 |
| 2000 | 271,739 | -18.73 | 9.70 | -16.37 |
| 2001 | 207,645 | -23.59 | 9.13 | -6.19 |
| 2002 | 183,250 | -11.75 | 7.71 | -18.49 |
| 2003 | 130,237 | -28.93 | 6.44 | -19.66 |
| 2004 | 110,151 | -15.42 | 7.87 | 18.19 |
| 2005 | 641,406 | 482.30 | 3.75 | -110.08 |
| 2006 | 604,874 | -5.70 | 3.63 | -3.25 |
| 2007 | 543,011 | -10.23 | 3.35 | -8.43 |
| 2008 | 334,208 | -38.45 | 2.51 | -33.52 |
| 2009 | 177,015 | -47.03 | 1.68 | -48.80 |
| 2010 | 198,446 | 12.11 | 1.69 | 0.51 |
| 2011 | 221,346 | 11.54 | 1.71 | 1.17 |
| 2012 | 334,975 | 51.34 | 2.15 | 20.16 |
| 2013 | 302,492 | -9.70 | 1.93 | -11.15 |
| 2014 | 308,785 | 2.08 | 1.87 | -3.36 |
| 2015 | 324,846 | 5.20 | 1.86 | -0.60 |
| 2016 | 239,492 | -26.28 | 1.36 | -36.37 |
| 2017 | 188,545 | -21.27 | 1.09 | -24.73 |
| 2018 | 165,964 | -11.98 | 0.96 | -14.26 |
| 2019 | 126,972 | -23.49 | 0.74 | -28.27 |
| 2020 | 110,285 | -13.14 | 0.75 | 0.68 |
| 2021 | 115,002 | 4.28 | 0.77 | 2.51 |
| 2022 | 112,714 | -1.99 | 0.82 | 6.61 |
| 2023 | 133,839 | 18.74 | 0.86 | 4.41 |
| 2024 | 34,807 | 0.00 | 0.92 | 0.00 |
Chrysler U.S Annual Sales Units & Growth Chart
Below is a visual representation of Chrysler’s U.S sales units over time. We have both the Chrysler sales units and the growth in the United States market. Click on the items in the legend to see each series by itself.
Chrysler U.S Growth Rate & Market Share Chart
Below is the annual growth rate for the Chrysler brand in the United States, shown against the Chrysler’s marketshare changes in the United States. This gives you a good look into how Chrysler has faired against the other brands in terms of absolute sales and effect on marketshare. Click on the items in the legend to see each series by itself.
The Best-Selling Chrysler Cars & SUVs in the United States
Here are the best-selling Chrysler cars & SUVs in the United States and it is dominated by minivans. Who said Chrysler didn’t make exciting cars anymore?
- Pacifica (98,625 units sold in 2022): The Chrysler Pacifica is a minivan that is known for its comfortable ride, spacious interior, and family-friendly features. It is available with a 3.6L V6 engine that produces 287 horsepower and 262 lb-ft of torque.
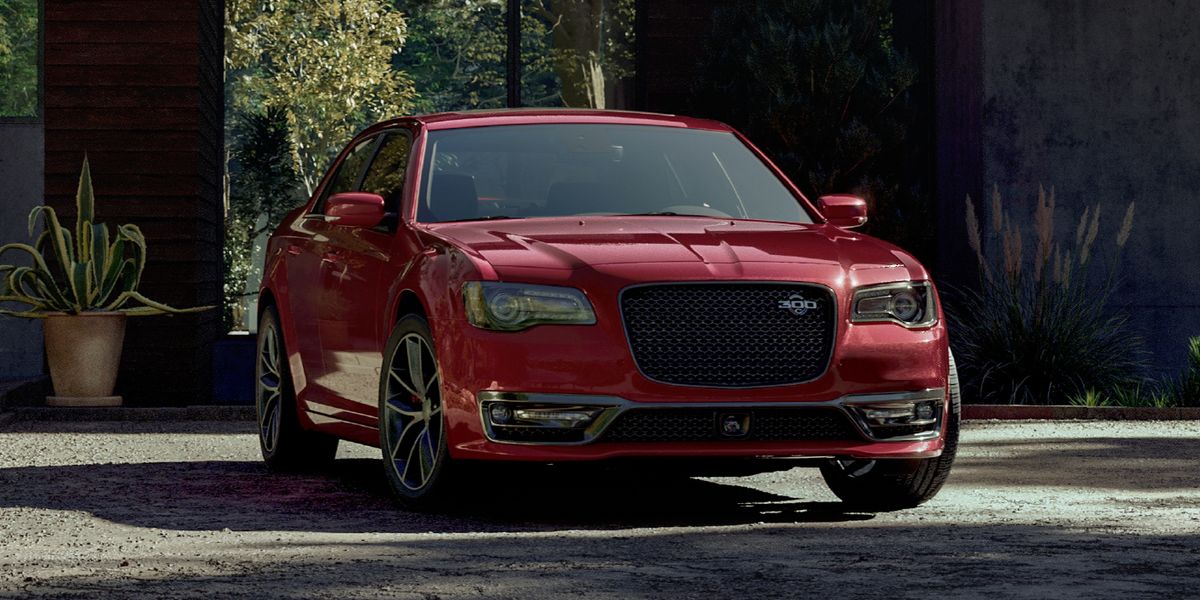
- 300 (14,087 units sold in 2022): The Chrysler 300 is a full-size sedan that is known for its powerful engines, luxurious interior, and comfortable ride. It is available with a 3.6L V6 engine that produces 292 horsepower and 260 lb-ft of torque, or a 5.7L V8 engine that produces 363 horsepower and 394 lb-ft of torque.
The Current Chrysler Model Lineup & Prices in the U.S
It is slim pickings for the current Chrysler lineup with only the Pacifica and 300 available for sale in the U.S.
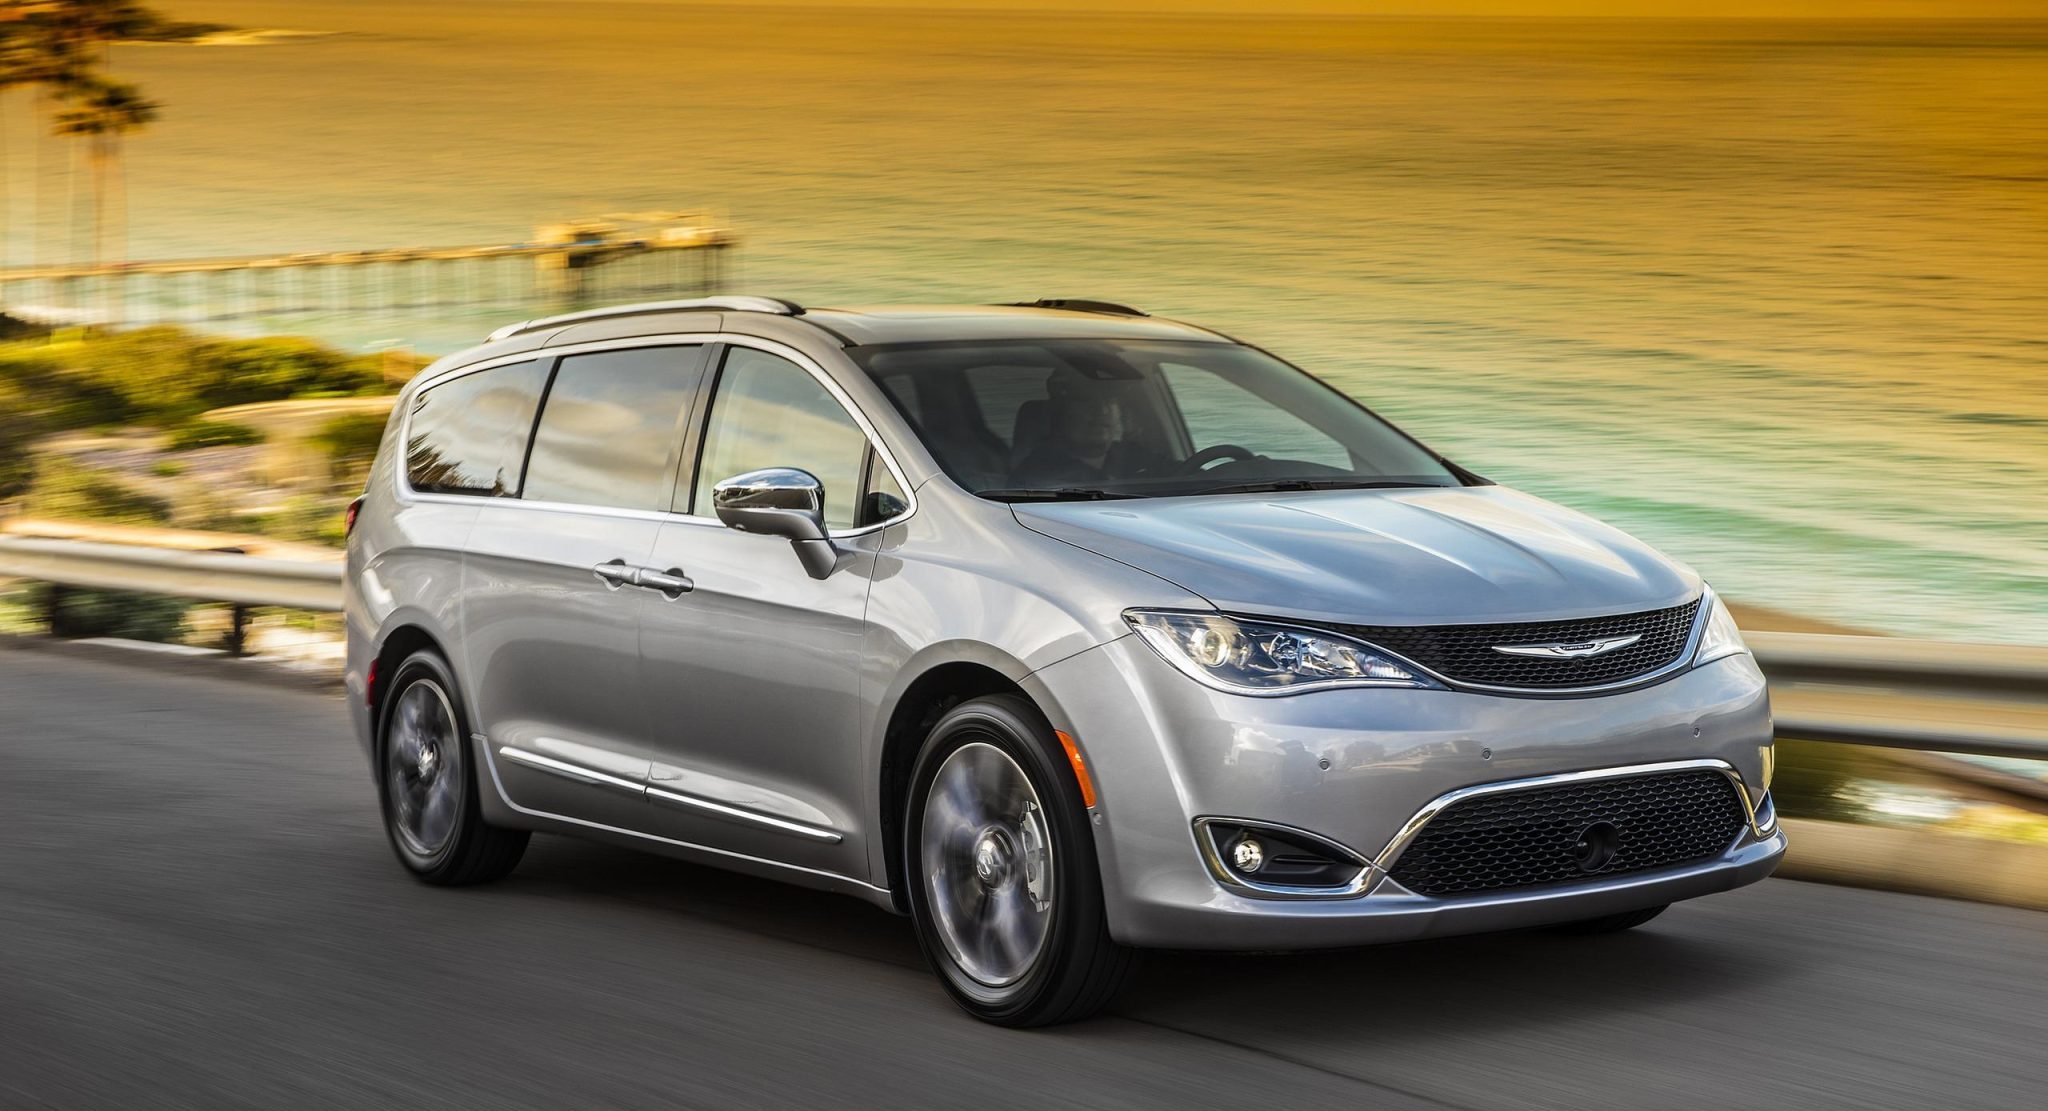
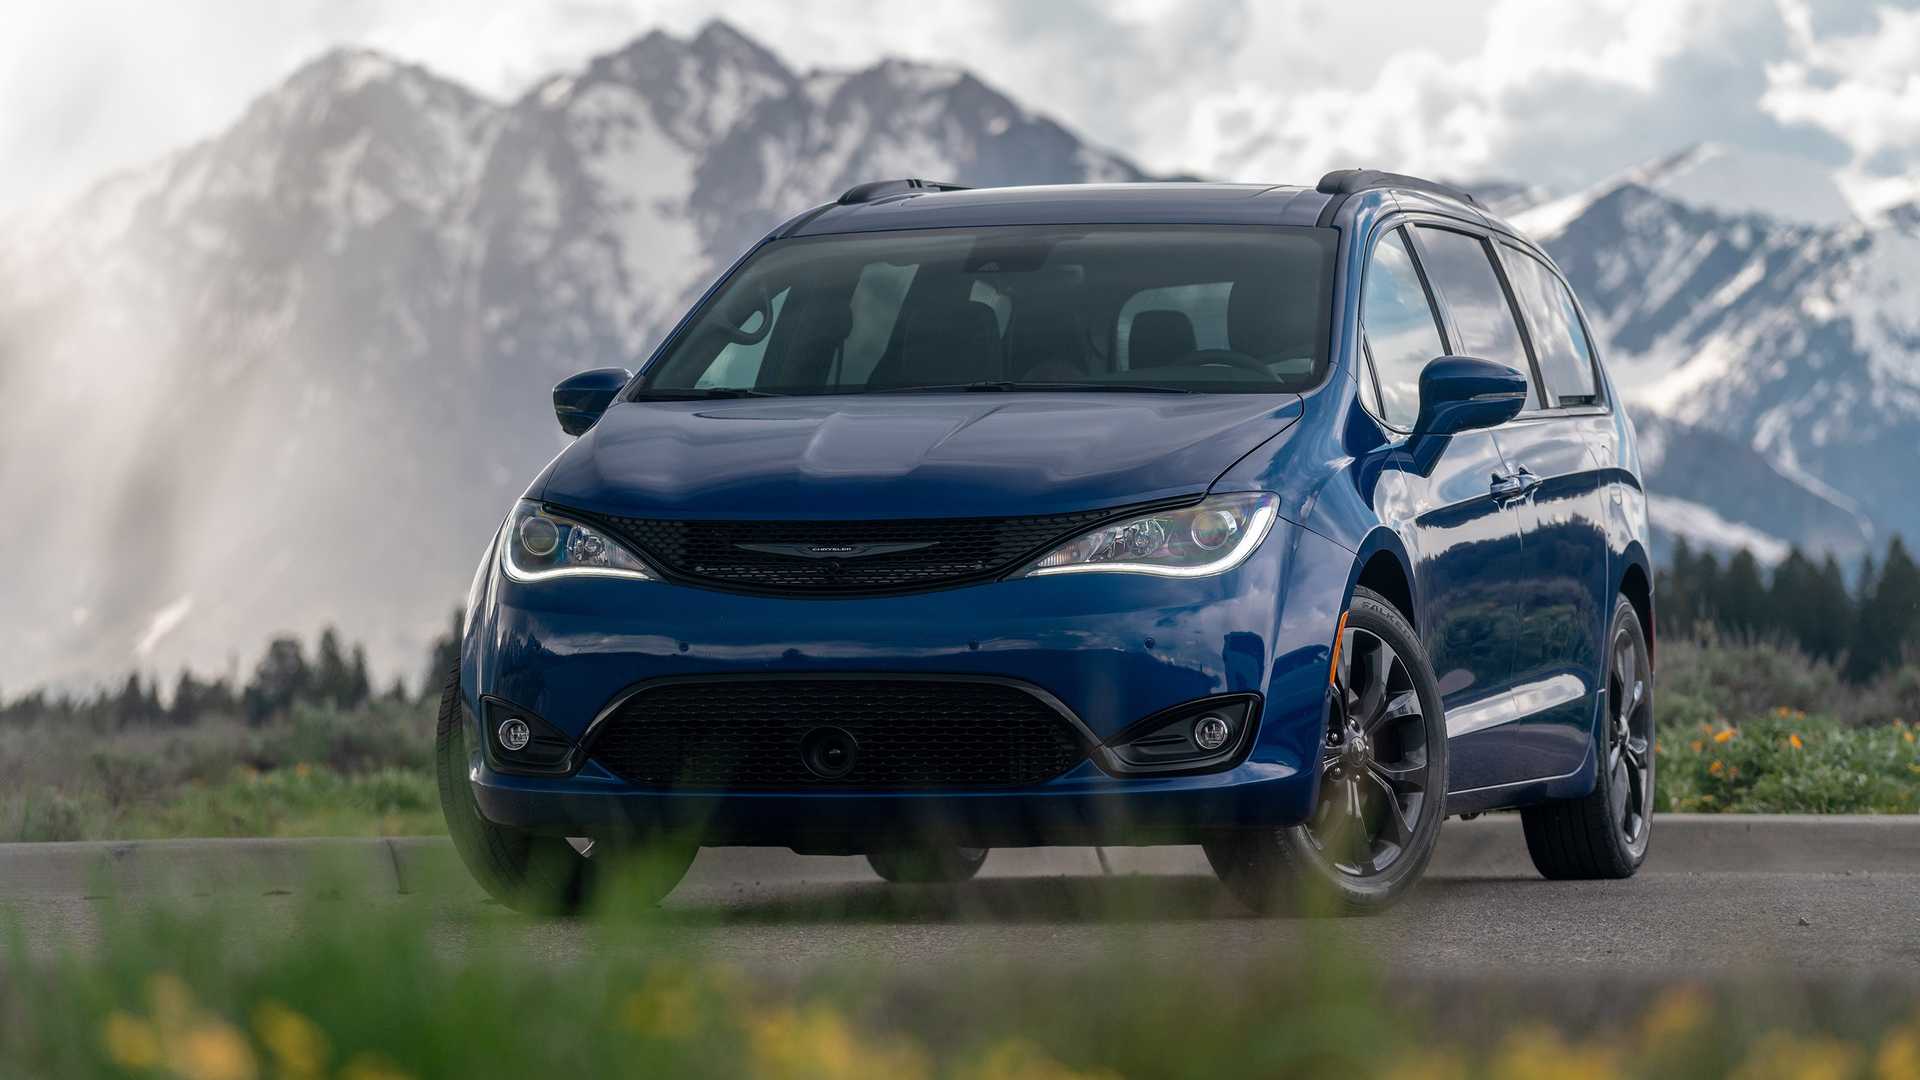
Chrysler Pacifica
Starting at $37,620
The Chrysler Pacifica was first introduced in 2003 for the 2004 model year as a luxury crossover SUV. In 2017, Chrysler reintroduced the Pacifica name, but this time for a minivan, effectively replacing the Chrysler Town & Country. The Pacifica minivan has been praised for its comfortable interior, advanced safety features, and versatile seating options. Some notable features include the Stow ‘n Go seating system, which allows the second and third-row seats to be folded flat into the floor for increased cargo space. The Chrysler Pacifica has received numerous awards and accolades, particularly for its innovative design, safety features, and as a family-friendly vehicle.
Chrysler Pacifica Plug-in Hybrid
Starting at $51,095
In addition to its gasoline-powered version, Chrysler offers a plug-in hybrid variant of the Pacifica. This model combines a gasoline engine with an electric motor and a battery pack, allowing for a certain amount of purely electric driving range before switching over to conventional hybrid operation.
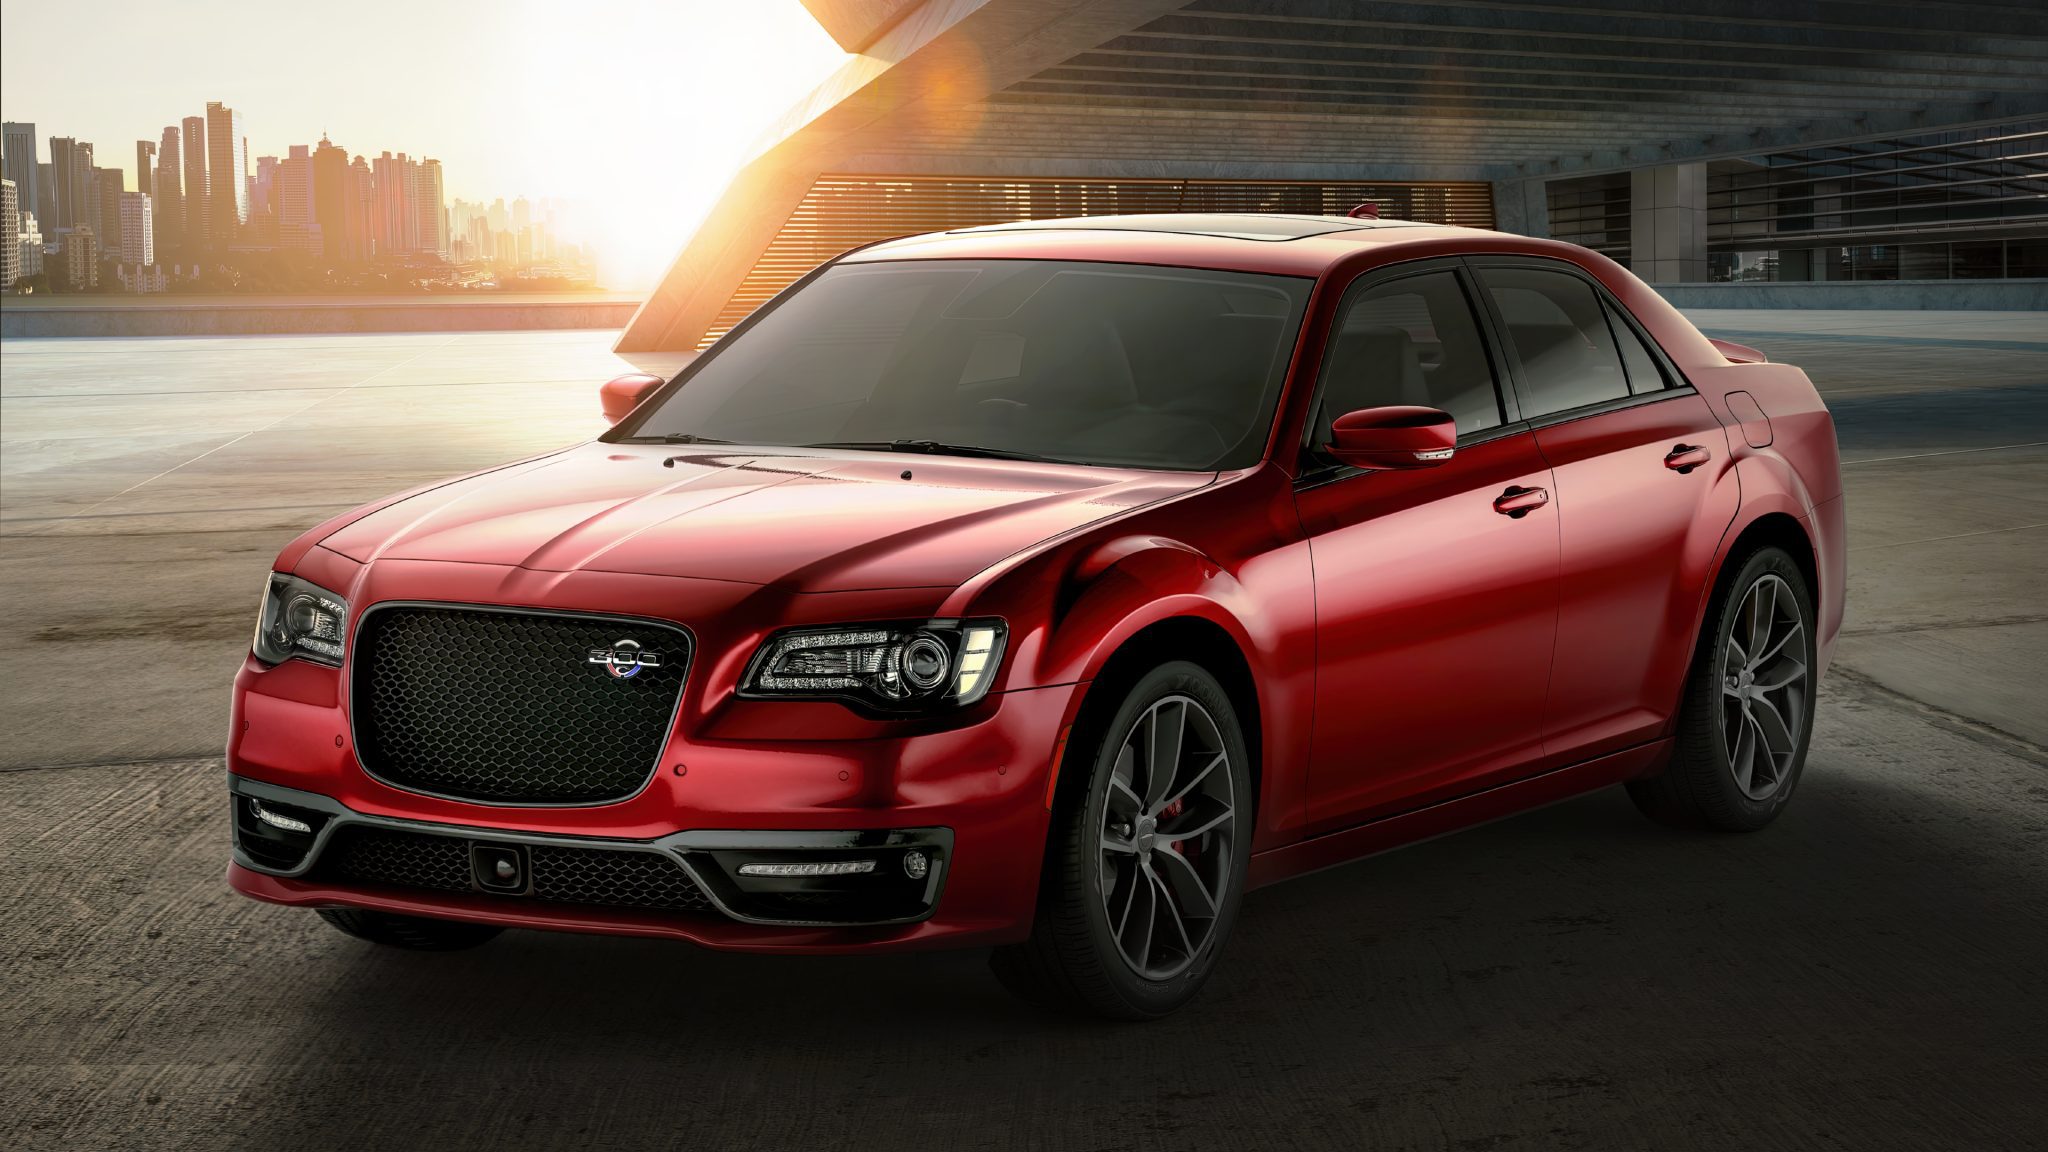
Chrysler 300
Starting at $34,995
When reintroduced in 2005, the Chrysler 300 was notable for its bold, angular design, rear-wheel-drive layout, and powerful available engines. It quickly gained popularity and stood out in the market, especially when many other sedans were adopting more curvaceous designs. Over the years, the 300 has been available with a variety of engines, ranging from more economical V6 engines to powerful V8s, especially in the 300C and SRT8 versions. The 5.7L HEMI V8, in particular, has been a standout for those seeking performance.


What the hell happened to this site. it used to be full of great information and easy to navigate. Now it’s totally useless.
Wow