
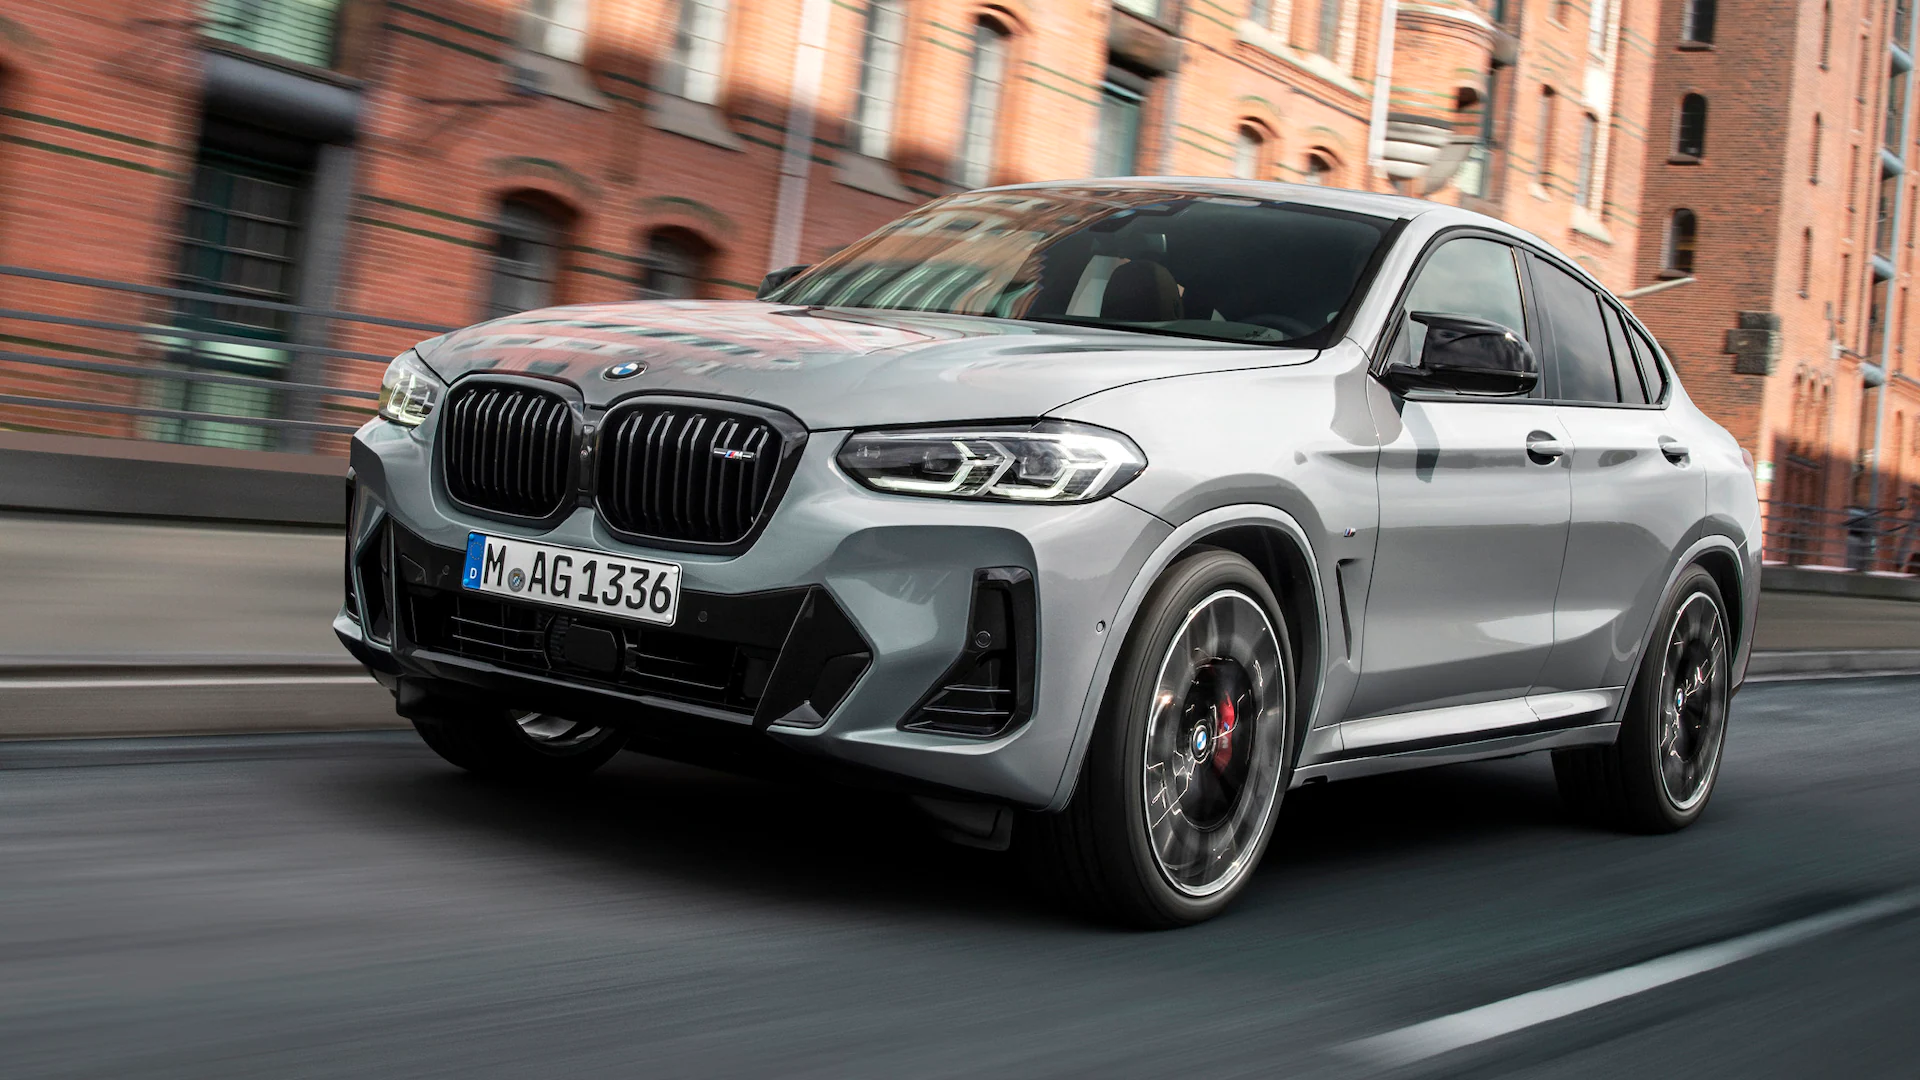
BMW X4
Here you will find monthly and yearly United States and Canadian sales figures for the BMW X4. BMW’s first compact Sports Activity Coupe arrived in 2014 as a lower, fastback-roofed alternative to the X3, sharing its platform and powertrains. From the 2022 update onward, the U.S. lineup consisted of a 248-horsepower four-cylinder X4 xDrive30i and a 382-horsepower six-cylinder X4 M40i with 48-volt mild-hybrid assistance. BMW USA now lists the X4 as no longer in production, and the sales charts below show the wind-down.
- Class: Compact luxury SUV coupe (Sports Activity Coupe), five seats
- Engines: X4 xDrive30i: 2.0-liter turbocharged four-cylinder, 248 hp and 258 lb-ft; X4 M40i: 3.0-liter turbocharged six-cylinder, 382 hp and 369 lb-ft, with a 48-volt mild-hybrid system
- Transmission: Eight-speed Sport automatic
- Drivetrain: xDrive all-wheel drive
- Status: No longer in production, per BMW USA
- Chief rivals: Mercedes-Benz GLC Coupe, Porsche Macan, Audi Q5 Sportback
BMW X4 Sales in the United States
The BMW X4 chart for the United States opens with 2,653 sales in 2014 and 6,429 in 2015, the first full year. After dipping to 4,323 in 2018, the second-generation X4 doubled that to 8,758 in 2019 and peaked at 10,622 in 2021. The next three years held close to 10,000: 9,799 in 2022, 9,537 in 2023 and 9,982 in 2024. Sales then fell to 5,852 in 2025, down 41.4 percent, with the fourth quarter down to 998. BMW reports by quarter, and the first half of 2026 totals only 357, down 88.4 percent from 3,086 a year earlier.
BMW X4, United States calendar-year unit sales, 2014–2026. 2026 is January–Sep (partial).
Annual sales
| Year | Units | YoY |
|---|---|---|
| 2014 | 2,653 | — |
| 2015 | 6,429 | ▲ 142.3% |
| 2016 | 4,989 | ▼ 22.4% |
| 2017 | 5,198 | ▲ 4.2% |
| 2018 | 4,323 | ▼ 16.8% |
| 2019 | 8,758 | ▲ 102.6% |
| 2020 | 7,662 | ▼ 12.5% |
| 2021 | 10,622 | ▲ 38.6% |
| 2022 | 9,799 | ▼ 7.7% |
| 2023 | 9,537 | ▼ 2.7% |
| 2024 | 9,982 | ▲ 4.7% |
| 2025 | 5,852 | ▼ 41.4% |
| 2026 (Jan–Sep) | 429 | ▼ 91.2% YTD |
Monthly sales
| Year | Jan | Feb | Mar | Apr | May | Jun | Jul | Aug | Sep | Oct | Nov | Dec | Total |
|---|---|---|---|---|---|---|---|---|---|---|---|---|---|
| 2014 | — | — | — | — | — | — | 262 | 345 | 380 | 357 | 489 | 820 | 2,653 |
| 2015 | 396 | 466 | 599 | 920 | 375 | 390 | 407 | 453 | 475 | 492 | 572 | 884 | 6,429 |
| 2016 | 262 | 522 | 689 | 364 | 371 | 407 | 329 | 432 | 400 | 409 | 405 | 399 | 4,989 |
| 2017 | 211 | 282 | 395 | 291 | 406 | 561 | 336 | 503 | 509 | 625 | 541 | 538 | 5,198 |
| 2018 | 387 | 517 | 513 | 193 | 106 | 70 | 406 | 314 | 296 | 428 | 481 | 612 | 4,323 |
| 2019 | 406 | 453 | 577 | 638 | 679 | 864 | 752 | 517 | 948 | 695 | 896 | 1,333 | 8,758 |
| 2020 | 581 | 752 | 455 | 247 | 549 | 577 | 567 | 502 | 535 | 977 | 803 | 1,117 | 7,662 |
| 2021 | 538 | 538 | 606 | 901 | 867 | 901 | 851 | 819 | 851 | 1,250 | 1,250 | 1,250 | 10,622 |
| 2022 | 732 | 732 | 823 | 918 | 884 | 884 | 546 | 567 | 546 | 1,056 | 1,013 | 1,098 | 9,799 |
| 2023 | 808 | 776 | 873 | 646 | 621 | 646 | 634 | 685 | 659 | 1,049 | 1,049 | 1,091 | 9,537 |
| 2024 | 785 | 785 | 816 | 747 | 777 | 777 | 923 | 1,033 | 849 | 733 | 861 | 896 | 9,982 |
| 2025 | 477 | 458 | 496 | 559 | 580 | 516 | 626 | 548 | 594 | 311 | 316 | 371 | 5,852 |
| 2026 | 76 | 70 | 75 | 44 | 48 | 44 | 23 | 24 | 25 | — | — | — | 429 |
BMW X4 Sales in Canada
In Canada the X4 chart begins with 490 sales in 2014 and quickly settled between roughly 1,000 and 1,300 a year. The peak came in 2021 at 1,564, and 2024 still produced 1,098. The 2025 total fell to 651, down 40.7 percent, and the first half of 2026 totals 90, down 72.9 percent from 332 over the same months of 2025.
BMW X4, Canada calendar-year unit sales, 2014–2026. 2026 is January–Jun (partial).
Annual sales
| Year | Units | YoY |
|---|---|---|
| 2014 | 490 | — |
| 2015 | 1,144 | ▲ 133.5% |
| 2016 | 1,236 | ▲ 8.0% |
| 2017 | 1,195 | ▼ 3.3% |
| 2018 | 1,007 | ▼ 15.7% |
| 2019 | 1,264 | ▲ 25.5% |
| 2020 | 1,241 | ▼ 1.8% |
| 2021 | 1,564 | ▲ 26.0% |
| 2022 | 1,160 | ▼ 25.8% |
| 2023 | 1,267 | ▲ 9.2% |
| 2024 | 1,098 | ▼ 13.3% |
| 2025 | 651 | ▼ 40.7% |
| 2026 (Jan–Jun) | 90 | ▼ 72.9% YTD |
Monthly sales
| Year | Jan | Feb | Mar | Apr | May | Jun | Jul | Aug | Sep | Oct | Nov | Dec | Total |
|---|---|---|---|---|---|---|---|---|---|---|---|---|---|
| 2014 | 0 | 0 | 0 | 0 | 0 | 0 | 41 | 69 | 100 | 111 | 92 | 77 | 490 |
| 2015 | 76 | 66 | 96 | 190 | 52 | 83 | 82 | 88 | 121 | 106 | 105 | 79 | 1,144 |
| 2016 | 66 | 94 | 117 | 106 | 100 | 117 | 168 | 103 | 104 | 98 | 97 | 66 | 1,236 |
| 2017 | 54 | 75 | 101 | 124 | 113 | 256 | 58 | 72 | 108 | 93 | 78 | 63 | 1,195 |
| 2018 | 47 | 72 | 62 | 90 | 49 | 31 | 61 | 153 | 108 | 133 | 123 | 78 | 1,007 |
| 2019 | 78 | 71 | 76 | 106 | 106 | 97 | 106 | 106 | 98 | 150 | 131 | 139 | 1,264 |
| 2020 | 71 | 64 | 72 | 91 | 83 | 93 | 141 | 134 | 136 | 122 | 111 | 123 | 1,241 |
| 2021 | 83 | 83 | 98 | 141 | 128 | 142 | 147 | 155 | 149 | 143 | 143 | 152 | 1,564 |
| 2022 | 59 | 56 | 67 | 122 | 122 | 130 | 50 | 58 | 55 | 147 | 147 | 147 | 1,160 |
| 2023 | 101 | 92 | 106 | 104 | 114 | 116 | 109 | 125 | 110 | 101 | 96 | 93 | 1,267 |
| 2024 | 82 | 79 | 80 | 110 | 110 | 101 | 111 | 111 | 102 | 76 | 66 | 70 | 1,098 |
| 2025 | 50 | 46 | 49 | 64 | 61 | 62 | 53 | 50 | 52 | 58 | 48 | 58 | 651 |
| 2026 | 19 | 17 | 19 | 13 | 10 | 12 | — | — | — | — | — | — | 90 |







