Daihatsu Sales Data, Trends & Analysis for the U.S Automotive Market
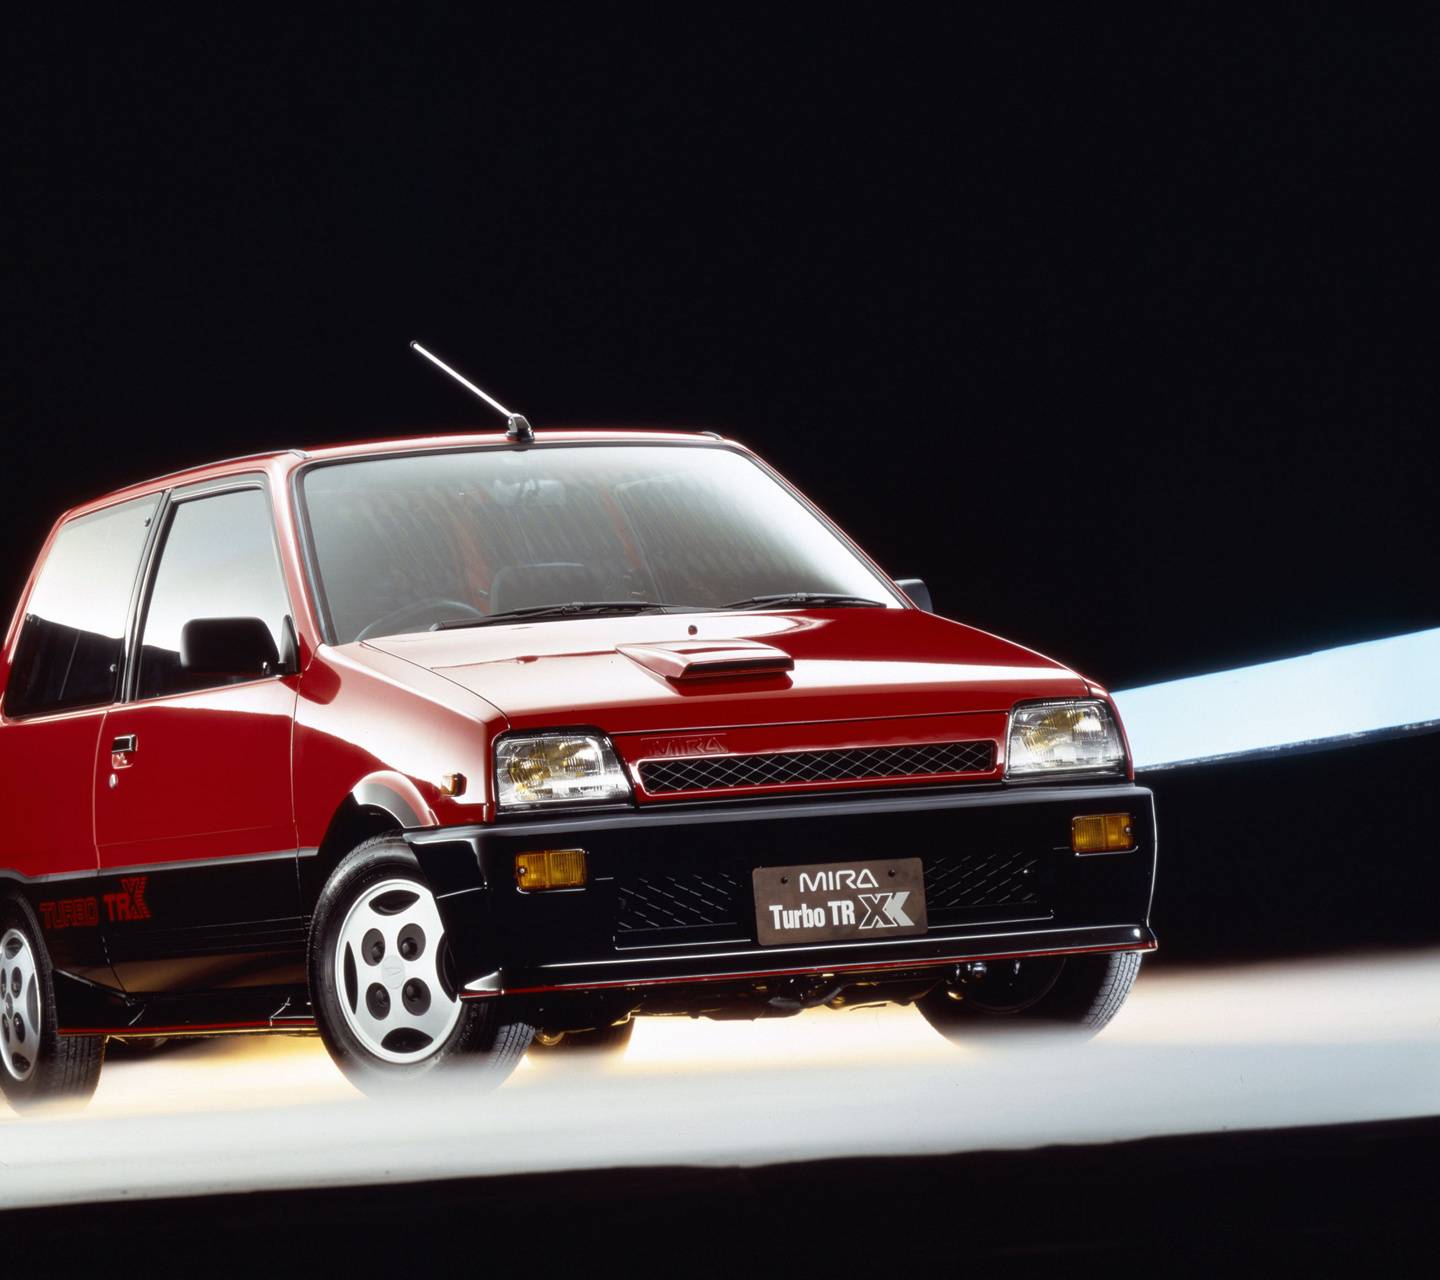
Daihatsu was launched in the United States in 1988 with the third-generation Charade minicar in hatchback and sedan versions, followed by the Rocky SUV in 1989. Sales were slow, peaking at 15.500 units in 1989, and at the same time Toyota gained a controlling interest in the brand, which caused Daihatsu to pull out of the US market in 1992, despite winning the J.D. Power owner satisfaction survey that year.
What didn’t help the brand was that during this period fuel was cheap, reducing demand for small, fuel efficient cars. Daihatsu was the ninth Japanese brand to enter the US market and had very low brand recognition. However, when Scion launched its second generation xB in the US in 2007, a Daihatsu-built model was again sold in the US.
Daihatsu Annual Sales, Growth and Market Share in the U.S
Below we have a table that shows total Daihatsu sales volumes for the United States automotive market, broken out by year since 2005. This data captures all Daihatsu vehicle sales for the entire U.S automotive market.
| Year | Sales | YOY Change | Marketshare | Marketshare Change |
|---|---|---|---|---|
| 1988 | 11,460 | 0.00 | 0.30 | 0.00 |
| 1989 | 15,413 | 34.49 | 0.44 | 32.82 |
| 1990 | 14,984 | -2.78 | 0.50 | 11.17 |
| 1991 | 8,963 | -40.18 | 0.33 | -52.21 |
| 1992 | 19 | -99.79 | 0.00 | -44,592.33 |
| 1993 | 0 | -100.00 | 0.00 | 0.00 |
| 1994 | 0 | 0.00 | 0.00 | 0.00 |
| 1995 | 0 | 0.00 | 0.00 | 0.00 |
| 1996 | 0 | 0.00 | 0.00 | 0.00 |
| 1997 | 0 | 0.00 | 0.00 | 0.00 |
| 1998 | 0 | 0.00 | 0.00 | 0.00 |
| 1999 | 0 | 0.00 | 0.00 | 0.00 |
| 2000 | 0 | 0.00 | 0.00 | 0.00 |
| 2001 | 0 | 0.00 | 0.00 | 0.00 |
| 2002 | 0 | 0.00 | 0.00 | 0.00 |
| 2003 | 0 | 0.00 | 0.00 | 0.00 |
| 2004 | 0 | 0.00 | 0.00 | 0.00 |
| 2005 | 0 | 0.00 | 0.00 | 0.00 |
| 2006 | 0 | 0.00 | 0.00 | 0.00 |
| 2007 | 0 | 0.00 | 0.00 | 0.00 |
| 2008 | 0 | 0.00 | 0.00 | 0.00 |
| 2009 | 0 | 0.00 | 0.00 | 0.00 |
| 2010 | 0 | 0.00 | 0.00 | 0.00 |
| 2011 | 0 | 0.00 | 0.00 | 0.00 |
| 2012 | 0 | 0.00 | 0.00 | 0.00 |
| 2013 | 0 | 0.00 | 0.00 | 0.00 |
| 2014 | 0 | 0.00 | 0.00 | 0.00 |
| 2015 | 0 | 0.00 | 0.00 | 0.00 |
| 2016 | 0 | 0.00 | 0.00 | 0.00 |
| 2017 | 0 | 0.00 | 0.00 | 0.00 |
| 2018 | 0 | 0.00 | 0.00 | 0.00 |
| 2019 | 0 | 0.00 | 0.00 | 0.00 |
| 2020 | 0 | 0.00 | 0.00 | 0.00 |
| 2021 | 0 | 0.00 | 0.00 | 0.00 |
| 2022 | 0 | 0.00 | 0.00 | 0.00 |
| 2023 | 0 | 0.00 | 0.00 | 0.00 |
| 2024 | 0 | 0.00 | 0.00 | 0.00 |
| 2025 | 0 | 0.00 | 0.00 | 0.00 |
| 2026 | 0 | 0.00 | 0.00 | 0.00 |
Daihatsu U.S Annual Sales Units & Growth Chart
Below is a visual representation of Daihatsu’s U.S sales units over time. We have both the Daihatsu sales units and the market share in the United States market. Click on the items in the legend to see each series by itself.
Daihatsu U.S Growth Rate & Market Share Chart
Below is the annual growth rate for the Daihatsu brand in the U.S, shown against the Daihatsu’s marketshare changes in the United States. This gives you a good look into how Daihatsu has faired against the other brands in terms of absolute sales and effect on marketshare. Click on the items in the legend to see each series by itself.
The Best-Selling Daihatsu Cars & SUVs in the U.S
Coming Soon