
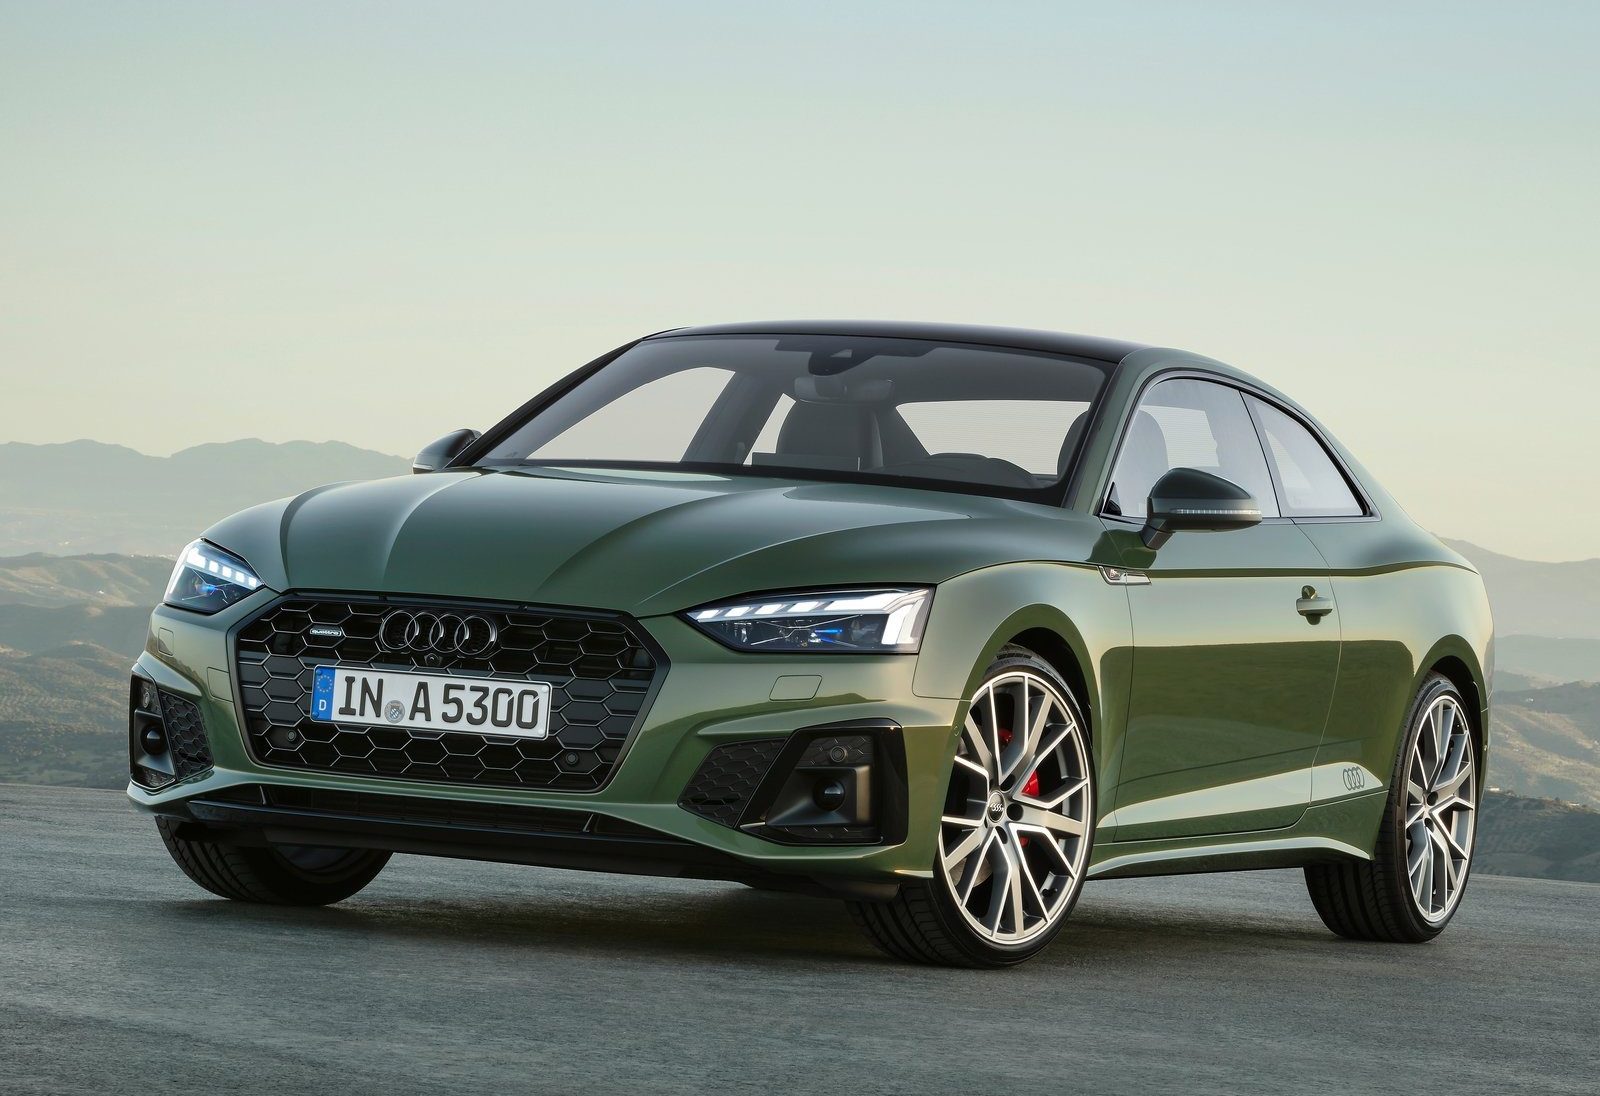
Audi A5
Here you will find monthly and yearly United States and Canadian sales figures for the Audi A5. The A5 badge began life in 2007 on a coupe and later spread to a Cabriolet and a Sportback. Audi of America has since described the current liftback A5 as replacing both the previous A5 Sportback and the A4 Sedan, so the nameplate now carries the volume that used to sit under the A4 as well.
- Class: Compact premium car, sold in the United States as a five-door liftback Audi markets as a sedan
- Engine: 2.0L TFSI four-cylinder rated 268 horsepower and 295 lb-ft; the S5 uses a 3.0L TFSI V6 rated 362 horsepower and 406 lb-ft
- Transmission: Seven-speed S tronic dual-clutch
- Drivetrain: quattro all-wheel drive standard
- Platform: Premium Platform Combustion
- Trims: Premium, Premium Plus and Prestige
- Chief rivals: BMW 3-Series, Mercedes-Benz C-Class, Cadillac CT5, Genesis G70, Lexus IS
Audi A5 Sales in the United States
Audi A5 sales in the United States grew quickly from the 2007 launch, clearing 16,000 units by 2010 and peaking for the first generation at 18,664 in 2013. Volume then fell away to 8,354 in 2016 as the original coupe and Cabriolet ran out, before the second-generation car drove the strongest years on this chart: 21,301 in 2017 and a record 25,972 in 2018. The nameplate held between 17,000 and 24,000 for the next six years, with 23,807 in 2023 and 24,636 in 2024. The 16,776 recorded in 2025 is a drop of about 32 percent and reflects a changeover year in which the older body styles wound down and the new liftback took over from the A4. That transition looks to have landed: through June 2026 Audi has delivered 8,882, about 7 percent ahead of the 8,277 posted over the same six months of 2025. Audi reports United States sales quarterly and the monthly values here are spread within each quarter, so several months repeat and quarter totals are the firmer comparison.
Audi A5, United States calendar-year unit sales, 2007–2026. 2026 is January–Jun (partial).
Annual sales
| Year | Units | YoY |
|---|---|---|
| 2007 | 625 | — |
| 2008 | 6,282 | ▲ 905.1% |
| 2009 | 9,800 | ▲ 56.0% |
| 2010 | 16,379 | ▲ 67.1% |
| 2011 | 15,385 | ▼ 6.1% |
| 2012 | 17,270 | ▲ 12.3% |
| 2013 | 18,664 | ▲ 8.1% |
| 2014 | 16,640 | ▼ 10.8% |
| 2015 | 12,934 | ▼ 22.3% |
| 2016 | 8,354 | ▼ 35.4% |
| 2017 | 21,301 | ▲ 155.0% |
| 2018 | 25,972 | ▲ 21.9% |
| 2019 | 23,023 | ▼ 11.4% |
| 2020 | 18,827 | ▼ 18.2% |
| 2021 | 17,128 | ▼ 9.0% |
| 2022 | 18,349 | ▲ 7.1% |
| 2023 | 23,807 | ▲ 29.7% |
| 2024 | 24,636 | ▲ 3.5% |
| 2025 | 16,776 | ▼ 31.9% |
| 2026 (Jan–Jun) | 8,882 | ▲ 7.3% YTD |
Monthly sales
| Year | Jan | Feb | Mar | Apr | May | Jun | Jul | Aug | Sep | Oct | Nov | Dec | Total |
|---|---|---|---|---|---|---|---|---|---|---|---|---|---|
| 2007 | — | — | — | — | — | — | — | — | 115 | 151 | 223 | 136 | 625 |
| 2008 | 342 | 384 | 464 | 484 | 449 | 237 | 394 | 718 | 719 | 865 | 569 | 657 | 6,282 |
| 2009 | 603 | 494 | 657 | 680 | 716 | 635 | 544 | 921 | 987 | 1,107 | 1,074 | 1,382 | 9,800 |
| 2010 | 1,051 | 1,029 | 1,675 | 1,846 | 1,757 | 1,404 | 1,238 | 1,424 | 1,172 | 1,147 | 1,181 | 1,455 | 16,379 |
| 2011 | 1,054 | 1,142 | 1,388 | 1,437 | 1,438 | 1,361 | 1,313 | 1,322 | 1,269 | 1,394 | 994 | 1,273 | 15,385 |
| 2012 | 878 | 1,119 | 1,714 | 1,420 | 1,264 | 1,607 | 1,732 | 1,677 | 1,594 | 1,308 | 1,385 | 1,572 | 17,270 |
| 2013 | 1,200 | 1,173 | 1,628 | 1,809 | 1,872 | 1,821 | 1,717 | 1,757 | 1,511 | 1,487 | 1,305 | 1,384 | 18,664 |
| 2014 | 925 | 1,030 | 1,536 | 1,579 | 1,914 | 1,554 | 1,610 | 1,833 | 1,204 | 1,101 | 1,062 | 1,292 | 16,640 |
| 2015 | 843 | 831 | 1,303 | 1,300 | 1,341 | 1,101 | 1,105 | 1,043 | 945 | 845 | 1,277 | 1,000 | 12,934 |
| 2016 | 515 | 602 | 784 | 813 | 818 | 802 | 744 | 848 | 746 | 609 | 482 | 591 | 8,354 |
| 2017 | 304 | 333 | 674 | 1,007 | 2,047 | 2,374 | 2,255 | 2,603 | 2,360 | 2,143 | 2,243 | 2,958 | 21,301 |
| 2018 | 1,599 | 1,888 | 2,587 | 2,169 | 2,364 | 2,985 | 2,381 | 2,732 | 2,539 | 1,761 | 1,221 | 1,746 | 25,972 |
| 2019 | 1,651 | 1,603 | 2,224 | 1,685 | 2,251 | 2,160 | 2,017 | 2,085 | 1,646 | 1,705 | 1,805 | 2,191 | 23,023 |
| 2020 | 1,728 | 2,237 | 1,355 | 898 | 1,996 | 2,096 | 1,304 | 1,159 | 1,255 | 1,619 | 1,330 | 1,850 | 18,827 |
| 2021 | 1,362 | 1,362 | 1,533 | 2,285 | 2,197 | 2,285 | 1,071 | 1,031 | 1,071 | 977 | 977 | 977 | 17,128 |
| 2022 | 1,229 | 1,229 | 1,383 | 1,635 | 1,574 | 1,574 | 1,630 | 1,693 | 1,630 | 1,591 | 1,527 | 1,654 | 18,349 |
| 2023 | 1,841 | 1,768 | 1,989 | 2,248 | 2,162 | 2,278 | 1,935 | 2,090 | 2,012 | 1,804 | 1,804 | 1,876 | 23,807 |
| 2024 | 1,578 | 1,578 | 1,641 | 2,607 | 2,711 | 2,711 | 1,744 | 1,953 | 1,605 | 1,919 | 2,253 | 2,336 | 24,636 |
| 2025 | 1,374 | 1,319 | 1,429 | 1,403 | 1,457 | 1,295 | 1,193 | 1,043 | 1,129 | 1,604 | 1,628 | 1,902 | 16,776 |
| 2026 | 1,496 | 1,381 | 1,495 | 1,465 | 1,594 | 1,451 | — | — | — | — | — | — | 8,882 |
Audi A5 Sales in Canada
Canadian buyers followed a similar arc at roughly a tenth of the volume. The A5 built from 35 units in 2007 to 2,351 in 2013, dipped to 1,516 in 2016, then jumped to 3,671 in 2017 and a record 4,589 in 2018. It fell to 2,510 in 2020 and spent the next four years between 2,600 and 3,000. The 3,255 recorded in 2025 is the best Canadian year since 2019 and runs against the American decline in the same period. The first half of 2026 is holding at 1,498 units, essentially level with the 1,470 recorded over the same six months of 2025.
Audi A5, Canada calendar-year unit sales, 2007–2026. 2026 is January–Jun (partial).
Annual sales
| Year | Units | YoY |
|---|---|---|
| 2007 | 35 | — |
| 2008 | 400 | ▲ 1,042.9% |
| 2009 | 1,520 | ▲ 280.0% |
| 2010 | 2,309 | ▲ 51.9% |
| 2011 | 1,948 | ▼ 15.6% |
| 2012 | 2,024 | ▲ 3.9% |
| 2013 | 2,351 | ▲ 16.2% |
| 2014 | 2,165 | ▼ 7.9% |
| 2015 | 1,693 | ▼ 21.8% |
| 2016 | 1,516 | ▼ 10.5% |
| 2017 | 3,671 | ▲ 142.2% |
| 2018 | 4,589 | ▲ 25.0% |
| 2019 | 4,223 | ▼ 8.0% |
| 2020 | 2,510 | ▼ 40.6% |
| 2021 | 2,620 | ▲ 4.4% |
| 2022 | 2,949 | ▲ 12.6% |
| 2023 | 2,884 | ▼ 2.2% |
| 2024 | 2,739 | ▼ 5.0% |
| 2025 | 3,255 | ▲ 18.8% |
| 2026 (Jan–Jun) | 1,498 | ▲ 1.9% YTD |
Monthly sales
| Year | Jan | Feb | Mar | Apr | May | Jun | Jul | Aug | Sep | Oct | Nov | Dec | Total |
|---|---|---|---|---|---|---|---|---|---|---|---|---|---|
| 2007 | 0 | 0 | 0 | 0 | 0 | 0 | 0 | 0 | 0 | 5 | 20 | 10 | 35 |
| 2008 | 14 | 36 | 67 | 30 | 31 | 12 | 16 | 39 | 52 | 56 | 26 | 21 | 400 |
| 2009 | 34 | 86 | 97 | 91 | 80 | 69 | 111 | 159 | 160 | 224 | 299 | 110 | 1,520 |
| 2010 | 152 | 147 | 348 | 324 | 211 | 202 | 174 | 196 | 140 | 168 | 139 | 108 | 2,309 |
| 2011 | 123 | 151 | 200 | 255 | 239 | 189 | 205 | 132 | 147 | 122 | 110 | 75 | 1,948 |
| 2012 | 102 | 128 | 218 | 165 | 140 | 157 | 272 | 223 | 184 | 195 | 127 | 113 | 2,024 |
| 2013 | 77 | 136 | 258 | 332 | 276 | 221 | 196 | 188 | 147 | 211 | 175 | 134 | 2,351 |
| 2014 | 108 | 113 | 235 | 316 | 247 | 204 | 174 | 253 | 155 | 127 | 115 | 118 | 2,165 |
| 2015 | 79 | 58 | 133 | 244 | 227 | 206 | 132 | 116 | 152 | 147 | 121 | 78 | 1,693 |
| 2016 | 57 | 73 | 185 | 202 | 196 | 127 | 137 | 129 | 122 | 80 | 138 | 70 | 1,516 |
| 2017 | 27 | 36 | 98 | 138 | 531 | 630 | 442 | 415 | 383 | 409 | 382 | 180 | 3,671 |
| 2018 | 151 | 243 | 478 | 536 | 569 | 550 | 323 | 407 | 410 | 373 | 372 | 177 | 4,589 |
| 2019 | 331 | 300 | 317 | 459 | 459 | 418 | 364 | 364 | 332 | 315 | 274 | 290 | 4,223 |
| 2020 | 162 | 147 | 163 | 232 | 211 | 234 | 293 | 280 | 281 | 174 | 158 | 175 | 2,510 |
| 2021 | 179 | 179 | 208 | 438 | 398 | 439 | 171 | 180 | 173 | 83 | 83 | 89 | 2,620 |
| 2022 | 200 | 190 | 220 | 245 | 245 | 259 | 241 | 277 | 254 | 272 | 272 | 274 | 2,949 |
| 2023 | 189 | 172 | 199 | 345 | 379 | 380 | 232 | 266 | 233 | 170 | 163 | 156 | 2,884 |
| 2024 | 112 | 107 | 108 | 353 | 353 | 321 | 258 | 258 | 236 | 227 | 197 | 209 | 2,739 |
| 2025 | 190 | 173 | 183 | 317 | 303 | 304 | 261 | 249 | 250 | 368 | 304 | 353 | 3,255 |
| 2026 | 219 | 195 | 215 | 269 | 306 | 294 | — | — | — | — | — | — | 1,498 |







