
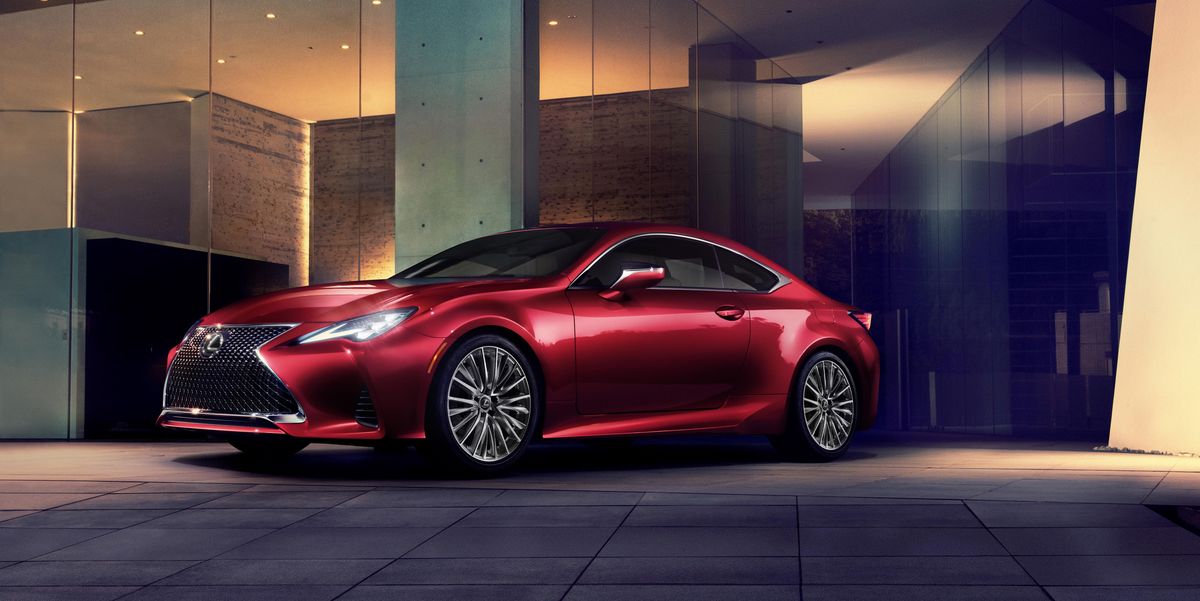
Lexus RC
Here you will find monthly and yearly United States and Canadian sales figures for the Lexus RC. The RC is Lexus’s compact luxury two-door coupe, sold below the Lexus LC grand tourer. Lexus confirmed that the RC and the V8-powered RC F would be discontinued at the end of the 2025 model year, after a decade on the market and more than 90,000 units sold across 62 countries and regions. For its last year the RC F was offered only as the RC F Final Edition, and the RC does not appear in the 2026 U.S. lineup.
- Class: Compact luxury sport coupe
- Engines (2025): RC 300: 2.0-liter turbocharged four, 241 hp and 258 lb-ft. RC 300 AWD: 3.5-liter V6, 260 hp and 236 lb-ft. RC 350: 3.5-liter V6, 311 hp and 280 lb-ft. RC F: naturally aspirated 5.0-liter V8, 472 hp
- Transmission: 8-speed automatic on rear-drive models and the RC F; 6-speed automatic on all-wheel-drive models
- Drivetrain: Rear-wheel drive; all-wheel drive available on the RC 300 and RC 350
- Trims: RC 300, RC 350 (including F SPORT versions) and the RC F Final Edition; 2025 was the final model year
- Chief rivals: BMW 4 Series, Mercedes-Benz CLE, Infiniti Q60
Lexus RC Sales in the United States
The Lexus RC chart for the United States starts in November 2014 with 880 sales, and 1,922 for that partial year. The first full year, 2015, is the peak at 14,784, with December 2015 the best month on the chart at 1,711. Sales fell to 11,165 in 2016, 7,363 in 2017 and 3,358 in 2018, recovered to 4,591 in 2019, then slid from 3,808 in 2020 to 1,752 in 2023. 2024 ticked up to 1,854 before 2025 dropped to 1,349, down 27.2 percent. With the RC discontinued, January to September 2026 totals 239, down 77.9 percent from 1,080 a year earlier, and monthly sales have been in single digits since May.
Lexus RC, United States calendar-year unit sales, 2014–2026. 2026 is January–Sep (partial).
Annual sales
| Year | Units | YoY |
|---|---|---|
| 2014 | 1,922 | — |
| 2015 | 14,784 | ▲ 669.2% |
| 2016 | 11,165 | ▼ 24.5% |
| 2017 | 7,363 | ▼ 34.1% |
| 2018 | 3,358 | ▼ 54.4% |
| 2019 | 4,591 | ▲ 36.7% |
| 2020 | 3,808 | ▼ 17.1% |
| 2021 | 2,987 | ▼ 21.6% |
| 2022 | 2,648 | ▼ 11.3% |
| 2023 | 1,752 | ▼ 33.8% |
| 2024 | 1,854 | ▲ 5.8% |
| 2025 | 1,349 | ▼ 27.2% |
| 2026 (Jan–Sep) | 239 | ▼ 77.9% YTD |
Monthly sales
| Year | Jan | Feb | Mar | Apr | May | Jun | Jul | Aug | Sep | Oct | Nov | Dec | Total |
|---|---|---|---|---|---|---|---|---|---|---|---|---|---|
| 2014 | — | — | — | — | — | — | — | — | — | — | 880 | 1,042 | 1,922 |
| 2015 | 847 | 984 | 1,201 | 1,226 | 1,343 | 1,129 | 1,232 | 1,337 | 1,159 | 1,333 | 1,282 | 1,711 | 14,784 |
| 2016 | 755 | 920 | 1,194 | 813 | 823 | 787 | 977 | 1,065 | 827 | 1,081 | 881 | 1,042 | 11,165 |
| 2017 | 447 | 495 | 619 | 522 | 517 | 499 | 522 | 665 | 737 | 828 | 826 | 686 | 7,363 |
| 2018 | 161 | 186 | 271 | 369 | 434 | 328 | 259 | 327 | 258 | 211 | 213 | 341 | 3,358 |
| 2019 | 262 | 279 | 422 | 353 | 412 | 381 | 437 | 482 | 334 | 351 | 450 | 428 | 4,591 |
| 2020 | 289 | 299 | 169 | 140 | 312 | 328 | 341 | 372 | 389 | 406 | 347 | 416 | 3,808 |
| 2021 | 213 | 207 | 357 | 312 | 302 | 311 | 368 | 416 | 234 | 121 | 52 | 94 | 2,987 |
| 2022 | 159 | 137 | 165 | 189 | 181 | 319 | 236 | 281 | 283 | 205 | 286 | 207 | 2,648 |
| 2023 | 120 | 128 | 132 | 154 | 143 | 165 | 136 | 167 | 169 | 142 | 127 | 169 | 1,752 |
| 2024 | 117 | 148 | 145 | 185 | 201 | 145 | 147 | 170 | 112 | 157 | 152 | 175 | 1,854 |
| 2025 | 147 | 119 | 186 | 135 | 124 | 94 | 93 | 85 | 97 | 91 | 84 | 94 | 1,349 |
| 2026 | 80 | 81 | 39 | 26 | 8 | 3 | 1 | 0 | 1 | — | — | — | 239 |
Lexus RC Sales in Canada
In Canada the RC arrived in November 2014 with 56 sales and 78 for that year. 2015 is the peak at 792, with August 2015 the best month on the chart at 128. Volume fell to 526 in 2016 and 512 in 2017, then declined every year from 321 in 2018 to 121 in 2024. 2025 finished at 81, down 33.1 percent. January to September 2026 totals 11, down 82.8 percent from 64 a year earlier, with no sales recorded after March.
Lexus RC, Canada calendar-year unit sales, 2014–2026. 2026 is January–Sep (partial).
Annual sales
| Year | Units | YoY |
|---|---|---|
| 2014 | 78 | — |
| 2015 | 792 | ▲ 915.4% |
| 2016 | 526 | ▼ 33.6% |
| 2017 | 512 | ▼ 2.7% |
| 2018 | 321 | ▼ 37.3% |
| 2019 | 305 | ▼ 5.0% |
| 2020 | 253 | ▼ 17.0% |
| 2021 | 220 | ▼ 13.0% |
| 2022 | 166 | ▼ 24.5% |
| 2023 | 134 | ▼ 19.3% |
| 2024 | 121 | ▼ 9.7% |
| 2025 | 81 | ▼ 33.1% |
| 2026 (Jan–Sep) | 11 | ▼ 82.8% YTD |
Monthly sales
| Year | Jan | Feb | Mar | Apr | May | Jun | Jul | Aug | Sep | Oct | Nov | Dec | Total |
|---|---|---|---|---|---|---|---|---|---|---|---|---|---|
| 2014 | 0 | 0 | 0 | 0 | 0 | 0 | 0 | 0 | 0 | 0 | 56 | 22 | 78 |
| 2015 | 24 | 36 | 59 | 120 | 85 | 56 | 114 | 128 | 72 | 45 | 26 | 27 | 792 |
| 2016 | 32 | 10 | 40 | 51 | 66 | 47 | 52 | 64 | 59 | 48 | 31 | 26 | 526 |
| 2017 | 13 | 21 | 42 | 54 | 50 | 59 | 49 | 56 | 66 | 56 | 20 | 26 | 512 |
| 2018 | 2 | 11 | 18 | 42 | 29 | 34 | 31 | 43 | 31 | 39 | 22 | 19 | 321 |
| 2019 | 17 | 16 | 18 | 43 | 43 | 40 | 25 | 25 | 25 | 19 | 16 | 18 | 305 |
| 2020 | 13 | 12 | 15 | 20 | 18 | 22 | 33 | 31 | 32 | 19 | 17 | 21 | 253 |
| 2021 | 12 | 12 | 15 | 31 | 28 | 32 | 21 | 22 | 21 | 8 | 8 | 10 | 220 |
| 2022 | 10 | 9 | 12 | 24 | 24 | 28 | 12 | 14 | 13 | 6 | 6 | 8 | 166 |
| 2023 | 5 | 5 | 7 | 16 | 18 | 19 | 11 | 13 | 13 | 9 | 9 | 9 | 134 |
| 2024 | 8 | 8 | 9 | 13 | 13 | 13 | 9 | 9 | 11 | 10 | 8 | 10 | 121 |
| 2025 | 6 | 5 | 7 | 6 | 6 | 8 | 8 | 8 | 10 | 6 | 5 | 6 | 81 |
| 2026 | 7 | 0 | 4 | 0 | 0 | 0 | 0 | 0 | 0 | — | — | — | 11 |







