Mercedes-AMG GT
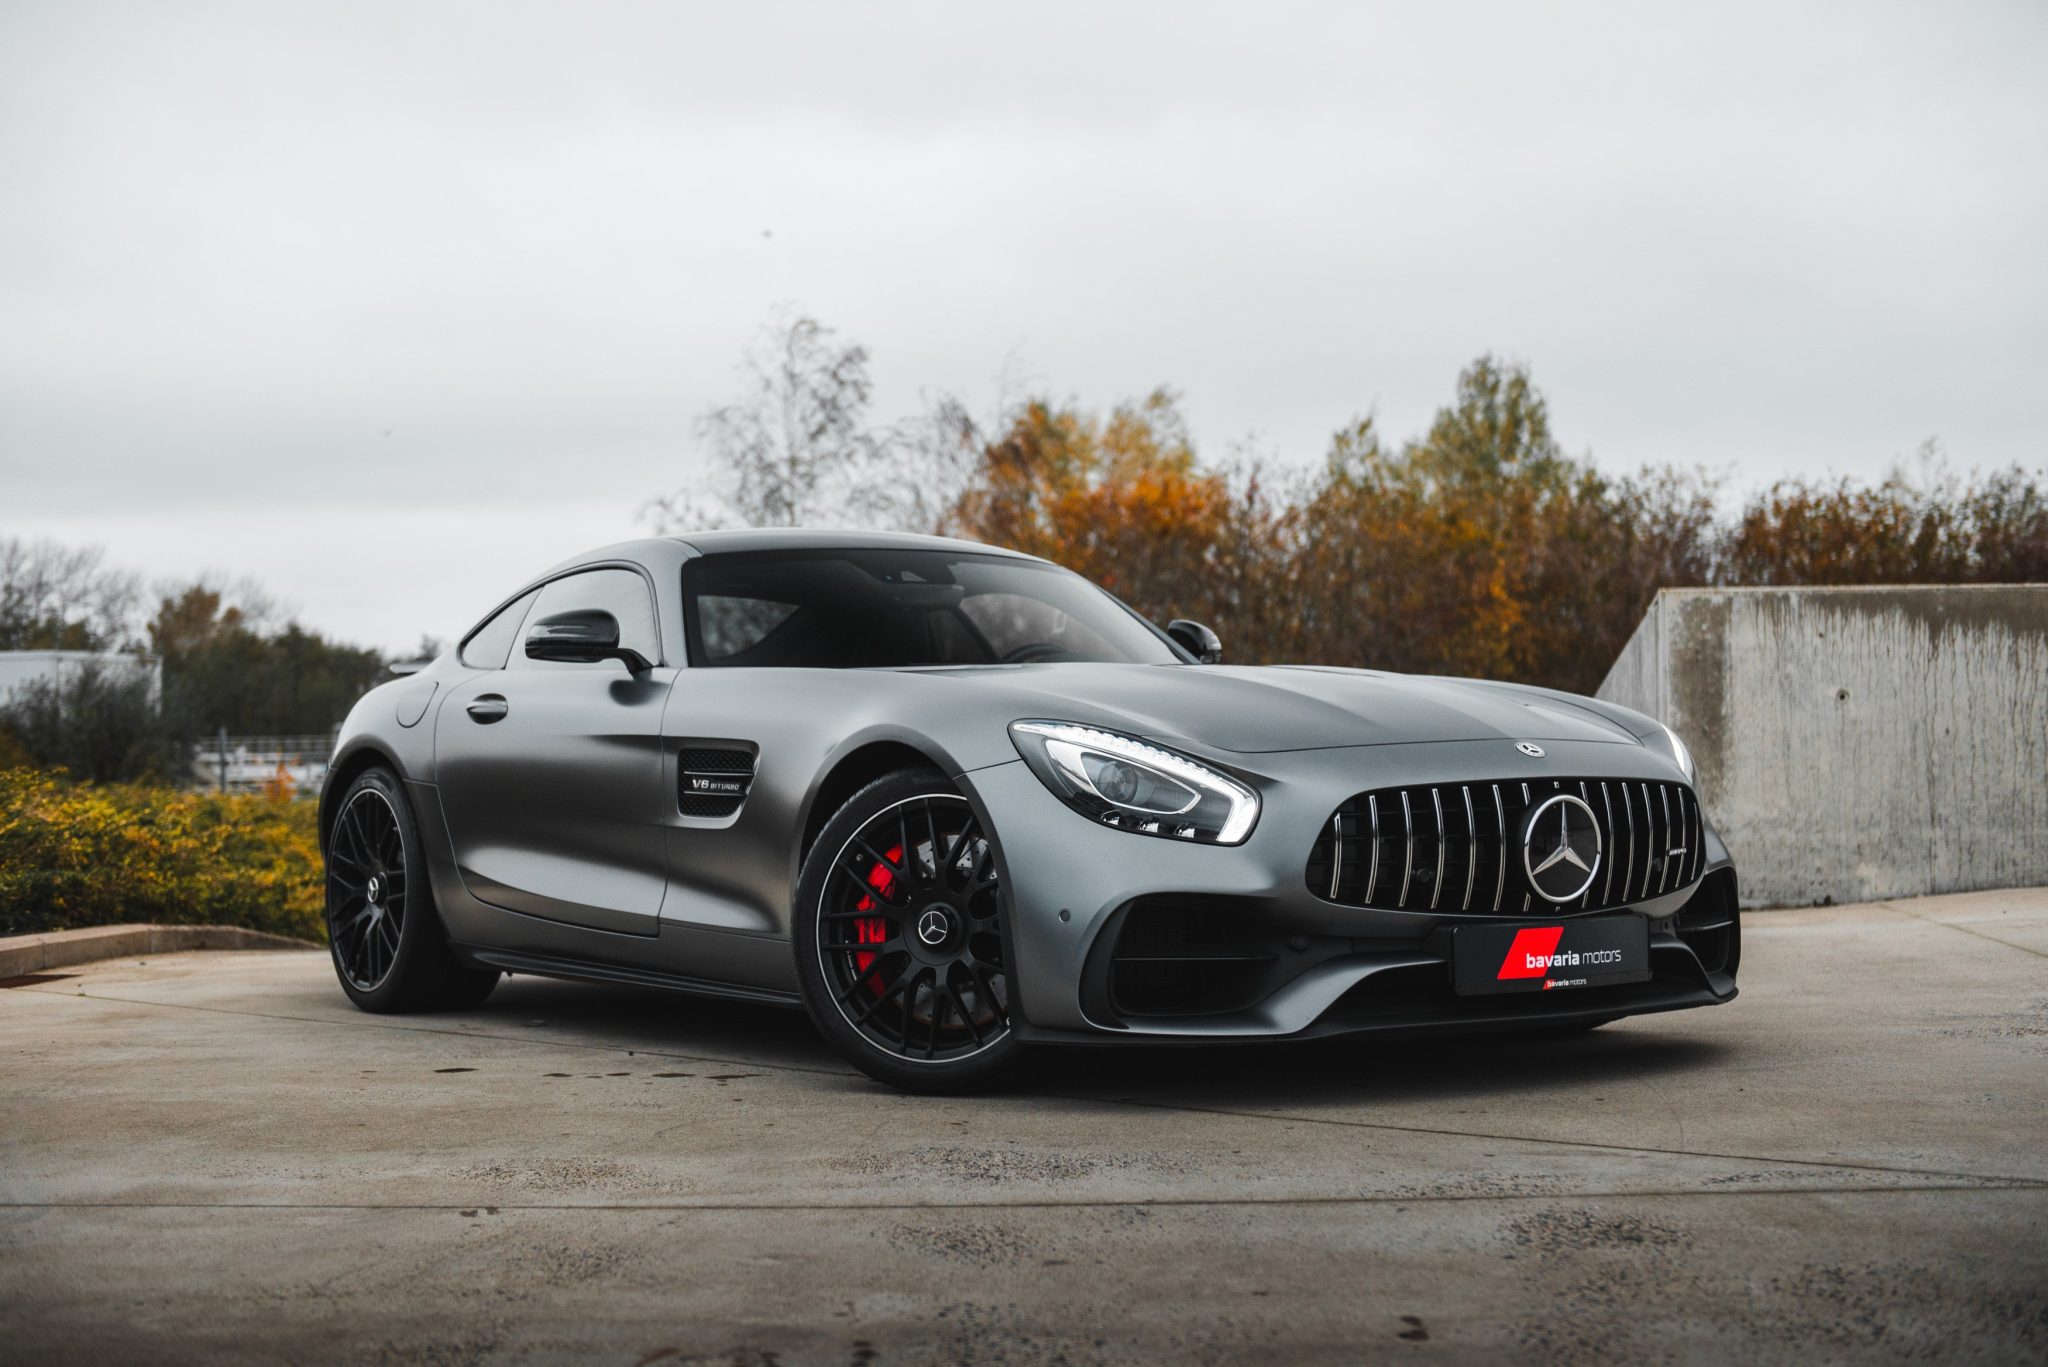
Here you will find monthly and yearly United States and Canadian sales figures for the Mercedes-AMG GT. The AMG GT is the sports car developed in-house by Mercedes-AMG, and it reached American showrooms in the spring of 2015. The current generation is a 2+2 coupe, seating two with two more seats optional, offered with a turbocharged four-cylinder, a twin-turbo V8 or a plug-in hybrid V8. Mercedes-Benz reports its sales by quarter, so many of the monthly figures below are quarterly totals spread across three months.
- Class: High-performance luxury sports car, 2+2 coupe (2 seats standard, 4 optional)
- AMG GT 43: 2.0L turbocharged inline four with hybrid assist, 416 hp and 369 lb-ft, rear-wheel drive
- AMG GT 55: 4.0L V8 biturbo, 469 hp and 516 lb-ft, AMG Performance 4MATIC+ all-wheel drive
- AMG GT 63: 4.0L V8 biturbo, 577 hp and 590 lb-ft, AMG Performance 4MATIC+ all-wheel drive
- AMG GT 63 PRO: 4.0L V8 biturbo, 603 hp and 627 lb-ft, AMG Performance 4MATIC+ all-wheel drive
- Plug-in hybrid: AMG GT 63 S E PERFORMANCE
- Transmission: AMG SPEEDSHIFT MCT 9-speed
- Chief rivals: Porsche 911, Chevrolet Corvette, BMW M8, Aston Martin Vantage
Mercedes-AMG GT Sales in the United States
The Mercedes-AMG GT chart for the United States opens in April 2015, and the car found 1,277 buyers over the rest of that year. Volume held between 1,227 and 1,609 a year through 2018 before jumping to a record 4,208 in 2019, when November alone produced 534 sales, the best month on record. Sales then eased to 3,489 in 2020, 3,109 in 2021, 2,968 in 2022 and 2,092 in 2023, the lowest total since 2018. The current generation lifted the nameplate back to 3,492 in 2024, its second-best year. The 2025 total came to 2,855, down 18.2 percent, and the first half of 2026 totals 1,448, down 5.7 percent from 1,536 over the same months of 2025.
Mercedes-Benz AMG GT, United States calendar-year unit sales, 2015–2026. 2026 is January–Sep (partial).
Annual sales
| Year | Units | YoY |
|---|---|---|
| 2015 | 1,277 | — |
| 2016 | 1,227 | ▼ 3.9% |
| 2017 | 1,609 | ▲ 31.1% |
| 2018 | 1,525 | ▼ 5.2% |
| 2019 | 4,208 | ▲ 175.9% |
| 2020 | 3,489 | ▼ 17.1% |
| 2021 | 3,109 | ▼ 10.9% |
| 2022 | 2,968 | ▼ 4.5% |
| 2023 | 2,092 | ▼ 29.5% |
| 2024 | 3,492 | ▲ 66.9% |
| 2025 | 2,855 | ▼ 18.2% |
| 2026 (Jan–Sep) | 2,044 | ▲ 3.0% YTD |
Monthly sales
| Year | Jan | Feb | Mar | Apr | May | Jun | Jul | Aug | Sep | Oct | Nov | Dec | Total |
|---|---|---|---|---|---|---|---|---|---|---|---|---|---|
| 2015 | — | — | — | 205 | 296 | 106 | 89 | 87 | 109 | 105 | 118 | 162 | 1,277 |
| 2016 | 125 | 95 | 140 | 140 | 99 | 79 | 57 | 112 | 111 | 81 | 89 | 99 | 1,227 |
| 2017 | 81 | 93 | 103 | 87 | 59 | 118 | 179 | 120 | 60 | 245 | 281 | 183 | 1,609 |
| 2018 | 129 | 138 | 114 | 178 | 201 | 154 | 104 | 100 | 89 | 79 | 103 | 136 | 1,525 |
| 2019 | 83 | 134 | 427 | 340 | 500 | 374 | 325 | 338 | 347 | 361 | 534 | 445 | 4,208 |
| 2020 | 314 | 407 | 246 | 243 | 298 | 307 | 263 | 234 | 253 | 312 | 256 | 356 | 3,489 |
| 2021 | 388 | 388 | 436 | 377 | 363 | 377 | 161 | 155 | 161 | 101 | 101 | 101 | 3,109 |
| 2022 | 301 | 301 | 339 | 329 | 317 | 317 | 169 | 176 | 169 | 183 | 176 | 191 | 2,968 |
| 2023 | 210 | 202 | 227 | 240 | 231 | 240 | 147 | 159 | 153 | 93 | 93 | 97 | 2,092 |
| 2024 | 232 | 232 | 242 | 340 | 353 | 353 | 243 | 273 | 224 | 295 | 346 | 359 | 3,492 |
| 2025 | 268 | 276 | 336 | 236 | 215 | 205 | 156 | 163 | 130 | 271 | 276 | 323 | 2,855 |
| 2026 | 252 | 258 | 294 | 209 | 228 | 207 | 206 | 210 | 180 | — | — | — | 2,044 |
Mercedes-AMG GT Sales in Canada
In Canada the AMG GT chart starts in May 2015 with 145 sales for the year. Volume grew to 249 in 2017 and reached 424 in 2019 before settling between 250 and 397 a year from 2020 through 2024. The 2025 total of 445 is the best Canadian year on record, up 52.4 percent from 292 in 2024, helped by a second quarter of 169. The first half of 2026 totals 144, down 43.5 percent from 255 a year earlier.
Mercedes-Benz AMG GT, Canada calendar-year unit sales, 2015–2026. 2026 is January–Sep (partial).
Annual sales
| Year | Units | YoY |
|---|---|---|
| 2015 | 145 | — |
| 2016 | 175 | ▲ 20.7% |
| 2017 | 249 | ▲ 42.3% |
| 2018 | 226 | ▼ 9.2% |
| 2019 | 424 | ▲ 87.6% |
| 2020 | 298 | ▼ 29.7% |
| 2021 | 250 | ▼ 16.1% |
| 2022 | 325 | ▲ 30.0% |
| 2023 | 397 | ▲ 22.2% |
| 2024 | 292 | ▼ 26.4% |
| 2025 | 445 | ▲ 52.4% |
| 2026 (Jan–Sep) | 216 | ▼ 40.2% YTD |
Monthly sales
| Year | Jan | Feb | Mar | Apr | May | Jun | Jul | Aug | Sep | Oct | Nov | Dec | Total |
|---|---|---|---|---|---|---|---|---|---|---|---|---|---|
| 2015 | 0 | 0 | 0 | 0 | 34 | 24 | 20 | 13 | 10 | 17 | 15 | 12 | 145 |
| 2016 | 11 | 10 | 18 | 26 | 19 | 9 | 8 | 30 | 21 | 11 | 7 | 5 | 175 |
| 2017 | 19 | 12 | 22 | 27 | 15 | 28 | 8 | 2 | 1 | 63 | 24 | 28 | 249 |
| 2018 | 22 | 23 | 30 | 28 | 24 | 23 | 16 | 16 | 13 | 13 | 7 | 11 | 226 |
| 2019 | 19 | 17 | 19 | 44 | 44 | 42 | 48 | 48 | 44 | 35 | 30 | 34 | 424 |
| 2020 | 21 | 19 | 22 | 30 | 28 | 32 | 29 | 27 | 29 | 20 | 19 | 22 | 298 |
| 2021 | 20 | 20 | 23 | 24 | 22 | 25 | 27 | 29 | 29 | 10 | 10 | 11 | 250 |
| 2022 | 28 | 26 | 32 | 27 | 27 | 31 | 32 | 37 | 34 | 17 | 17 | 17 | 325 |
| 2023 | 22 | 20 | 24 | 46 | 51 | 52 | 33 | 37 | 34 | 27 | 26 | 25 | 397 |
| 2024 | 15 | 14 | 16 | 29 | 29 | 29 | 29 | 29 | 28 | 26 | 23 | 25 | 292 |
| 2025 | 30 | 27 | 29 | 58 | 55 | 56 | 36 | 34 | 36 | 30 | 24 | 30 | 445 |
| 2026 | 20 | 18 | 19 | 28 | 30 | 29 | 27 | 24 | 21 | — | — | — | 216 |