
Alfa Romeo Sales Data, Trends, Analysis & Current Lineup for the U.S Automotive Market
This is your hub for all of the Alfa Romeo sales data for the U.S market. Alfa Romeo is an Italian car manufacturer which primarily produces luxury vehicles. The company is known for their technological and design innovations for producing their vehicles. We all want Alfa Romeo to do well in the U.S.
The company started selling cars in the US in 1961 but ceased exporting cars to the country in 1995. As Alfa Romeo never really establshed itself in the North America. They didn’t see the American region as a priority and instead focused on the European market. Since then, we all waited with baited breath every time there was a rumor that Alfa was coming back to our shores. Most people still don’t believe that the brand is back in the States and resumed their sales in 2008. Today, Alfa Romeo is dead serious about not just reestablishing the brand in the US, but also reinventing the company’s image so their cars will appeal to a much wider automotive audience.
Alfa Romeo U.S Sales Figures & Recent Highlights
Alfa Romeo was re-introduced to the United States in 2008 with the 8C Competizione sports car, of which 90 units were imported into the US, as well as 35 of the 8C Spider. This was followed by the 4C coupe and spider in 2015. The brand had previously been sold in the US from the mid 1950s until 1995, during which time the Spider (Duetto) was the most popular model. The last Alfa Romeo to be sold during that time was the 164, which had replaced the Milano (known as the 75 in Europe). Alfa will continue to import all of its vehicles for the US market from Italy. Currently, Alfa Romeo sells the 4C, the Giulia midsized sedan and the Stelvio midsized SUV in the United States. Below we have the sales figures for the Alfa Romeo Brand in the U.S automotive market. This data comes from the manufacturer directly. View the data tables of the total number of new Alfa Romeo Brand vehicles sold in the U.S. in a given month and year.
Alfa Romeo sold a total of 12,843 cars in the United States, down 30% from 2021. The best-selling model was the Giulia, with 4,646 units sold, followed by the Stelvio with 4,529 units sold.
Overall, Alfa Romeo is struggling to sell cars in the United States. The brand has a long history of quality problems and reliability issues, which have turned off many potential buyers. In addition, Alfa Romeo’s lineup is relatively small, with only three models currently available in the U.S. The Tonale is expected to help boost sales, but it remains to be seen if it will be enough to turn things around for the brand.
Alfa Romeo has a very limited dealer network in the U.S., which makes it difficult for potential buyers to test drive or purchase a car. Alfa Romeo cars are priced higher than many of its competitors, which can make them a tough sell for budget-minded buyers. Alfa Romeo has a long history of quality problems, which has damaged the brand’s reputation and it continues today with stories of new cars having to spend months in the shop for repairs.
Despite these challenges, Alfa Romeo is committed to growing its presence in the U.S. market. In May 2023, Alfa Romeo announced that it would be launching the Tonale, a new compact SUV, in the United States in the fall of 2023. The launch of the Tonale is a key part of its groeth strategy, and the brand is also expanding its dealer network and investing in marketing. It remains to be seen if these efforts will be enough to turn things around for Alfa Romeo, but the brand is certainly not giving up.
Alfa Romeo Monthly Sales Data in the Unites States
Below we have a table that shows Alfa Romeo sales for the United States automotive market, but this time it is broken out by month. This is on a unit basis. This is Alfa Romeo new vehicle sales in the US.
Alfa Romeo Annual Sales, Growth & Market Share in the United States
Below we have a table that shows total Alfa Romeo sales volumes for the US automotive market, broken out by year. This data captures all Alfa Romeo vehicle sales for the entire United States automotive market.
| Year | Sales | YOY Change | US Marketshare | Marketshare Change |
|---|---|---|---|---|
| 1985 | 345 | 0.00 | 0.01 | 0.00 |
| 1986 | 4,596 | 1,232.17 | 0.12 | 91.94 |
| 1987 | 3,401 | -26.00 | 0.09 | -23.72 |
| 1988 | 2,148 | -36.84 | 0.06 | -67.50 |
| 1989 | 1,857 | -13.55 | 0.05 | -4.51 |
| 1990 | 1,941 | 4.52 | 0.06 | 17.38 |
| 1991 | 1,389 | -28.44 | 0.05 | -27.23 |
| 1992 | 1,102 | -20.66 | 0.04 | -19.41 |
| 1993 | 605 | -45.10 | 0.02 | -93.05 |
| 1994 | 208 | -65.62 | 0.01 | -154.42 |
| 1995 | 0 | -100.00 | 0.00 | 0.00 |
| 1996 | 0 | 0.00 | 0.00 | 0.00 |
| 1997 | 0 | 0.00 | 0.00 | 0.00 |
| 1998 | 0 | 0.00 | 0.00 | 0.00 |
| 1999 | 0 | 0.00 | 0.00 | 0.00 |
| 2000 | 0 | 0.00 | 0.00 | 0.00 |
| 2001 | 0 | 0.00 | 0.00 | 0.00 |
| 2002 | 0 | 0.00 | 0.00 | 0.00 |
| 2003 | 0 | 0.00 | 0.00 | 0.00 |
| 2004 | 0 | 0.00 | 0.00 | 0.00 |
| 2005 | 0 | 0.00 | 0.00 | 0.00 |
| 2006 | 0 | 0.00 | 0.00 | 0.00 |
| 2007 | 0 | 0.00 | 0.00 | 0.00 |
| 2008 | 0 | 0.00 | 0.00 | 0.00 |
| 2009 | 0 | 0.00 | 0.00 | 0.00 |
| 2010 | 0 | 0.00 | 0.00 | 0.00 |
| 2011 | 0 | 0.00 | 0.00 | 0.00 |
| 2012 | 0 | 0.00 | 0.00 | 0.00 |
| 2013 | 0 | 0.00 | 0.00 | 0.00 |
| 2014 | 67 | 0.00 | 0.00 | 100.00 |
| 2015 | 663 | 889.55 | 0.00 | 89.30 |
| 2016 | 528 | -20.36 | 0.00 | -26.24 |
| 2017 | 12,031 | 2,178.60 | 0.07 | 95.69 |
| 2018 | 23,800 | 97.82 | 0.14 | 49.16 |
| 2019 | 18,294 | -23.13 | 0.11 | -27.67 |
| 2020 | 18,585 | 1.59 | 0.13 | 15.09 |
| 2021 | 18,252 | -1.79 | 0.12 | -3.51 |
| 2022 | 12,843 | -29.64 | 0.09 | -30.08 |
| 2023 | 10,897 | -15.15 | 0.07 | -33.78 |
| 2024 | 2,286 | 0.00 | 0.06 | 0.00 |
Alfa Romeo U.S Annual Sales Units & Growth Chart
Below is a visual representation of Alfa Romeo’s U.S sales units over time. We have both the Alfa Romeo sales units and the growth in the United States market. Click on the items in the legend to see each series by itself.
Alfa Romeo U.S Growth Rate & Market Share Chart
Below is the annual growth rate for the Alfa Romeo brand in the United States, shown against the Alfa Romeo’s marketshare changes in the United States. This gives you a good look into how Alfa Romeo has faired against the other brands in terms of absolute sales and effect on marketshare. Click on the items in the legend to see each series by itself.
The Best-Selling Alfa Romeo Cars & SUVs in the United States
The best-selling model was the Giulia followed by the Stelvio. Both are neck and neck most years in terms of sales volume. The Alfa Romeo Giulia and Stelvio are two of the most stylish and performance-oriented cars on the market. They are both powered by turbocharged 2.0-liter four-cylinder engines that produce 280 horsepower and 306 pound-feet of torque. The Giulia can accelerate from 0 to 60 mph in 5.1 seconds, while the Stelvio takes 5.4 seconds. Both cars come standard with rear-wheel drive, but all-wheel drive is available as an option.
The Giulia is a mid-size sedan that offers a comfortable and luxurious ride. It also has a spacious trunk and a well-equipped interior. The Stelvio is a compact SUV that offers a more rugged and outdoorsy experience. It also has more cargo space than the Giulia.
Both the Giulia and Stelvio are available in a variety of trim levels, including the base Sprint, the sporty Veloce, and the high-performance Quadrifoglio. The Quadrifoglio is powered by a 2.9-liter V6 engine that produces 505 horsepower and 443 pound-feet of torque. It can accelerate from 0 to 60 mph in 3.8 seconds.
The Giulia and Stelvio are both well-reviewed cars. They have been praised for their stylish design, engaging handling, and powerful engines. However, they have also been criticized for their relatively high prices and limited availability.
The Current Alfa Romeo Model Lineup & Prices in the U.S
It is a rather small lineup but we are pretty excited about the current generation Alfa Romeo’s for sale in the U.S. The current lineup continues with the Stelvio SUV and the Giulia sedan, but adds the new hybrid Tonale. In addition we continue to see the spicy QV versions that are the ultimate enthusiast interpretations of the base models.
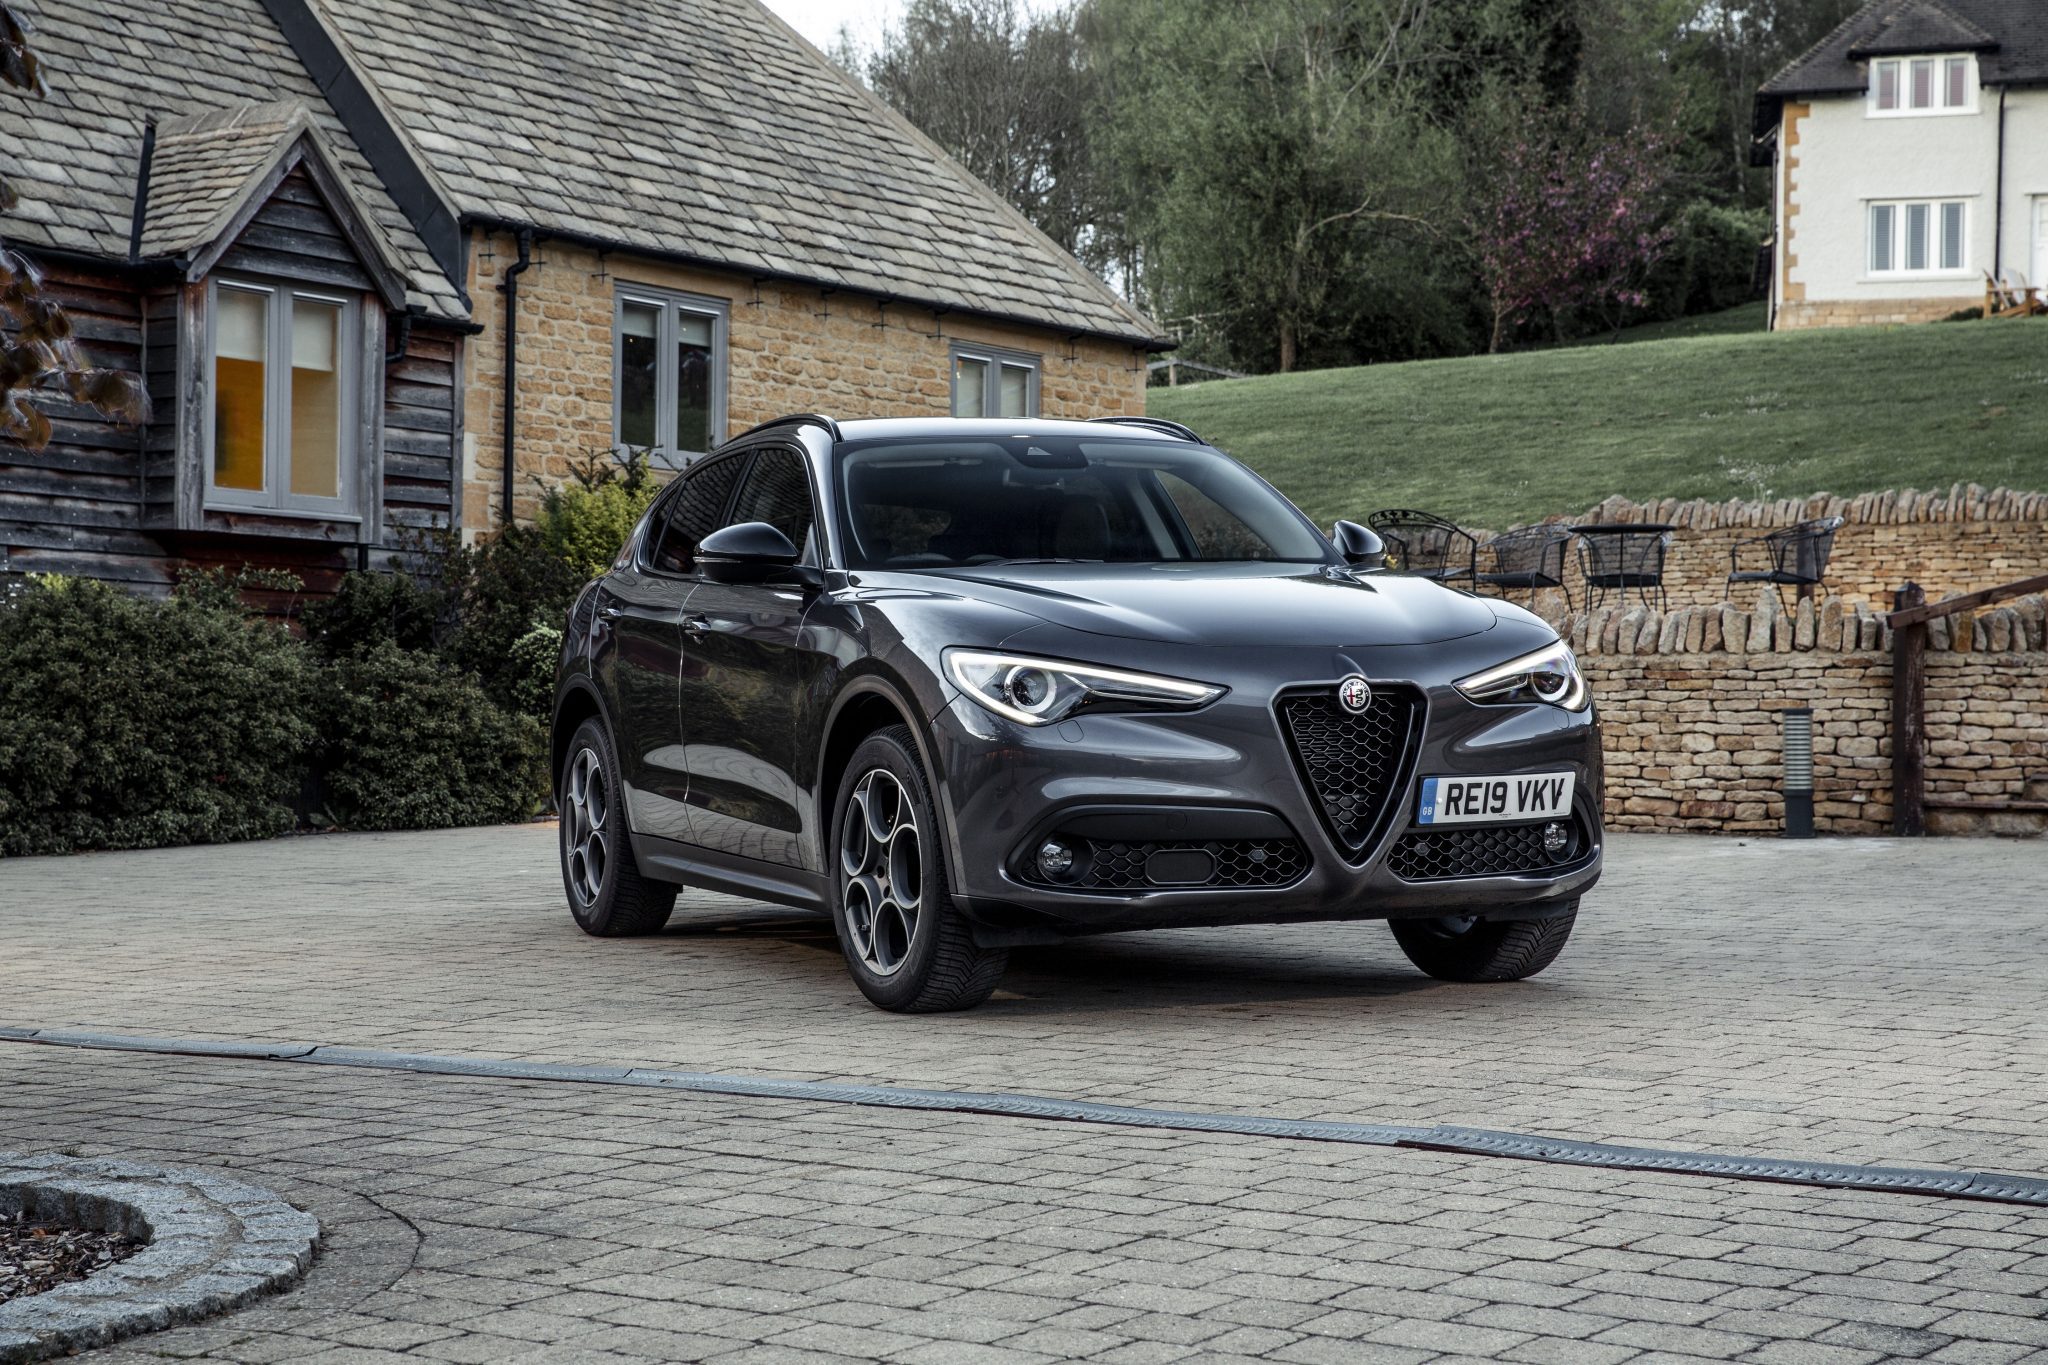
Alfa Romeo Stelvio
Starting at $44,775
The Alfa Romeo Stelvio is a mid-size luxury SUV that was first introduced in 2016. It is based on the same platform as the Alfa Romeo Giulia sedan, and it is available in rear-wheel drive or all-wheel drive configurations. The Stelvio is powered by a 2.0-liter turbocharged four-cylinder engine that produces 280 horsepower and 306 lb-ft of torque. It is mated to an eight-speed automatic transmission. The Stelvio can accelerate from 0 to 60 mph in 5.5 seconds. The Stelvio’s interior is luxurious and stylish. The seats are made of leather and Alcantara, and the dashboard is dominated by a 10.25-inch touchscreen infotainment system. The Stelvio also comes standard with a 12.3-inch digital instrument cluster. The Stelvio is a fun-to-drive SUV that offers a good balance of performance and luxury. It is also relatively fuel-efficient, with an EPA-estimated fuel economy of 24 mpg in the city and 30 mpg on the highway. The Stelvio is available in a variety of trim levels, including the base Stelvio, the Stelvio Ti, the Stelvio Veloce, and the Stelvio Quadrifoglio. The Quadrifoglio is the most powerful version of the Stelvio, and it is powered by a 2.9-liter twin-turbocharged V6 engine that produces 505 horsepower and 443 lb-ft of torque. It can accelerate from 0 to 60 mph in 3.6 seconds.
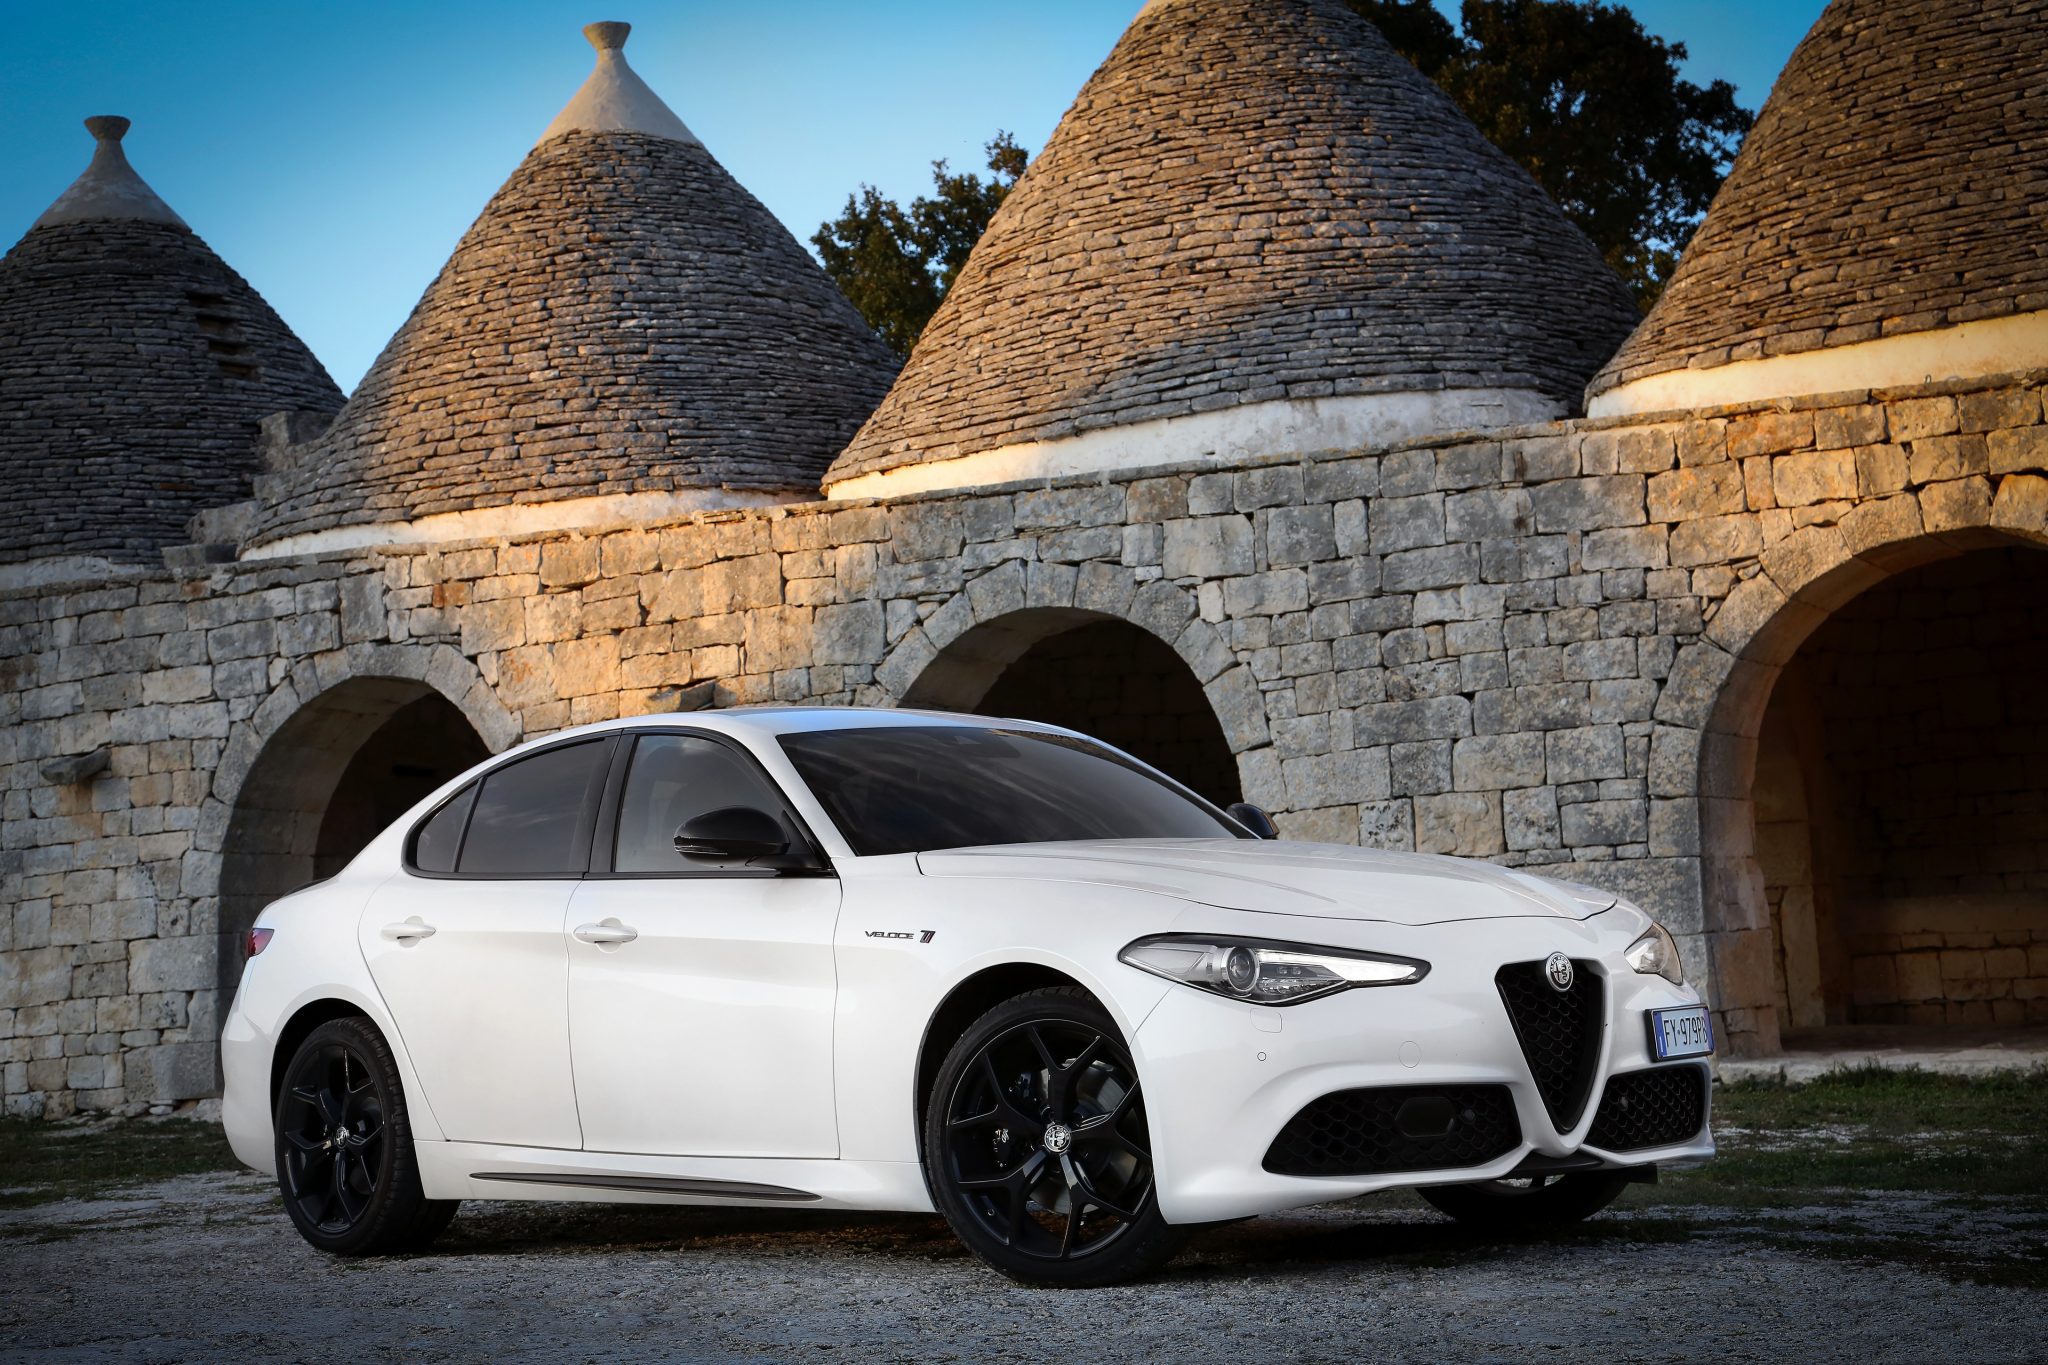
Alfa Romeo Giulia
Starting at $42,480
The Alfa Romeo Giulia is a compact executive car that was first introduced in 2015. It is available in rear-wheel drive or all-wheel drive configurations. The Giulia is powered by a 2.0-liter turbocharged four-cylinder engine that produces 280 horsepower and 306 lb-ft of torque. It is mated to an eight-speed automatic transmission. The Giulia can accelerate from 0 to 60 mph in 5.5 seconds. The Giulia’s interior is stylish and luxurious. The seats are made of leather and Alcantara, and the dashboard is dominated by a 10.25-inch touchscreen infotainment system. The Giulia also comes standard with a 12.3-inch digital instrument cluster. The Giulia is a fun-to-drive car that offers a good balance of performance and luxury. It is also relatively fuel-efficient, with an EPA-estimated fuel economy of 24 mpg in the city and 30 mpg on the highway. The Giulia is available in a variety of trim levels, including the base Giulia, the Giulia Ti, the Giulia Veloce, and the Giulia Quadrifoglio. The Quadrifoglio is the most powerful version of the Giulia, and it is powered by a 2.9-liter twin-turbocharged V6 engine that produces 505 horsepower and 443 lb-ft of torque. It can accelerate from 0 to 60 mph in 3.8 seconds.
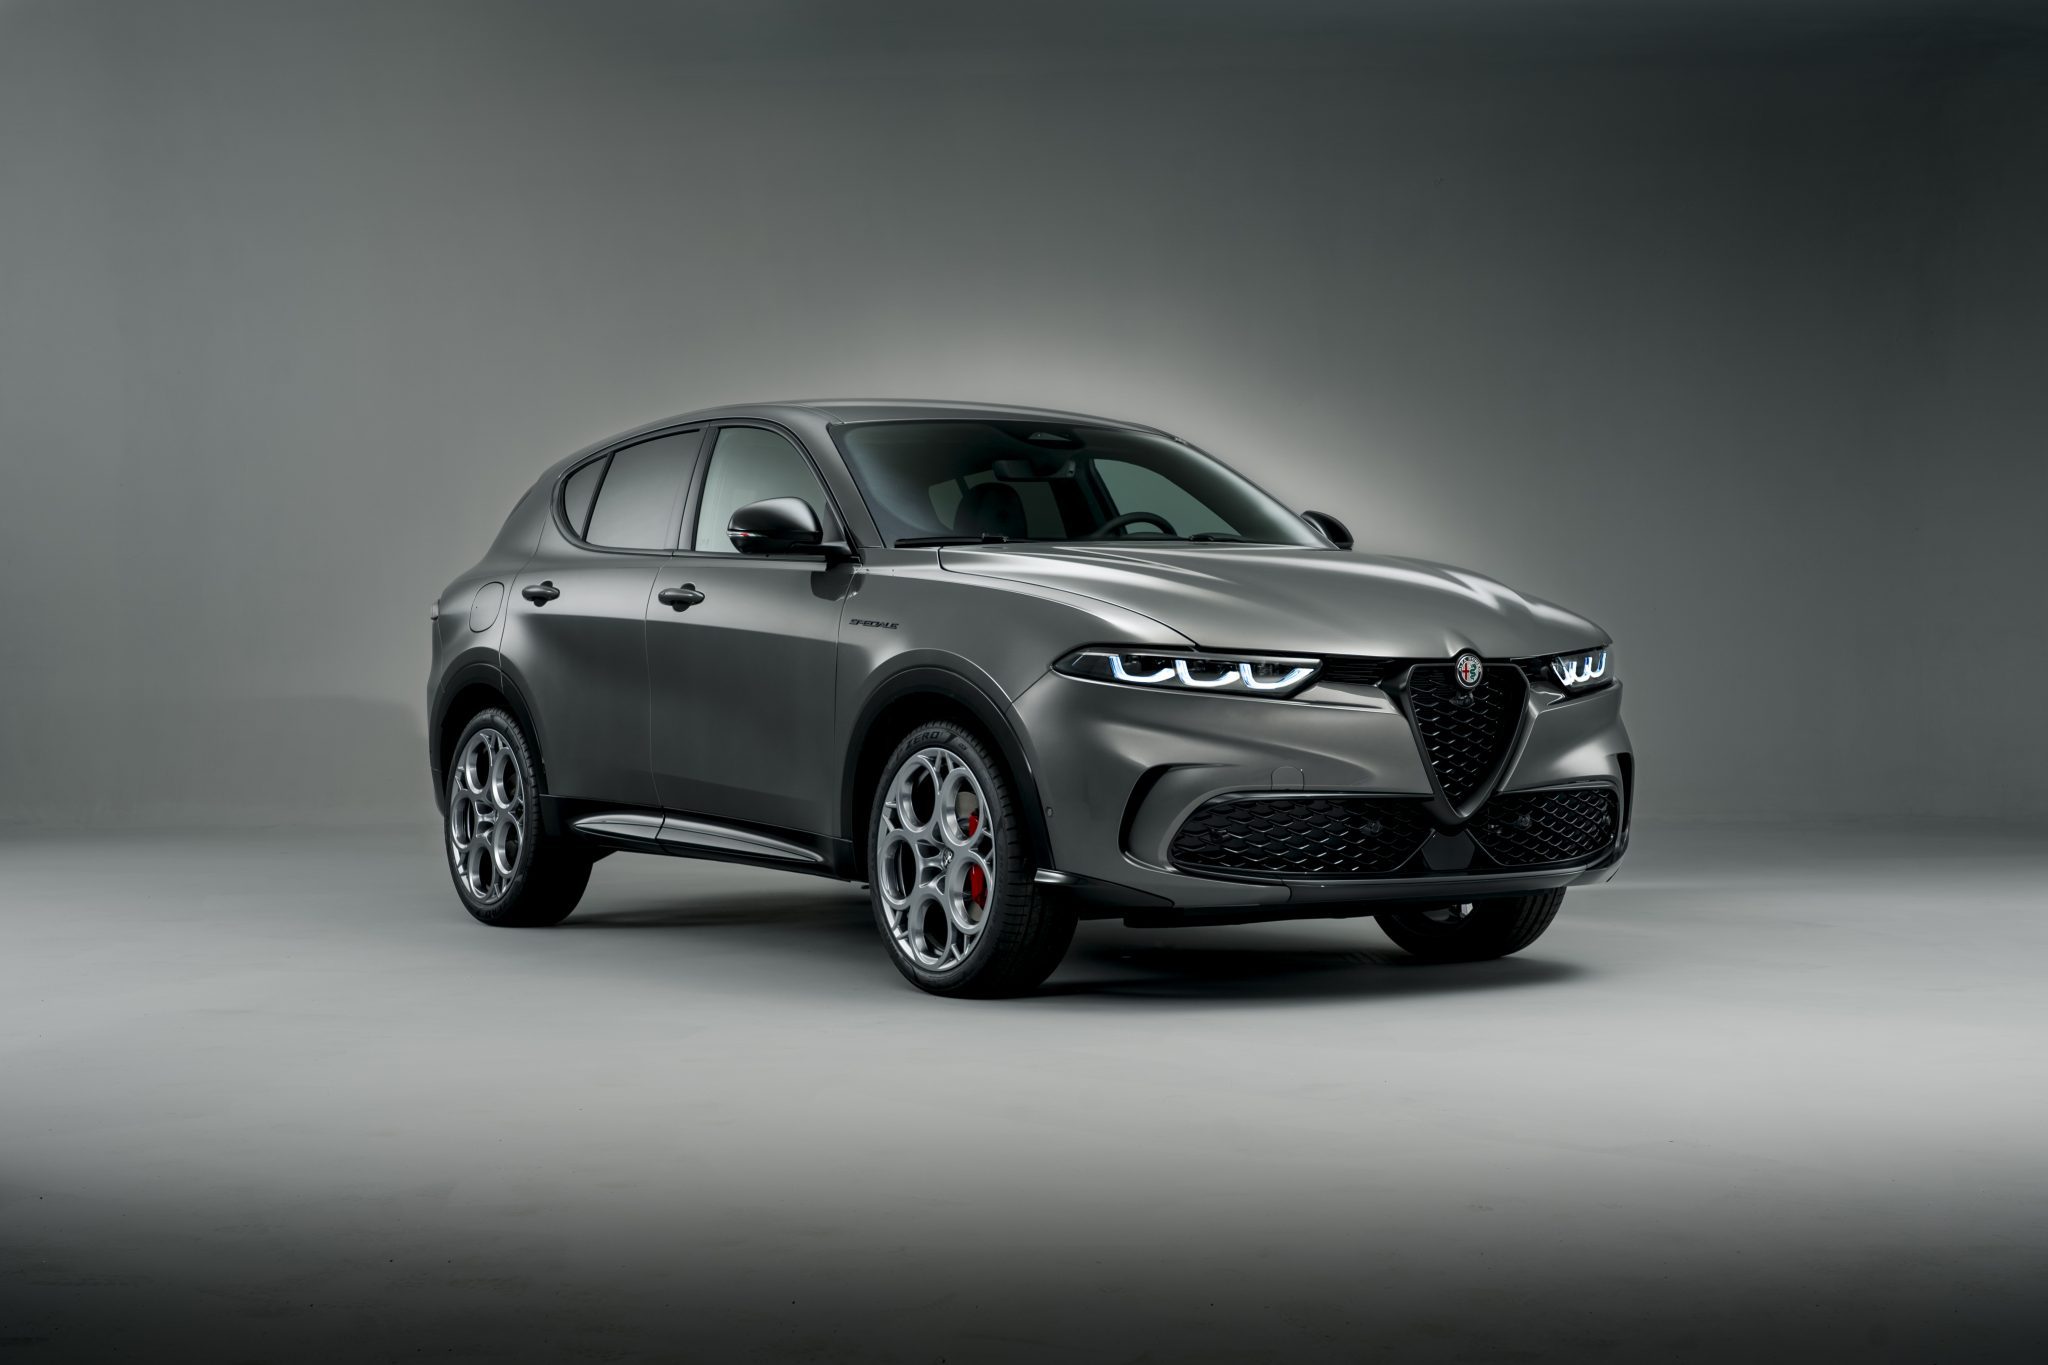
Alfa Romeo Tonale
Starting at $42,995
The Alfa Romeo Tonale is a compact luxury crossover SUV that was first introduced in 2023. It is the first SUV from Alfa Romeo to be offered with a plug-in hybrid powertrain. The Tonale is powered by a 1.3-liter turbocharged four-cylinder engine that produces 130 horsepower and 240 lb-ft of torque. It is mated to a six-speed automatic transmission and an electric motor that produces 95 horsepower. The Tonale can accelerate from 0 to 60 mph in 6.2 seconds. The Tonale also comes standard with all-wheel drive.
The Tonale’s interior is stylish and luxurious. The seats are made of leather and Alcantara, and the dashboard is dominated by a 10.25-inch touchscreen infotainment system. The Tonale also comes standard with a 12.3-inch digital instrument cluster. The Tonale is a fun-to-drive SUV that offers a good balance of performance and luxury. It is also relatively fuel-efficient, with an EPA-estimated fuel economy of 43 mpg in the city and 39 mpg on the highway (in hybrid mode). The Tonale is available in three trim levels: the base Tonale, the Tonale Ti, and the Tonale Veloce. The Veloce is the most powerful version of the Tonale, and it is powered by a 2.0-liter turbocharged four-cylinder engine that produces 256 horsepower and 295 lb-ft of torque. It can accelerate from 0 to 60 mph in 5.6 seconds.
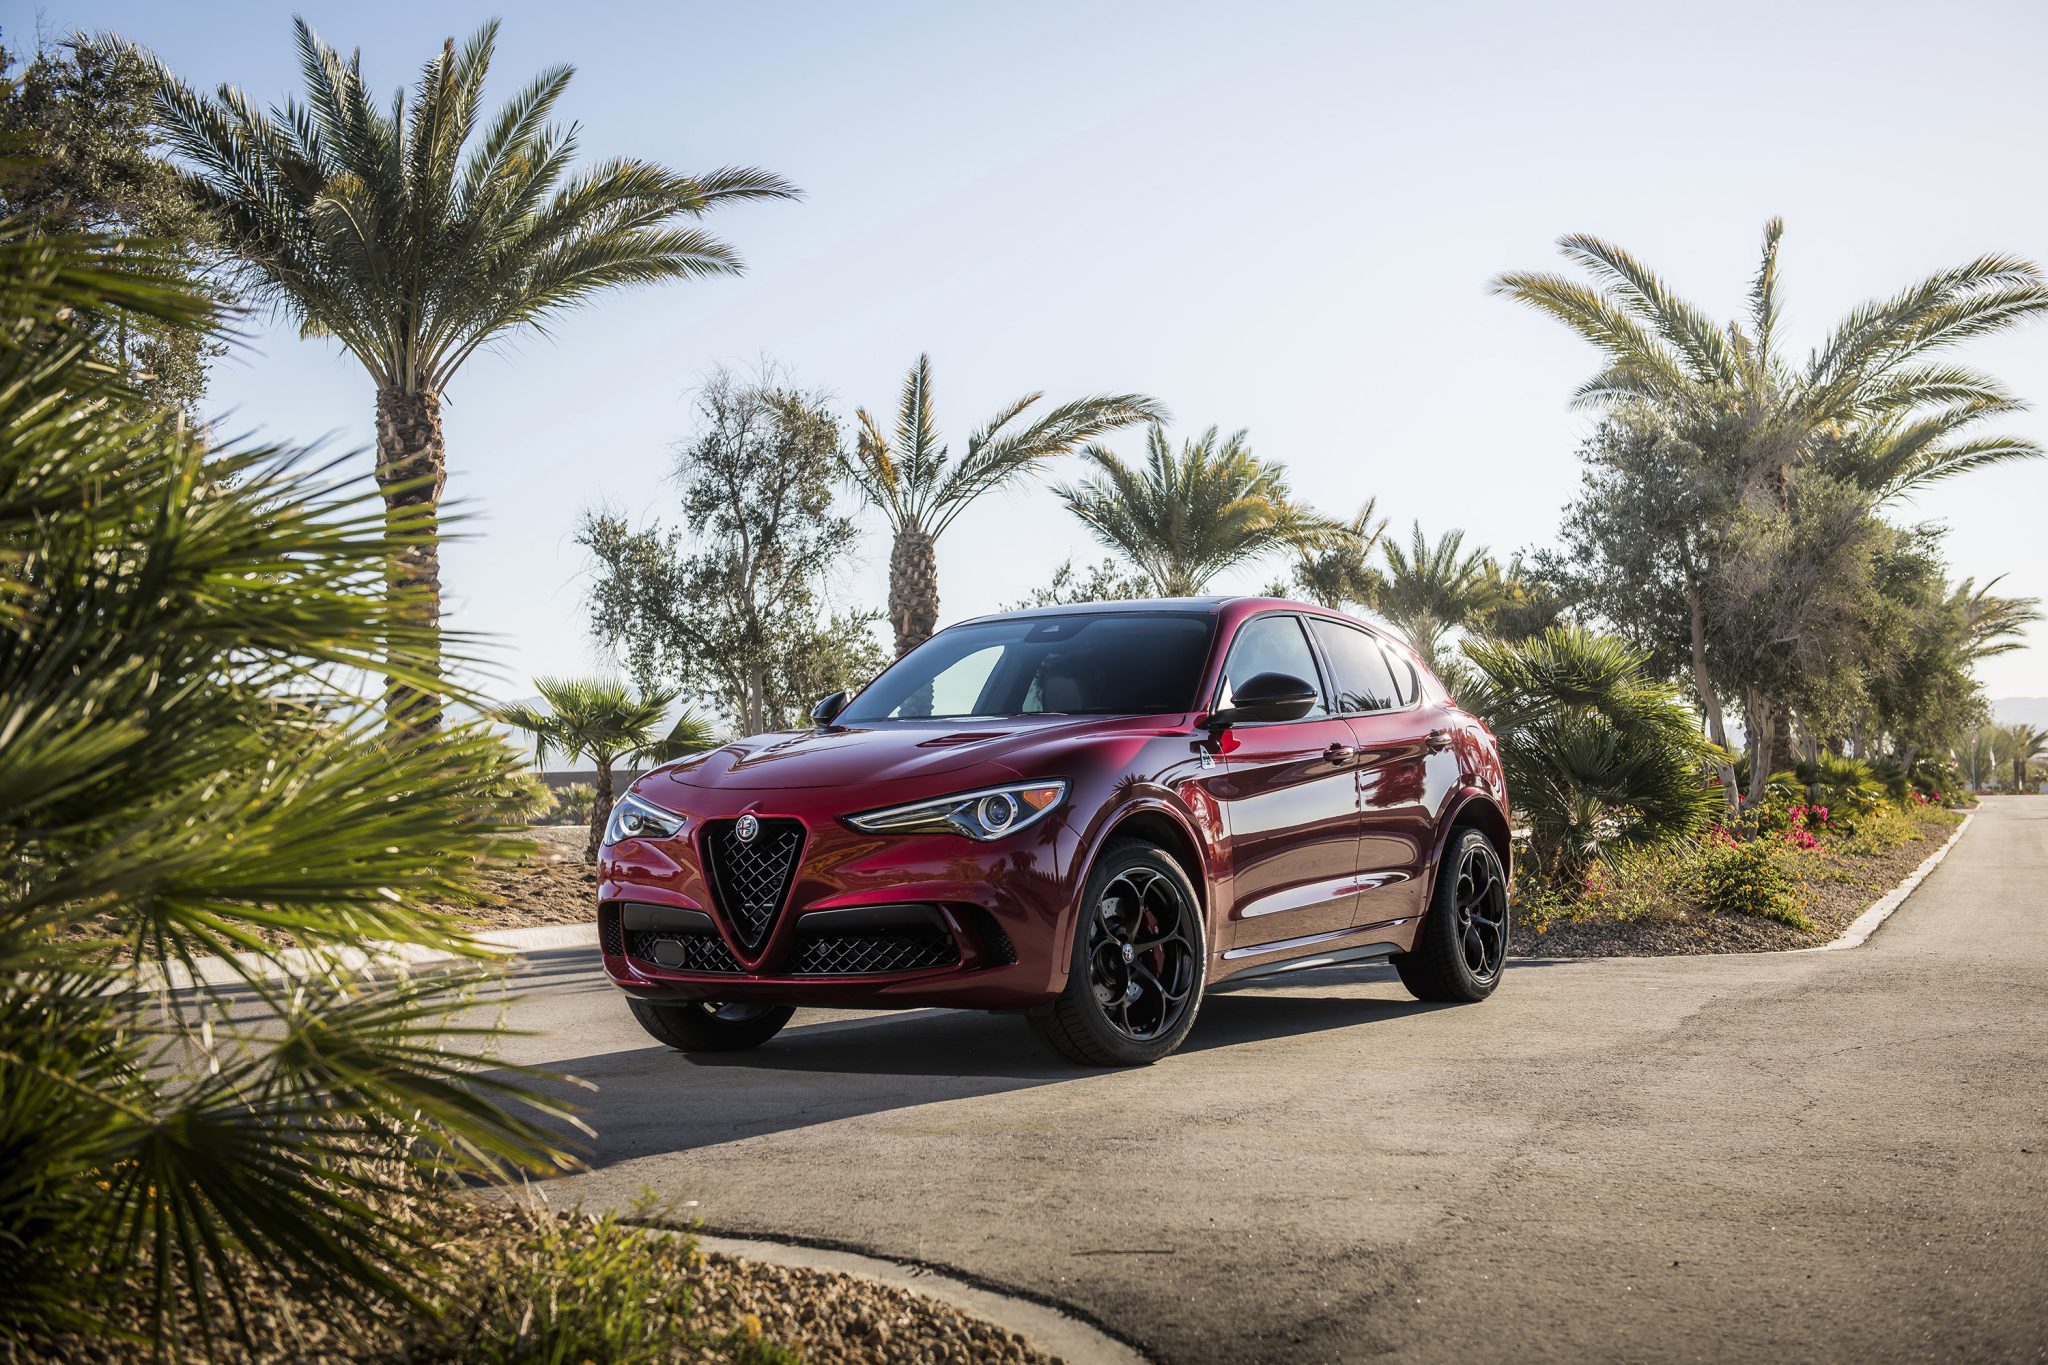
Alfa Romeo Stelvio Quadrifoglio
Starting at $87,875
The Alfa Romeo Stelvio Quadrifoglio is a high-performance SUV that was first introduced in 2017. It is powered by a 2.9-liter twin-turbocharged V6 engine that produces 505 horsepower and 443 lb-ft of torque. It is mated to an eight-speed automatic transmission and all-wheel drive. The Stelvio Quadrifoglio can accelerate from 0 to 60 mph in 3.6 seconds and has a top speed of 180 mph. The Stelvio Quadrifoglio’s interior is luxurious and sporty. The seats are made of leather and Alcantara, and the dashboard is dominated by a 10.25-inch touchscreen infotainment system. The Stelvio Quadrifoglio also comes standard with a 12.3-inch digital instrument cluster.
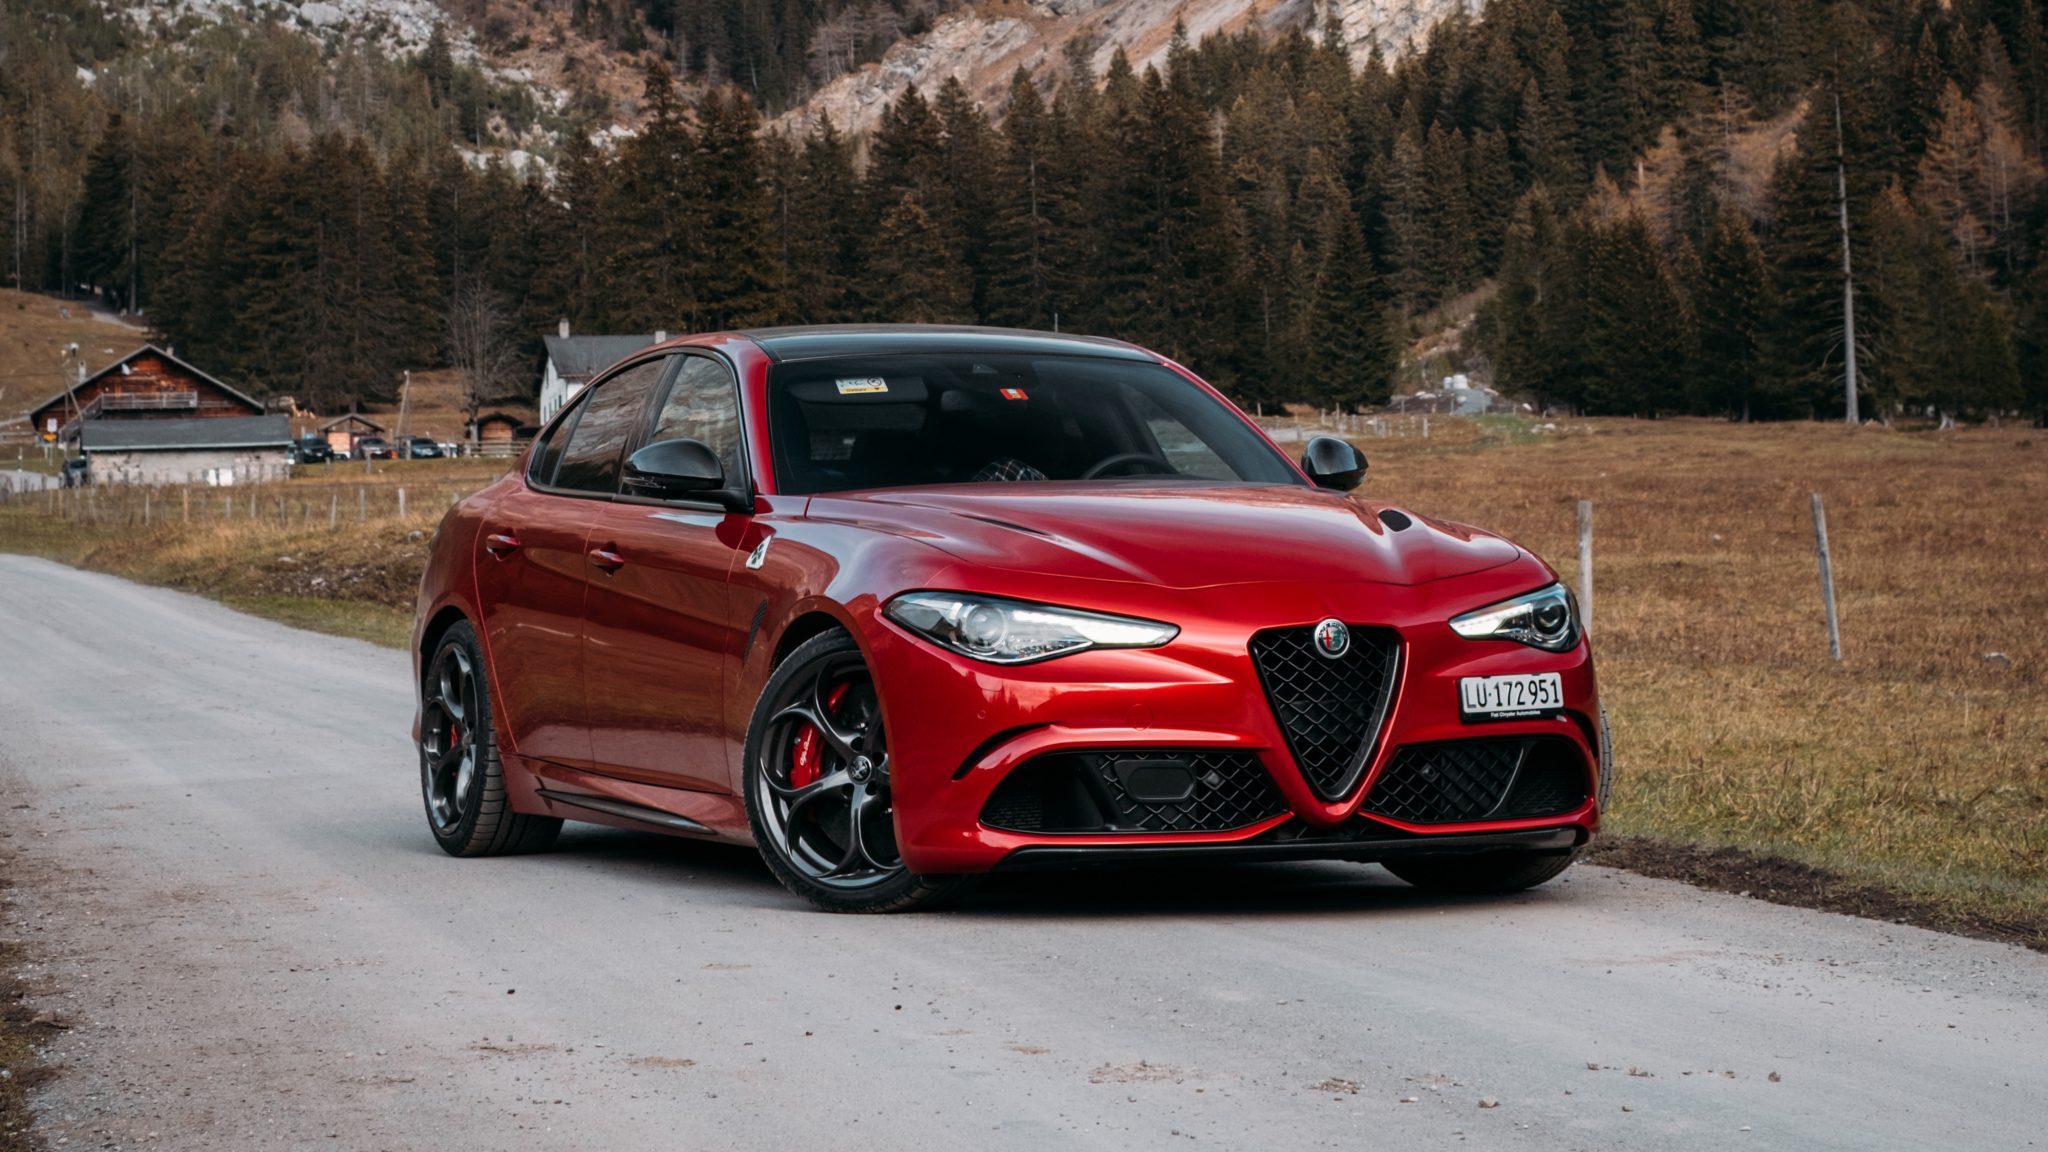
Alfa Romeo Giulia Quadrifoglio
Starting at $81,960
The Alfa Romeo Giulia Quadrifoglio is a high-performance sedan that was first introduced in 2016. It is powered by a 2.9-liter twin-turbocharged V6 engine that produces 505 horsepower and 443 lb-ft of torque. It is mated to an eight-speed automatic transmission and rear-wheel drive. The Giulia Quadrifoglio can accelerate from 0 to 60 mph in 3.8 seconds and has a top speed of 191 mph. The Giulia Quadrifoglio’s interior is luxurious and sporty. This is an absolute beast of a car.


