Hyundai Tucson
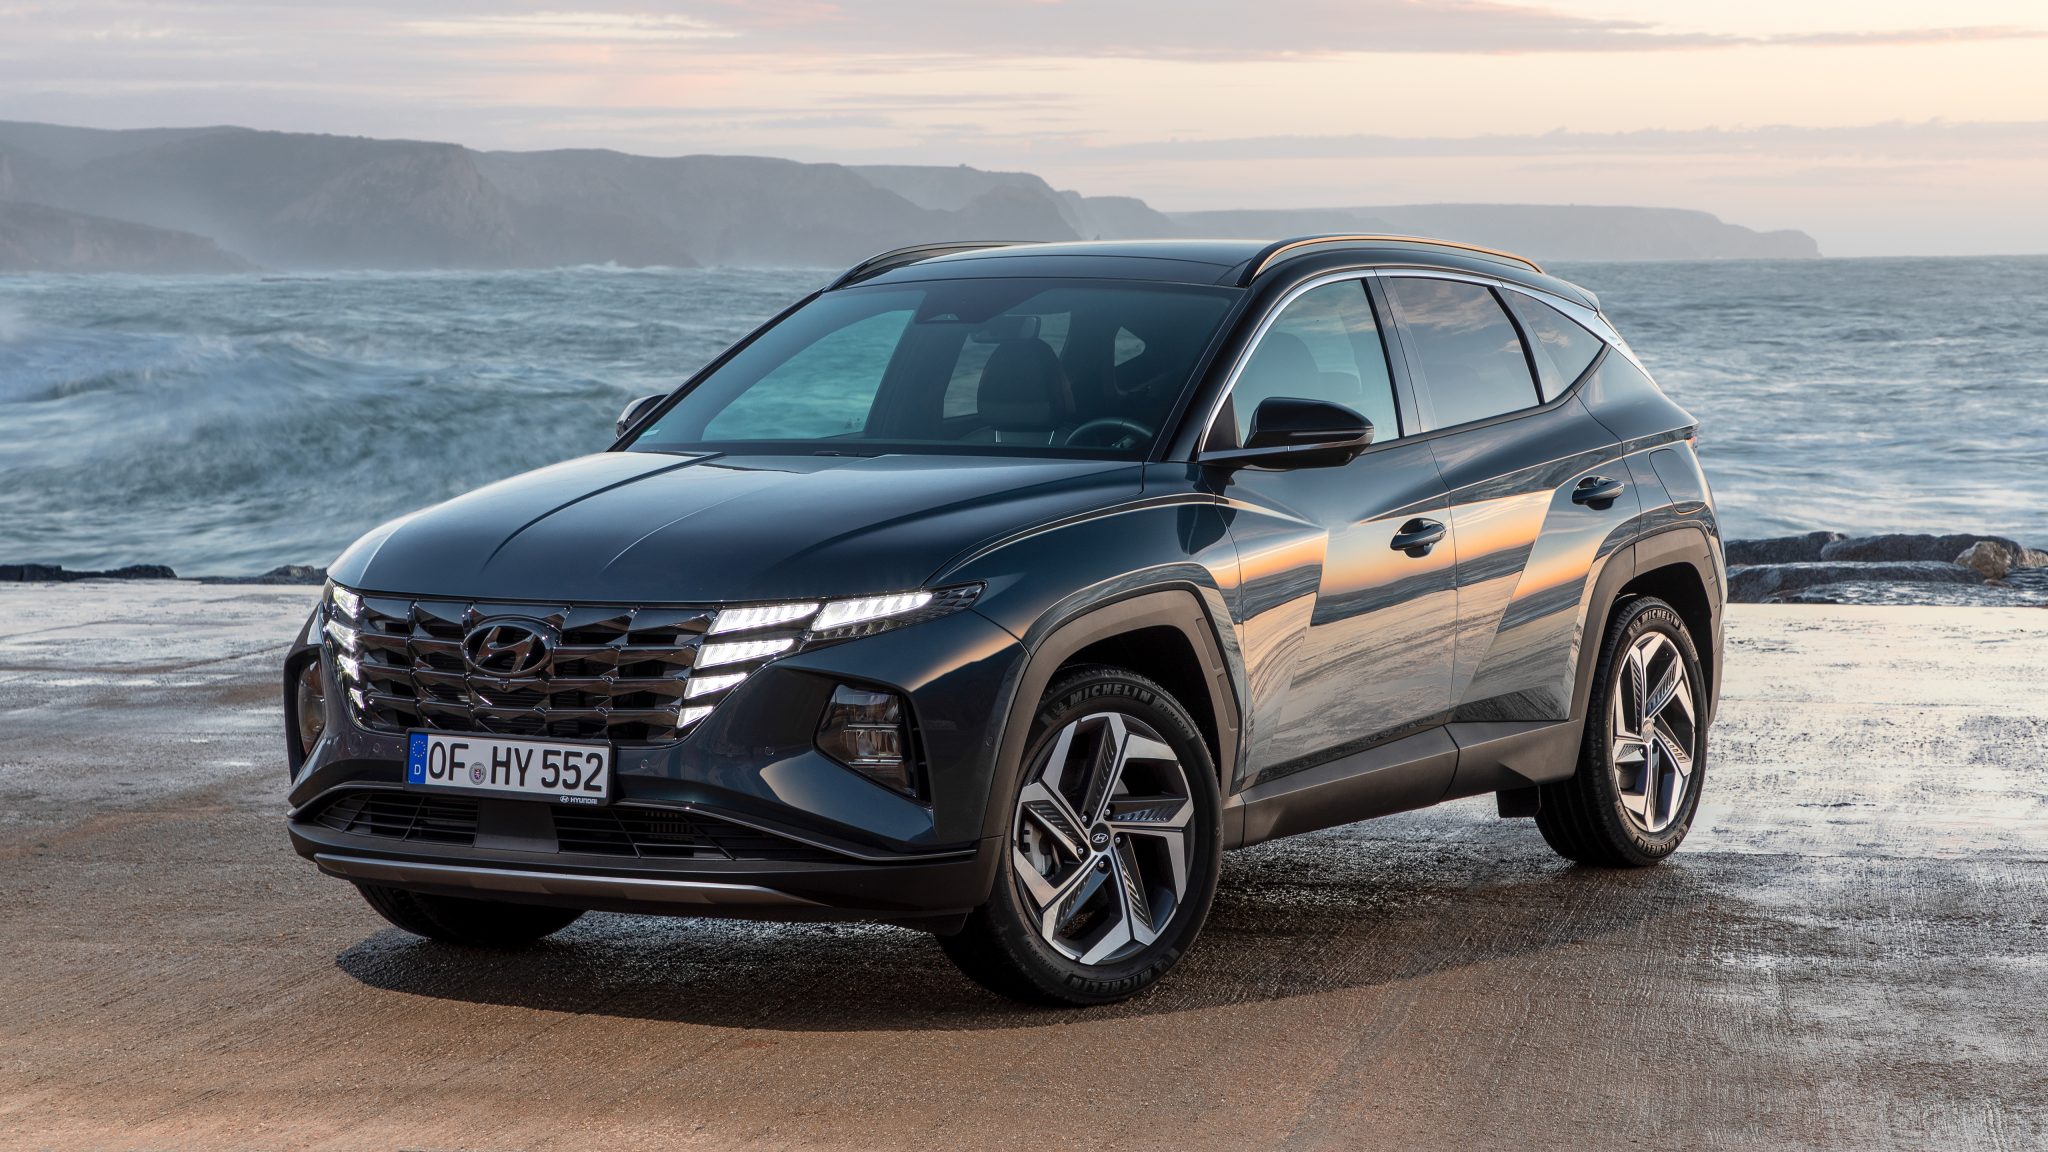
Here you will find monthly and yearly United States and Canadian sales figures for the Hyundai Tucson. The Tucson is Hyundai’s compact crossover SUV and one of the brand’s highest-volume models worldwide. Its current, fourth-generation design, offered with gasoline, hybrid, and plug-in hybrid powertrains, has driven the Tucson to record sales in both the United States and Canada.
- Class: Compact crossover SUV
- Gas engine: 2.5L four-cylinder, 187 horsepower and 178 lb-ft, eight-speed automatic
- Hybrid: 231 horsepower total, six-speed automatic
- Plug-in hybrid: 268 horsepower total
- Drivetrain: Front-wheel drive or HTRAC all-wheel drive
- Trims: SE, SEL, XRT, Limited
- Chief rivals: Toyota RAV4, Honda CR-V, Nissan Rogue, Chevrolet Equinox
Hyundai Tucson Sales in the United States
Tucson sales in the United States have climbed steeply over the past decade. After a quiet early stretch, annual volume grew from about 63,600 units in 2015 to 153,792 in 2018, then rose further with the fourth-generation redesign: 175,307 in 2022, 209,624 in 2023, and 206,126 in 2024. In 2025 the Tucson set a record at 234,230, up roughly 14 percent year over year. The third quarter of 2026 brought 64,075 sales, up 23.4 percent on the 51,929 of the third quarter of 2025 and up 3.0 percent on the 62,186 of the second quarter of 2026. October fell to 17,808, down 22.7 percent from the 23,036 of October 2025. Even so, January to October 2026 reached 199,495, up 6.0 percent on the 188,275 of the same months of 2025 and the best January to October on this chart.
Hyundai Tucson, United States calendar-year unit sales, 2005–2026. 2026 is January–Oct (partial).
Annual sales
| Year | Units | YoY |
|---|---|---|
| 2005 | 61,048 | — |
| 2006 | 52,067 | ▼ 14.7% |
| 2007 | 41,476 | ▼ 20.3% |
| 2008 | 19,027 | ▼ 54.1% |
| 2009 | 15,411 | ▼ 19.0% |
| 2010 | 39,594 | ▲ 156.9% |
| 2011 | 47,232 | ▲ 19.3% |
| 2012 | 48,878 | ▲ 3.5% |
| 2013 | 41,906 | ▼ 14.3% |
| 2014 | 47,306 | ▲ 12.9% |
| 2015 | 63,591 | ▲ 34.4% |
| 2016 | 89,713 | ▲ 41.1% |
| 2017 | 114,735 | ▲ 27.9% |
| 2018 | 153,792 | ▲ 34.0% |
| 2019 | 137,381 | ▼ 10.7% |
| 2020 | 123,657 | ▼ 10.0% |
| 2021 | 150,949 | ▲ 22.1% |
| 2022 | 175,307 | ▲ 16.1% |
| 2023 | 209,624 | ▲ 19.6% |
| 2024 | 206,126 | ▼ 1.7% |
| 2025 | 234,230 | ▲ 13.6% |
| 2026 (Jan–Oct) | 199,495 | ▲ 6.0% YTD |
Monthly sales
| Year | Jan | Feb | Mar | Apr | May | Jun | Jul | Aug | Sep | Oct | Nov | Dec | Total |
|---|---|---|---|---|---|---|---|---|---|---|---|---|---|
| 2005 | 3,420 | 4,033 | 4,604 | 5,195 | 5,732 | 5,975 | 5,894 | 6,422 | 5,245 | 5,086 | 4,523 | 4,919 | 61,048 |
| 2006 | 3,620 | 4,145 | 4,427 | 4,657 | 4,279 | 5,474 | 5,095 | 4,368 | 4,223 | 4,322 | 3,788 | 3,669 | 52,067 |
| 2007 | 2,769 | 2,943 | 3,982 | 3,563 | 3,454 | 3,639 | 3,452 | 4,954 | 3,693 | 2,958 | 3,107 | 2,962 | 41,476 |
| 2008 | 1,373 | 2,213 | 2,427 | 1,721 | 2,049 | 1,964 | 1,521 | 1,685 | 1,294 | 988 | 918 | 874 | 19,027 |
| 2009 | 974 | 1,358 | 1,346 | 1,428 | 1,346 | 1,100 | 1,106 | 2,531 | 1,583 | 848 | 888 | 903 | 15,411 |
| 2010 | 2,216 | 2,741 | 3,084 | 3,871 | 4,395 | 3,382 | 3,698 | 3,343 | 2,730 | 3,051 | 3,042 | 4,041 | 39,594 |
| 2011 | 2,863 | 3,342 | 4,508 | 4,055 | 4,363 | 4,406 | 3,479 | 4,156 | 3,724 | 3,777 | 4,101 | 4,458 | 47,232 |
| 2012 | 3,116 | 3,736 | 4,197 | 3,909 | 4,644 | 4,231 | 4,062 | 5,376 | 4,573 | 3,451 | 3,838 | 3,745 | 48,878 |
| 2013 | 3,493 | 3,444 | 4,073 | 3,733 | 3,664 | 3,800 | 3,949 | 3,886 | 2,849 | 2,016 | 3,285 | 3,714 | 41,906 |
| 2014 | 3,533 | 3,956 | 4,627 | 3,962 | 4,482 | 3,776 | 3,767 | 5,266 | 3,589 | 3,592 | 3,642 | 3,114 | 47,306 |
| 2015 | 3,036 | 3,869 | 4,222 | 4,020 | 3,881 | 3,606 | 3,908 | 6,609 | 7,925 | 7,298 | 6,906 | 8,311 | 63,591 |
| 2016 | 5,218 | 7,336 | 7,830 | 7,718 | 7,369 | 7,193 | 7,728 | 7,608 | 7,333 | 8,088 | 7,616 | 8,676 | 89,713 |
| 2017 | 5,748 | 6,422 | 8,985 | 9,952 | 10,600 | 10,000 | 11,257 | 9,757 | 10,118 | 8,731 | 11,532 | 11,633 | 114,735 |
| 2018 | 7,638 | 8,438 | 11,806 | 12,903 | 12,991 | 16,173 | 11,360 | 11,559 | 10,646 | 22,986 | 11,908 | 15,384 | 153,792 |
| 2019 | 7,444 | 9,411 | 11,976 | 8,682 | 15,616 | 12,825 | 12,629 | 13,985 | 10,293 | 11,288 | 12,008 | 11,224 | 137,381 |
| 2020 | 8,068 | 9,594 | 6,073 | 8,438 | 15,552 | 10,216 | 10,922 | 11,632 | 10,644 | 10,898 | 9,739 | 11,881 | 123,657 |
| 2021 | 7,980 | 9,423 | 15,744 | 16,901 | 18,848 | 14,621 | 11,483 | 11,151 | 9,896 | 9,735 | 11,325 | 13,842 | 150,949 |
| 2022 | 13,085 | 12,928 | 13,642 | 14,616 | 14,152 | 15,648 | 14,278 | 14,305 | 12,971 | 15,066 | 16,059 | 18,557 | 175,307 |
| 2023 | 12,028 | 14,031 | 20,111 | 18,676 | 18,038 | 17,707 | 17,534 | 16,242 | 18,813 | 15,638 | 21,382 | 19,424 | 209,624 |
| 2024 | 11,116 | 15,999 | 18,394 | 15,685 | 17,371 | 13,581 | 16,135 | 20,864 | 16,802 | 19,829 | 20,178 | 20,172 | 206,126 |
| 2025 | 15,025 | 16,317 | 23,631 | 22,054 | 19,905 | 16,378 | 16,406 | 17,954 | 17,569 | 23,036 | 23,762 | 22,193 | 234,230 |
| 2026 | 14,428 | 17,277 | 23,721 | 22,024 | 20,581 | 19,581 | 19,714 | 21,197 | 23,164 | 17,808 | — | — | 199,495 |
Hyundai Tucson Sales in Canada
Canadian Tucson sales have followed a similar upward path. Volume built from 16,362 units in 2015 to 30,467 in 2017 and 30,075 in 2019, dipped to 21,884 in 2022, reached 29,837 in 2024, then jumped to a record 41,840 in 2025, a gain of about 40 percent. The third quarter of 2026 brought 12,101 sales, up 4.3 percent on the 11,597 of the third quarter of 2025, though down 8.4 percent from the 13,216 of the second quarter of 2026. March 2026 set a monthly record at 4,830. That leaves January to September 2026 at 37,481, up 23.5 percent on the 30,342 of the same months of 2025 and the best January to September on this chart.
Hyundai Tucson, Canada calendar-year unit sales, 2004–2026. 2026 is January–Sep (partial).
Annual sales
| Year | Units | YoY |
|---|---|---|
| 2004 | 1,173 | — |
| 2005 | 11,533 | ▲ 883.2% |
| 2006 | 12,586 | ▲ 9.1% |
| 2007 | 12,008 | ▼ 4.6% |
| 2008 | 8,711 | ▼ 27.5% |
| 2009 | 7,278 | ▼ 16.5% |
| 2010 | 12,923 | ▲ 77.6% |
| 2011 | 14,309 | ▲ 10.7% |
| 2012 | 13,969 | ▼ 2.4% |
| 2013 | 11,685 | ▼ 16.4% |
| 2014 | 11,856 | ▲ 1.5% |
| 2015 | 16,362 | ▲ 38.0% |
| 2016 | 23,789 | ▲ 45.4% |
| 2017 | 30,467 | ▲ 28.1% |
| 2018 | 28,634 | ▼ 6.0% |
| 2019 | 30,075 | ▲ 5.0% |
| 2020 | 23,578 | ▼ 21.6% |
| 2021 | 25,487 | ▲ 8.1% |
| 2022 | 21,884 | ▼ 14.1% |
| 2023 | 26,110 | ▲ 19.3% |
| 2024 | 29,837 | ▲ 14.3% |
| 2025 | 41,840 | ▲ 40.2% |
| 2026 (Jan–Sep) | 37,481 | ▲ 23.5% YTD |
Monthly sales
| Year | Jan | Feb | Mar | Apr | May | Jun | Jul | Aug | Sep | Oct | Nov | Dec | Total |
|---|---|---|---|---|---|---|---|---|---|---|---|---|---|
| 2004 | 0 | 0 | 0 | 0 | 0 | 0 | 0 | 0 | 0 | 144 | 448 | 581 | 1,173 |
| 2005 | 673 | 928 | 993 | 1,071 | 1,068 | 1,043 | 980 | 1,334 | 968 | 927 | 660 | 888 | 11,533 |
| 2006 | 643 | 857 | 1,191 | 1,013 | 903 | 1,027 | 1,139 | 1,854 | 1,207 | 814 | 941 | 997 | 12,586 |
| 2007 | 641 | 694 | 818 | 1,194 | 1,364 | 1,241 | 1,395 | 1,354 | 1,178 | 741 | 705 | 683 | 12,008 |
| 2008 | 770 | 618 | 918 | 982 | 862 | 636 | 714 | 766 | 785 | 633 | 581 | 446 | 8,711 |
| 2009 | 332 | 410 | 584 | 663 | 735 | 606 | 727 | 696 | 659 | 790 | 680 | 396 | 7,278 |
| 2010 | 840 | 1,145 | 1,330 | 1,117 | 1,283 | 1,539 | 1,250 | 1,003 | 662 | 793 | 946 | 1,015 | 12,923 |
| 2011 | 1,080 | 955 | 1,224 | 1,755 | 1,684 | 1,809 | 1,131 | 808 | 1,105 | 962 | 1,033 | 763 | 14,309 |
| 2012 | 899 | 1,036 | 1,115 | 1,372 | 1,361 | 1,419 | 1,940 | 1,352 | 837 | 1,137 | 904 | 597 | 13,969 |
| 2013 | 707 | 622 | 880 | 1,168 | 1,725 | 1,343 | 1,103 | 898 | 653 | 619 | 933 | 1,034 | 11,685 |
| 2014 | 823 | 795 | 1,032 | 1,606 | 1,394 | 963 | 913 | 1,002 | 1,128 | 919 | 766 | 515 | 11,856 |
| 2015 | 638 | 1,279 | 1,548 | 1,774 | 1,385 | 976 | 999 | 2,205 | 1,543 | 1,663 | 1,539 | 813 | 16,362 |
| 2016 | 1,142 | 1,397 | 1,792 | 2,403 | 2,521 | 4,044 | 2,618 | 1,645 | 1,830 | 1,635 | 1,756 | 1,006 | 23,789 |
| 2017 | 1,531 | 1,532 | 2,589 | 3,964 | 2,774 | 2,815 | 3,087 | 2,747 | 3,206 | 2,777 | 2,115 | 1,330 | 30,467 |
| 2018 | 1,393 | 1,447 | 1,875 | 2,427 | 2,855 | 2,888 | 3,536 | 2,805 | 2,776 | 3,004 | 2,350 | 1,278 | 28,634 |
| 2019 | 1,723 | 1,566 | 1,646 | 3,015 | 3,015 | 2,743 | 3,204 | 3,204 | 2,914 | 2,531 | 2,201 | 2,313 | 30,075 |
| 2020 | 1,465 | 1,332 | 1,467 | 1,643 | 1,493 | 1,644 | 2,626 | 2,507 | 2,509 | 2,369 | 2,153 | 2,370 | 23,578 |
| 2021 | 1,533 | 1,533 | 1,766 | 2,965 | 2,696 | 2,967 | 2,476 | 2,593 | 2,477 | 1,470 | 1,470 | 1,541 | 25,487 |
| 2022 | 1,459 | 1,390 | 1,600 | 1,995 | 1,995 | 2,090 | 1,754 | 2,017 | 1,843 | 1,913 | 1,913 | 1,915 | 21,884 |
| 2023 | 1,995 | 1,814 | 2,088 | 2,208 | 2,429 | 2,430 | 2,440 | 2,806 | 2,442 | 1,905 | 1,819 | 1,734 | 26,110 |
| 2024 | 2,144 | 2,047 | 2,048 | 3,170 | 3,170 | 2,882 | 2,347 | 2,347 | 2,135 | 2,712 | 2,358 | 2,477 | 29,837 |
| 2025 | 2,875 | 2,613 | 2,746 | 3,613 | 3,448 | 3,450 | 3,986 | 3,805 | 3,806 | 4,132 | 3,413 | 3,953 | 41,840 |
| 2026 | 3,311 | 4,023 | 4,830 | 4,340 | 4,489 | 4,387 | 4,017 | 4,265 | 3,819 | — | — | — | 37,481 |