
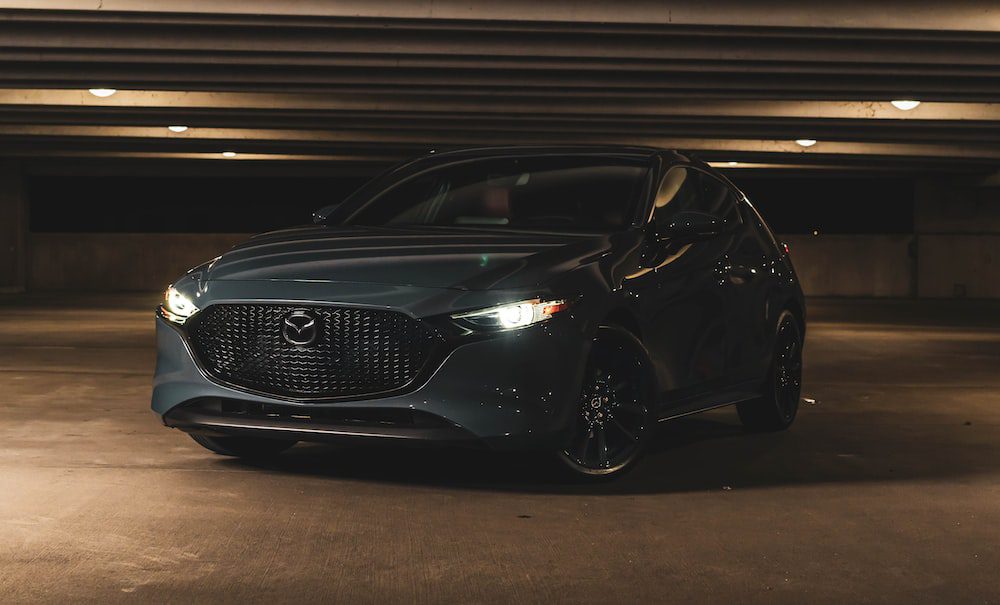
Mazda 3
Here you will find monthly and yearly United States and Canadian sales figures for the Mazda 3, the compact car Mazda styles as the Mazda3. It arrived for the 2004 model year as the replacement for the Protege and has been one of the brand’s two core nameplates ever since, sold as a four-door sedan and a five-door hatchback. The current fourth-generation car went on sale for 2019 and competes with the Toyota Corolla, Honda Civic, Hyundai Elantra, Kia K4, Volkswagen Jetta and Subaru Impreza.
- Class: Compact car, sold as a sedan and a five-door hatchback
- Current engines: 2.5L naturally aspirated four-cylinder rated up to 186 hp and 186 lb-ft, and a 2.5L turbocharged four-cylinder rated up to 250 hp and 320 lb-ft on premium fuel, or 227 hp on regular
- Transmission: Skyactiv-Drive six-speed automatic with manual-shift and Sport modes
- Drivetrain: Front-wheel drive, with i-Activ all-wheel drive standard on the Carbon Edition and Turbo Premium Plus
- Trims: 2.5 S, 2.5 S Select Sport, 2.5 S Preferred, 2.5 S Carbon Edition and 2.5 Turbo Premium Plus
- Chief rivals: Toyota Corolla, Honda Civic, Hyundai Elantra, Kia K4, Volkswagen Jetta, Subaru Impreza
Specifications above are drawn from Mazda’s official 2026 Mazda3 sedan product page.
Mazda 3 Sales in the United States
The Mazda 3 was a six-figure seller in the United States for most of its first decade. Volume opened at 97,388 in 2005, climbed to 120,291 in 2007 and peaked at 134,636 in 2012, the high point of this chart. The slide that followed tracked the compact segment as a whole: sales fell below 100,000 in 2016, below 51,000 in 2019 and bottomed at 27,767 in 2022, the weakest full year in the dataset. A partial recovery took the nameplate to 30,531 in 2023 and 38,877 in 2024 before 2025 gave back most of that ground at 29,266 units, down roughly 25 percent year over year. The 2026 picture is very different. Through June, Mazda had delivered 20,452 Mazda 3s, against 16,946 over the same six months of 2025, a gain of about 21 percent, and the 4,121 units registered in May 2026 were the strongest single month for the nameplate since May 2021.
Mazda3, United States calendar-year unit sales, 2005–2026. 2026 is January–Aug (partial).
Annual sales
| Year | Units | YoY |
|---|---|---|
| 2005 | 97,388 | — |
| 2006 | 94,437 | ▼ 3.0% |
| 2007 | 120,291 | ▲ 27.4% |
| 2008 | 109,957 | ▼ 8.6% |
| 2009 | 96,376 | ▼ 12.4% |
| 2010 | 106,353 | ▲ 10.4% |
| 2011 | 102,417 | ▼ 3.7% |
| 2012 | 134,636 | ▲ 31.5% |
| 2013 | 104,713 | ▼ 22.2% |
| 2014 | 104,985 | ▲ 0.3% |
| 2015 | 107,885 | ▲ 2.8% |
| 2016 | 95,567 | ▼ 11.4% |
| 2017 | 75,018 | ▼ 21.5% |
| 2018 | 64,638 | ▼ 13.8% |
| 2019 | 50,741 | ▼ 21.5% |
| 2020 | 30,352 | ▼ 40.2% |
| 2021 | 41,845 | ▲ 37.9% |
| 2022 | 27,767 | ▼ 33.6% |
| 2023 | 30,531 | ▲ 10.0% |
| 2024 | 38,877 | ▲ 27.3% |
| 2025 | 29,266 | ▼ 24.7% |
| 2026 (Jan–Aug) | 28,782 | ▲ 34.9% YTD |
Monthly sales
| Year | Jan | Feb | Mar | Apr | May | Jun | Jul | Aug | Sep | Oct | Nov | Dec | Total |
|---|---|---|---|---|---|---|---|---|---|---|---|---|---|
| 2005 | 5,258 | 7,015 | 9,455 | 9,994 | 12,086 | 7,966 | 7,814 | 7,547 | 8,435 | 8,241 | 6,691 | 6,886 | 97,388 |
| 2006 | 6,109 | 7,536 | 8,087 | 9,059 | 11,662 | 9,452 | 9,096 | 6,955 | 6,725 | 5,987 | 6,673 | 7,096 | 94,437 |
| 2007 | 7,653 | 8,667 | 15,606 | 8,046 | 11,316 | 11,341 | 11,567 | 10,511 | 10,629 | 8,157 | 7,461 | 9,337 | 120,291 |
| 2008 | 6,579 | 7,893 | 12,635 | 9,234 | 12,788 | 12,346 | 11,782 | 10,970 | 6,029 | 6,095 | 5,742 | 7,864 | 109,957 |
| 2009 | 7,649 | 6,347 | 9,784 | 7,303 | 7,500 | 6,633 | 9,771 | 14,619 | 6,227 | 6,729 | 5,923 | 7,891 | 96,376 |
| 2010 | 7,368 | 8,215 | 11,353 | 9,320 | 11,537 | 8,555 | 9,705 | 9,063 | 7,995 | 7,745 | 6,474 | 9,023 | 106,353 |
| 2011 | 5,015 | 8,077 | 12,467 | 8,584 | 8,789 | 8,612 | 9,288 | 9,424 | 8,929 | 7,095 | 6,873 | 9,264 | 102,417 |
| 2012 | 9,200 | 22,550 | 13,235 | 8,508 | 8,474 | 8,835 | 9,027 | 11,120 | 14,031 | 9,518 | 9,841 | 10,297 | 134,636 |
| 2013 | 8,074 | 10,554 | 10,505 | 7,067 | 8,935 | 7,566 | 9,236 | 11,031 | 8,646 | 7,674 | 7,756 | 7,669 | 104,713 |
| 2014 | 6,234 | 7,286 | 10,536 | 8,586 | 10,682 | 8,824 | 9,381 | 10,871 | 7,859 | 7,246 | 7,761 | 9,719 | 104,985 |
| 2015 | 7,896 | 8,874 | 10,534 | 8,006 | 10,317 | 9,251 | 9,504 | 10,161 | 7,757 | 8,342 | 7,405 | 9,838 | 107,885 |
| 2016 | 7,551 | 7,275 | 7,307 | 10,722 | 10,127 | 8,399 | 8,103 | 7,297 | 7,350 | 6,946 | 6,388 | 8,102 | 95,567 |
| 2017 | 6,623 | 6,846 | 7,137 | 5,980 | 6,775 | 6,473 | 7,407 | 6,754 | 6,112 | 4,534 | 4,708 | 5,669 | 75,018 |
| 2018 | 5,825 | 6,070 | 7,760 | 4,725 | 5,983 | 5,433 | 5,266 | 5,597 | 4,635 | 4,093 | 3,974 | 5,277 | 64,638 |
| 2019 | 4,596 | 4,610 | 6,009 | 4,351 | 4,967 | 3,990 | 3,651 | 4,825 | 3,507 | 3,481 | 3,579 | 3,175 | 50,741 |
| 2020 | 2,496 | 3,759 | 1,863 | 1,492 | 3,368 | 3,250 | 3,231 | 3,175 | 2,535 | 2,570 | 2,613 | — | 30,352 |
| 2021 | 3,046 | 7,275 | 3,863 | 3,794 | 4,525 | 3,323 | 3,927 | 2,463 | 2,595 | 2,514 | 2,501 | 2,019 | 41,845 |
| 2022 | 3,470 | 2,969 | 3,053 | 3,594 | 904 | 865 | 1,165 | 2,100 | 1,860 | 2,778 | 3,023 | 1,986 | 27,767 |
| 2023 | 1,577 | 2,846 | 2,872 | 2,619 | 2,468 | 2,745 | 2,994 | 2,611 | 2,632 | 2,205 | 2,504 | 2,458 | 30,531 |
| 2024 | 2,880 | 3,063 | 4,019 | 2,537 | 2,658 | 2,670 | 3,959 | 3,661 | 2,621 | 3,490 | 3,272 | 4,047 | 38,877 |
| 2025 | 2,983 | 2,838 | 3,530 | 3,236 | 2,453 | 1,906 | 2,082 | 2,309 | 1,500 | 1,440 | 2,255 | 2,734 | 29,266 |
| 2026 | 2,473 | 3,129 | 3,707 | 3,235 | 4,121 | 3,787 | 3,903 | 4,427 | — | — | — | — | 28,782 |
Mazda 3 Sales in Canada
Canada took to the Mazda 3 even more enthusiastically in relative terms, and the nameplate spent years as one of the country’s best-selling cars. Sales ran between 42,000 and 51,000 units every year from 2004 through 2010, peaking at 50,713 in 2005, then eased steadily through the 2010s as buyers moved into crossovers. The low point came in 2022 at 8,044 units. Canada has since gone the other way from the United States: volume recovered to 10,880 in 2023, held at 10,263 in 2024 and jumped to 14,042 in 2025, a gain of about 37 percent and the best Canadian result since 2019. Through June 2026 Mazda Canada had sold 5,057 Mazda 3s against 6,125 a year earlier, running about 17 percent behind that pace.
Mazda3, Canada calendar-year unit sales, 2004–2026. 2026 is January–Aug (partial).
Annual sales
| Year | Units | YoY |
|---|---|---|
| 2004 | 42,680 | — |
| 2005 | 50,713 | ▲ 18.8% |
| 2006 | 47,933 | ▼ 5.5% |
| 2007 | 48,236 | ▲ 0.6% |
| 2008 | 50,317 | ▲ 4.3% |
| 2009 | 46,943 | ▼ 6.7% |
| 2010 | 47,740 | ▲ 1.7% |
| 2011 | 37,224 | ▼ 22.0% |
| 2012 | 39,295 | ▲ 5.6% |
| 2013 | 40,466 | ▲ 3.0% |
| 2014 | 40,974 | ▲ 1.3% |
| 2015 | 34,811 | ▼ 15.0% |
| 2016 | 27,689 | ▼ 20.5% |
| 2017 | 27,862 | ▲ 0.6% |
| 2018 | 26,728 | ▼ 4.1% |
| 2019 | 21,276 | ▼ 20.4% |
| 2020 | 12,769 | ▼ 40.0% |
| 2021 | 11,804 | ▼ 7.6% |
| 2022 | 8,044 | ▼ 31.9% |
| 2023 | 10,880 | ▲ 35.3% |
| 2024 | 10,263 | ▼ 5.7% |
| 2025 | 14,042 | ▲ 36.8% |
| 2026 (Jan–Aug) | 8,013 | ▼ 17.1% YTD |
Monthly sales
| Year | Jan | Feb | Mar | Apr | May | Jun | Jul | Aug | Sep | Oct | Nov | Dec | Total |
|---|---|---|---|---|---|---|---|---|---|---|---|---|---|
| 2004 | 2,510 | 2,876 | 4,527 | 5,531 | 5,040 | 4,325 | 3,924 | 3,693 | 2,740 | 2,877 | 2,429 | 2,208 | 42,680 |
| 2005 | 1,682 | 2,616 | 3,359 | 7,120 | 6,398 | 6,644 | 5,808 | 4,695 | 4,273 | 3,211 | 2,764 | 2,143 | 50,713 |
| 2006 | 1,819 | 2,626 | 3,896 | 4,721 | 4,835 | 5,495 | 5,212 | 5,817 | 4,401 | 3,466 | 2,927 | 2,718 | 47,933 |
| 2007 | 2,574 | 2,980 | 4,273 | 5,593 | 5,985 | 5,305 | 4,724 | 5,219 | 4,069 | 2,976 | 2,207 | 2,331 | 48,236 |
| 2008 | 2,510 | 2,944 | 4,516 | 4,703 | 6,200 | 5,485 | 5,447 | 5,035 | 4,503 | 3,284 | 2,904 | 2,786 | 50,317 |
| 2009 | 2,643 | 2,932 | 4,116 | 5,235 | 4,894 | 4,276 | 3,955 | 4,475 | 4,268 | 3,657 | 3,616 | 2,876 | 46,943 |
| 2010 | 2,938 | 3,346 | 5,478 | 5,436 | 4,274 | 4,911 | 4,651 | 4,713 | 3,756 | 2,925 | 2,654 | 2,658 | 47,740 |
| 2011 | 1,689 | 1,825 | 2,856 | 4,350 | 3,541 | 4,185 | 3,623 | 3,606 | 3,106 | 2,826 | 2,869 | 2,748 | 37,224 |
| 2012 | 1,912 | 2,255 | 3,886 | 3,841 | 4,240 | 4,089 | 3,666 | 4,213 | 4,278 | 2,508 | 2,752 | 1,655 | 39,295 |
| 2013 | 1,658 | 2,345 | 4,848 | 3,281 | 4,002 | 3,213 | 3,630 | 3,916 | 3,310 | 3,821 | 3,679 | 2,763 | 40,466 |
| 2014 | 2,287 | 2,336 | 3,663 | 4,239 | 4,603 | 3,703 | 4,133 | 4,203 | 3,849 | 3,170 | 2,632 | 2,156 | 40,974 |
| 2015 | 1,688 | 1,989 | 3,700 | 4,233 | 3,381 | 3,522 | 3,147 | 3,102 | 2,864 | 2,788 | 2,319 | 2,078 | 34,811 |
| 2016 | 1,281 | 1,450 | 2,457 | 3,275 | 2,861 | 2,832 | 2,356 | 2,492 | 2,251 | 2,333 | 2,279 | 1,822 | 27,689 |
| 2017 | 1,439 | 1,555 | 2,996 | 2,395 | 2,813 | 2,924 | 2,819 | 2,792 | 2,388 | 2,128 | 2,022 | 1,591 | 27,862 |
| 2018 | 1,389 | 1,510 | 2,411 | 2,447 | 2,874 | 2,763 | 2,801 | 2,702 | 2,267 | 2,214 | 1,913 | 1,437 | 26,728 |
| 2019 | 1,731 | 1,574 | 1,654 | 2,264 | 2,264 | 2,059 | 1,941 | 1,941 | 1,767 | 1,466 | 1,275 | 1,340 | 21,276 |
| 2020 | 923 | 839 | 924 | 894 | 812 | 895 | 1,542 | 1,472 | 1,474 | 1,029 | 935 | 1,030 | 12,769 |
| 2021 | 843 | 843 | 971 | 1,221 | 1,110 | 1,221 | 1,060 | 1,111 | 1,062 | 775 | 775 | 812 | 11,804 |
| 2022 | 1,008 | 960 | 1,104 | 622 | 622 | 654 | 463 | 533 | 488 | 530 | 530 | 530 | 8,044 |
| 2023 | 853 | 775 | 893 | 824 | 906 | 908 | 820 | 944 | 822 | 1,094 | 1,045 | 996 | 10,880 |
| 2024 | 728 | 694 | 696 | 1,029 | 1,029 | 937 | 922 | 922 | 840 | 886 | 770 | 810 | 10,263 |
| 2025 | 852 | 775 | 815 | 1,266 | 1,208 | 1,209 | 1,810 | 1,728 | 1,730 | 951 | 786 | 912 | 14,042 |
| 2026 | 678 | 598 | 754 | 780 | 1,018 | 1,229 | 1,559 | 1,397 | — | — | — | — | 8,013 |







