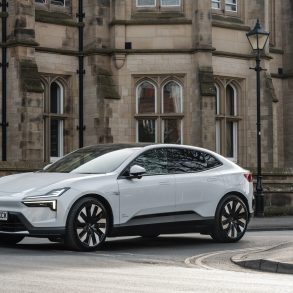
Dodge Charger
Here you will find monthly and yearly U.S. and Canadian sales figures for the Dodge Charger, from the four-door’s May 2005 arrival through today’s two- and four-door generation. Both charts peak in 2007.
- Class: Large car
- Powertrains: 3.0-liter SIXPACK twin-turbo inline-six with 420 horsepower and 468 lb-ft of torque in the R/T, or 550 horsepower and 531 lb-ft in the Scat Pack; all-electric Daytona Scat Pack with dual motors, 670 horsepower and 627 lb-ft
- Transmission: Eight-speed automatic on SIXPACK models
- Drivetrain: Standard all-wheel drive, with a selectable rear-drive mode on SIXPACK models
- Trims: R/T, R/T Plus, Scat Pack, Scat Pack Plus, Daytona Scat Pack and Daytona Scat Pack Plus, each with two or four doors
- EPA range: 231 to 267 miles for the 2027 Daytona Scat Pack, depending on tires
- Chief rivals: Ford Mustang today; historically the Chevrolet Impala and Ford Taurus
Dodge Charger Sales in the United States
The modern Charger arrived in May 2005 with 1,841 sold, for 44,804 in that partial year. The best year was 2007 at 119,289, with a monthly high of 13,463 that May. Sales fell 18.4 percent to 97,367 in 2008 and 37.7 percent to 60,651 in 2009, the lowest full year before the final run-out. The car recovered to 98,336 in 2013 and still reached 96,936 in 2019, then held between 75,919 and 80,365 a year from 2020 through 2023. The old model then wound down, to 34,756 in 2024 and 2,141 in 2025. The chart has climbed again to 8,029 through September 2026, up from 1,868 in the same months of 2025. Battery-electric Charger Daytona sales sit in a separate series in our database, 7,421 in 2025 and 767 through September 2026, and are not included in this chart.
Dodge Charger, United States calendar-year unit sales, 2005–2026. 2026 is January–Sep (partial).
Annual sales
| Year | Units | YoY |
|---|---|---|
| 2005 | 44,804 | — |
| 2006 | 114,201 | ▲ 154.9% |
| 2007 | 119,289 | ▲ 4.5% |
| 2008 | 97,367 | ▼ 18.4% |
| 2009 | 60,651 | ▼ 37.7% |
| 2010 | 75,397 | ▲ 24.3% |
| 2011 | 70,089 | ▼ 7.0% |
| 2012 | 82,592 | ▲ 17.8% |
| 2013 | 98,336 | ▲ 19.1% |
| 2014 | 94,099 | ▼ 4.3% |
| 2015 | 94,725 | ▲ 0.7% |
| 2016 | 97,110 | ▲ 2.5% |
| 2017 | 88,351 | ▼ 9.0% |
| 2018 | 80,226 | ▼ 9.2% |
| 2019 | 96,936 | ▲ 20.8% |
| 2020 | 77,426 | ▼ 20.1% |
| 2021 | 78,388 | ▲ 1.2% |
| 2022 | 80,365 | ▲ 2.5% |
| 2023 | 75,919 | ▼ 5.5% |
| 2024 | 34,756 | ▼ 54.2% |
| 2025 | 2,141 | ▼ 93.8% |
| 2026 (Jan–Sep) | 8,029 | ▲ 329.8% YTD |
Monthly sales
| Year | Jan | Feb | Mar | Apr | May | Jun | Jul | Aug | Sep | Oct | Nov | Dec | Total |
|---|---|---|---|---|---|---|---|---|---|---|---|---|---|
| 2005 | — | — | — | — | 1,841 | 4,354 | 5,495 | 5,222 | 6,809 | 7,119 | 6,827 | 7,137 | 44,804 |
| 2006 | 8,023 | 11,862 | 9,023 | 9,662 | 10,725 | 9,710 | 8,074 | 10,461 | 10,228 | 8,619 | 7,247 | 10,567 | 114,201 |
| 2007 | 7,440 | 10,776 | 12,707 | 10,057 | 13,463 | 11,529 | 6,407 | 7,846 | 9,265 | 8,343 | 10,341 | 11,115 | 119,289 |
| 2008 | 7,972 | 9,750 | 9,296 | 13,021 | 10,134 | 8,352 | 5,475 | 8,102 | 8,118 | 6,255 | 5,478 | 5,414 | 97,367 |
| 2009 | 4,028 | 6,703 | 6,456 | 4,703 | 4,082 | 3,489 | 2,663 | 6,479 | 7,507 | 4,864 | 3,404 | 6,273 | 60,651 |
| 2010 | 2,125 | 10,363 | 6,220 | 8,944 | 9,625 | 8,508 | 6,023 | 6,586 | 8,812 | 4,023 | 1,963 | 2,205 | 75,397 |
| 2011 | 2,062 | 3,263 | 8,986 | 8,485 | 7,830 | 7,215 | 5,344 | 4,174 | 6,794 | 3,626 | 5,099 | 7,211 | 70,089 |
| 2012 | 5,537 | 7,324 | 9,644 | 7,991 | 6,735 | 8,532 | 6,440 | 5,419 | 5,863 | 4,924 | 6,316 | 7,867 | 82,592 |
| 2013 | 6,411 | 10,301 | 9,386 | 7,801 | 8,270 | 9,812 | 5,200 | 7,448 | 8,713 | 7,864 | 6,985 | 10,145 | 98,336 |
| 2014 | 5,200 | 8,940 | 10,816 | 8,090 | 8,277 | 8,444 | 5,539 | 8,211 | 8,624 | 6,967 | 6,569 | 8,422 | 94,099 |
| 2015 | 7,025 | 10,365 | 8,828 | 9,063 | 7,777 | 7,703 | 5,821 | 6,734 | 7,384 | 8,673 | 6,685 | 8,667 | 94,725 |
| 2016 | 9,164 | 8,765 | 9,817 | 8,213 | 8,142 | 6,223 | 4,949 | 8,614 | 10,056 | 6,792 | 9,138 | 7,237 | 97,110 |
| 2017 | 7,153 | 6,930 | 8,236 | 6,937 | 7,518 | 6,379 | 5,426 | 9,569 | 9,230 | 8,096 | 6,047 | 6,830 | 88,351 |
| 2018 | 5,193 | 7,568 | 8,504 | 6,632 | 6,869 | 6,640 | 5,743 | 5,280 | 6,879 | 6,316 | 7,309 | 7,293 | 80,226 |
| 2019 | 5,210 | 6,547 | 8,858 | 6,101 | 9,296 | 9,034 | 8,572 | 9,601 | 7,887 | 8,505 | 8,820 | 8,505 | 96,936 |
| 2020 | 6,050 | 7,833 | 4,745 | 2,062 | 4,582 | 4,812 | 8,257 | 7,339 | 7,951 | 8,027 | 6,594 | 9,174 | 77,426 |
| 2021 | 6,317 | 6,317 | 7,106 | 7,551 | 7,261 | 7,551 | 6,546 | 6,303 | 6,546 | 5,630 | 5,630 | 5,630 | 78,388 |
| 2022 | 4,940 | 4,940 | 5,558 | 7,868 | 7,868 | 7,576 | 7,965 | 8,271 | 7,965 | 5,805 | 5,572 | 6,037 | 80,365 |
| 2023 | 7,279 | 6,988 | 7,861 | 8,308 | 7,988 | 8,308 | 5,421 | 5,855 | 5,638 | 4,037 | 4,037 | 4,199 | 75,919 |
| 2024 | 3,507 | 3,507 | 3,647 | 5,265 | 5,476 | 5,476 | 1,679 | 1,880 | 1,545 | 818 | 960 | 996 | 34,756 |
| 2025 | 351 | 337 | 364 | 195 | 203 | 180 | 82 | 71 | 85 | 85 | 87 | 101 | 2,141 |
| 2026 | 572 | 528 | 572 | 983 | 945 | 983 | 1,014 | 1,197 | 1,235 | — | — | — | 8,029 |
Dodge Charger Sales in Canada
Canadian sales also start in May 2005, with 2,919 that year. The best year was 2007 at 7,858, with 1,301 in April and 1,316 in May. From 2009 through 2018 the Charger held between 3,704 and 4,918 a year. It fell to 1,659 in 2020, recovered to 3,591 in 2023, then dropped to 893 in 2024 and 753 in 2025. Through September 2026 the count is 996, up from 639 in the same months of 2025.
Dodge Charger, Canada calendar-year unit sales, 2005–2026. 2026 is January–Sep (partial).
Annual sales
| Year | Units | YoY |
|---|---|---|
| 2005 | 2,919 | — |
| 2006 | 7,440 | ▲ 154.9% |
| 2007 | 7,858 | ▲ 5.6% |
| 2008 | 6,675 | ▼ 15.1% |
| 2009 | 4,861 | ▼ 27.2% |
| 2010 | 4,662 | ▼ 4.1% |
| 2011 | 4,137 | ▼ 11.3% |
| 2012 | 4,058 | ▼ 1.9% |
| 2013 | 4,588 | ▲ 13.1% |
| 2014 | 3,704 | ▼ 19.3% |
| 2015 | 4,505 | ▲ 21.6% |
| 2016 | 3,738 | ▼ 17.0% |
| 2017 | 4,862 | ▲ 30.1% |
| 2018 | 4,918 | ▲ 1.2% |
| 2019 | 3,425 | ▼ 30.4% |
| 2020 | 1,659 | ▼ 51.6% |
| 2021 | 1,924 | ▲ 16.0% |
| 2022 | 3,156 | ▲ 64.0% |
| 2023 | 3,591 | ▲ 13.8% |
| 2024 | 893 | ▼ 75.1% |
| 2025 | 753 | ▼ 15.7% |
| 2026 (Jan–Sep) | 996 | ▲ 55.9% YTD |
Monthly sales
| Year | Jan | Feb | Mar | Apr | May | Jun | Jul | Aug | Sep | Oct | Nov | Dec | Total |
|---|---|---|---|---|---|---|---|---|---|---|---|---|---|
| 2005 | 0 | 0 | 0 | 0 | 178 | 422 | 395 | 313 | 385 | 471 | 419 | 336 | 2,919 |
| 2006 | 457 | 387 | 521 | 555 | 514 | 471 | 722 | 911 | 847 | 768 | 525 | 762 | 7,440 |
| 2007 | 564 | 551 | 445 | 1,301 | 1,316 | 936 | 517 | 299 | 420 | 684 | 387 | 438 | 7,858 |
| 2008 | 452 | 455 | 630 | 800 | 1,358 | 1,087 | 209 | 279 | 370 | 325 | 407 | 303 | 6,675 |
| 2009 | 175 | 551 | 765 | 325 | 206 | 115 | 290 | 463 | 729 | 868 | 163 | 211 | 4,861 |
| 2010 | 208 | 447 | 609 | 703 | 588 | 447 | 560 | 302 | 302 | 129 | 156 | 211 | 4,662 |
| 2011 | 161 | 111 | 351 | 671 | 547 | 294 | 913 | 126 | 323 | 271 | 224 | 145 | 4,137 |
| 2012 | 670 | 416 | 436 | 309 | 429 | 337 | 286 | 219 | 361 | 136 | 132 | 327 | 4,058 |
| 2013 | 395 | 285 | 505 | 457 | 644 | 409 | 298 | 454 | 524 | 159 | 223 | 235 | 4,588 |
| 2014 | 248 | 495 | 1,020 | 231 | 363 | 225 | 115 | 116 | 340 | 221 | 172 | 158 | 3,704 |
| 2015 | 213 | 484 | 694 | 783 | 801 | 362 | 162 | 144 | 229 | 289 | 119 | 225 | 4,505 |
| 2016 | 202 | 229 | 671 | 627 | 385 | 296 | 334 | 120 | 159 | 186 | 317 | 212 | 3,738 |
| 2017 | 199 | 286 | 426 | 613 | 1,561 | 658 | 114 | 121 | 120 | 144 | 126 | 494 | 4,862 |
| 2018 | 56 | 612 | 610 | 799 | 798 | 567 | 88 | 202 | 626 | 351 | 146 | 63 | 4,918 |
| 2019 | 677 | 616 | 648 | 348 | 348 | 318 | 105 | 105 | 96 | 58 | 51 | 55 | 3,425 |
| 2020 | 171 | 155 | 173 | 45 | 41 | 46 | 66 | 63 | 63 | 287 | 261 | 288 | 1,659 |
| 2021 | 200 | 200 | 233 | 227 | 206 | 229 | 75 | 79 | 77 | 130 | 130 | 138 | 1,924 |
| 2022 | 384 | 366 | 422 | 383 | 383 | 402 | 130 | 149 | 137 | 133 | 133 | 134 | 3,156 |
| 2023 | 242 | 220 | 253 | 316 | 347 | 349 | 422 | 485 | 423 | 186 | 178 | 170 | 3,591 |
| 2024 | 116 | 111 | 113 | 83 | 83 | 76 | 41 | 41 | 40 | 67 | 59 | 63 | 893 |
| 2025 | 76 | 69 | 74 | 69 | 66 | 68 | 74 | 71 | 72 | 40 | 33 | 41 | 753 |
| 2026 | 74 | 67 | 73 | 90 | 102 | 69 | 174 | 151 | 196 | — | — | — | 996 |