
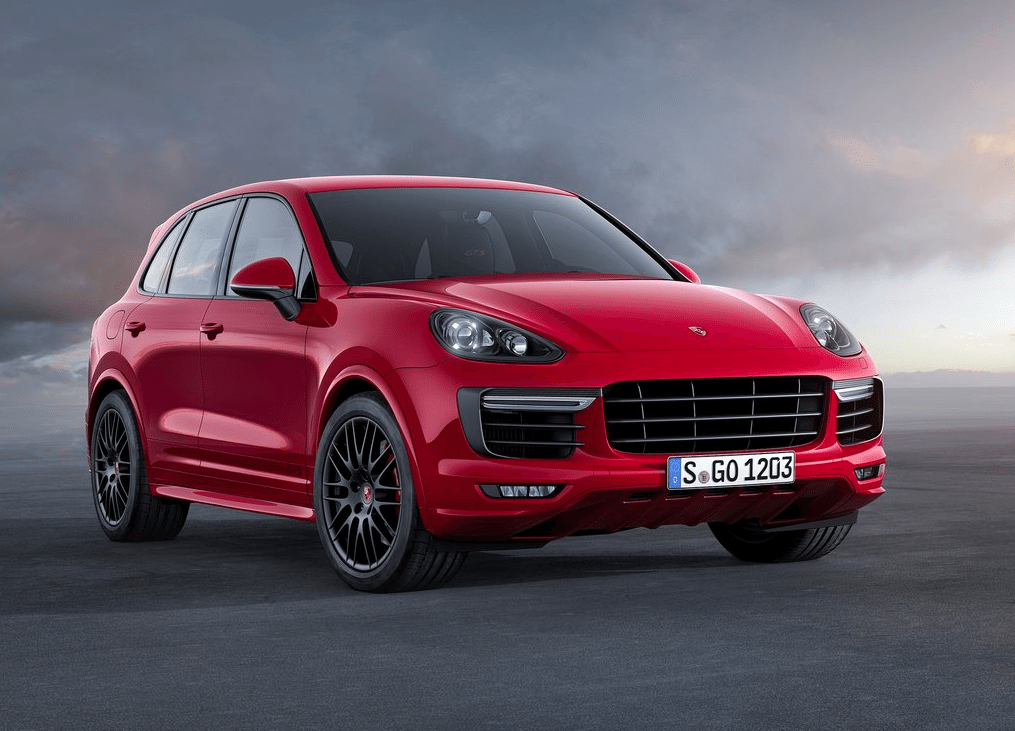
Porsche Cayenne
Here you will find monthly and yearly United States and Canadian sales figures for the Porsche Cayenne. The Cayenne is Porsche’s mid-size luxury SUV and the vehicle that reshaped the company’s business when it arrived for 2003. Built alongside the Volkswagen Touareg and Audi Q7 on shared architecture but tuned to Porsche’s own brief, it has spent two decades as one of the brand’s volume pillars and now spans gasoline, plug-in hybrid and fully electric variants. Its rivals include the BMW X5, Mercedes-Benz GLE, Audi Q7 and Range Rover Sport.
- Class: Mid-size luxury SUV, offered as an SUV and as a lower-roof Coupe
- Current engines: 348 hp turbocharged V6 in the base Cayenne, 468 hp twin-turbo V6 in the Cayenne S and 493 hp in the Cayenne GTS, plus plug-in hybrids rated at 463 hp (E-Hybrid), 512 hp (S E-Hybrid) and 729 hp (Turbo E-Hybrid)
- Electric models: Cayenne Electric at 435 hp, Cayenne S Electric at 657 hp and Cayenne Turbo Electric at 1,139 hp, all overboost figures
- Transmission: Automatic
- Drivetrain: All-wheel drive
- Pricing: Gasoline and hybrid models from $89,900, electric models from $109,000
- Chief rivals: BMW X5, Mercedes-Benz GLE, Audi Q7, Range Rover Sport, Maserati Levante
Porsche is running the combustion, plug-in hybrid and battery-electric Cayenne lines in parallel, with the electric SUV and Coupe joining the lineup for 2026 and deliveries expected from the end of summer 2026.
Porsche Cayenne Sales in the United States
Porsche Cayenne sales in the United States have followed the shape of the nameplate’s model cycles. The chart opens at 13,607 units in 2005, slides to a low of 7,735 in 2009 during the recession, then rebuilds through the 2010s to 18,507 in 2013 before the run-out of the second generation pulls the total down to 11,106 in 2018. The third-generation car resets the line immediately: 19,001 units in 2019, 21,048 in 2021 and a high of 21,194 in 2022, followed by 20,288 in 2023 and 20,808 in 2024. The 2025 figure of 17,729 is the softest year since 2018, but note that February 2025 is missing from the monthly record, so the true total is higher and the year-over-year drop is smaller than it looks. Through June 2026 Porsche had delivered 9,785 Cayennes in the United States, an average of about 1,630 a month and a steadier first half than 2025 produced.
Porsche Cayenne, United States calendar-year unit sales, 2005–2026. 2026 is January–Jun (partial).
Annual sales
| Year | Units | YoY |
|---|---|---|
| 2005 | 13,607 | — |
| 2006 | 10,569 | ▼ 22.3% |
| 2007 | 12,547 | ▲ 18.7% |
| 2008 | 11,216 | ▼ 10.6% |
| 2009 | 7,735 | ▼ 31.0% |
| 2010 | 7,793 | ▲ 0.7% |
| 2011 | 12,978 | ▲ 66.5% |
| 2012 | 15,545 | ▲ 19.8% |
| 2013 | 18,507 | ▲ 19.1% |
| 2014 | 16,205 | ▼ 12.4% |
| 2015 | 16,474 | ▲ 1.7% |
| 2016 | 15,383 | ▼ 6.6% |
| 2017 | 13,203 | ▼ 14.2% |
| 2018 | 11,106 | ▼ 15.9% |
| 2019 | 19,001 | ▲ 71.1% |
| 2020 | 18,092 | ▼ 4.8% |
| 2021 | 21,048 | ▲ 16.3% |
| 2022 | 21,194 | ▲ 0.7% |
| 2023 | 20,288 | ▼ 4.3% |
| 2024 | 20,808 | ▲ 2.6% |
| 2025 | 17,729 | ▼ 14.8% |
| 2026 (Jan–Jun) | 9,785 | ▲ 35.7% YTD |
Monthly sales
| Year | Jan | Feb | Mar | Apr | May | Jun | Jul | Aug | Sep | Oct | Nov | Dec | Total |
|---|---|---|---|---|---|---|---|---|---|---|---|---|---|
| 2005 | 1,071 | 990 | 1,032 | 1,071 | 1,268 | 1,143 | 1,160 | 1,071 | 997 | 1,104 | 1,275 | 1,425 | 13,607 |
| 2006 | 1,028 | 917 | 1,052 | 921 | 1,031 | 756 | 924 | 684 | 747 | 809 | 762 | 938 | 10,569 |
| 2007 | 1,404 | 360 | 877 | 993 | 1,119 | 1,187 | 1,149 | 830 | 958 | 1,184 | 1,232 | 1,254 | 12,547 |
| 2008 | 1,008 | 755 | 1,169 | 1,218 | 1,192 | 1,146 | 958 | 773 | 747 | 690 | 700 | 860 | 11,216 |
| 2009 | 947 | 444 | 924 | 886 | 863 | 275 | 541 | 509 | 535 | 472 | 632 | 707 | 7,735 |
| 2010 | 590 | 599 | 397 | 326 | 197 | 496 | 910 | 775 | 808 | 1,139 | 447 | 1,109 | 7,793 |
| 2011 | 1,047 | 936 | 1,049 | 1,578 | 1,258 | 1,009 | 1,342 | 882 | 930 | 1,032 | 1,085 | 830 | 12,978 |
| 2012 | 993 | 657 | 1,255 | 1,376 | 1,174 | 1,032 | 1,119 | 1,358 | 1,370 | 1,697 | 1,949 | 1,565 | 15,545 |
| 2013 | 1,500 | 1,173 | 1,508 | 1,750 | 1,765 | 1,823 | 1,563 | 1,435 | 1,396 | 1,669 | 1,546 | 1,379 | 18,507 |
| 2014 | 1,158 | 1,260 | 1,862 | 1,839 | 1,294 | 1,300 | 1,546 | 1,485 | 1,196 | 712 | 1,619 | 934 | 16,205 |
| 2015 | 1,116 | 1,046 | 1,364 | 1,773 | 1,392 | 1,312 | 1,471 | 1,470 | 1,323 | 1,454 | 1,523 | 1,230 | 16,474 |
| 2016 | 1,395 | 1,328 | 1,294 | 1,466 | 1,293 | 1,215 | 1,067 | 1,209 | 1,239 | 1,206 | 1,572 | 1,099 | 15,383 |
| 2017 | 1,350 | 1,156 | 1,134 | 1,257 | 1,153 | 1,010 | 873 | 869 | 912 | 1,202 | 1,347 | 940 | 13,203 |
| 2018 | 1,302 | 1,051 | 934 | 1,257 | 536 | 568 | 266 | 143 | 1,157 | 1,215 | 1,294 | 1,383 | 11,106 |
| 2019 | 2,150 | 1,762 | 1,647 | 1,645 | 1,680 | 1,147 | 1,334 | 1,454 | 1,512 | 1,216 | 1,972 | 1,482 | 19,001 |
| 2020 | 1,241 | 1,607 | 973 | 688 | 1,529 | 1,605 | 1,581 | 1,405 | 1,523 | 2,004 | 1,646 | 2,290 | 18,092 |
| 2021 | 1,354 | 1,354 | 1,523 | 2,027 | 1,949 | 2,027 | 1,645 | 1,584 | 1,645 | 1,980 | 1,980 | 1,980 | 21,048 |
| 2022 | 849 | 849 | 955 | 2,021 | 1,946 | 1,946 | 1,980 | 2,056 | 1,980 | 2,204 | 2,116 | 2,292 | 21,194 |
| 2023 | 1,560 | 1,497 | 1,685 | 1,559 | 1,499 | 1,559 | 1,720 | 1,857 | 1,789 | 1,830 | 1,830 | 1,903 | 20,288 |
| 2024 | 1,073 | 1,073 | 1,116 | 1,499 | 1,559 | 1,559 | 1,975 | 2,212 | 1,817 | 2,042 | 2,397 | 2,486 | 20,808 |
| 2025 | 1,087 | — | 1,130 | 1,687 | 1,752 | 1,557 | 1,829 | 1,599 | 1,395 | 1,779 | 1,806 | 2,108 | 17,729 |
| 2026 | 1,648 | 1,521 | 1,647 | 1,614 | 1,756 | 1,599 | — | — | — | — | — | — | 9,785 |
Porsche Cayenne Sales in Canada
Canada tracks the same cycle at roughly one seventh the volume. The series starts at 1,017 units in 2004, bottoms at 572 in 2006, and then climbs through the 2010s to a record 3,129 in 2019. Volume settled into a tight band after that, running 2,872 in 2022, 2,940 in 2023 and 2,949 in 2024, three consecutive years within 80 units of each other. In 2025 Canadian sales eased to 2,551, down about 14 percent. The first half of 2026 has continued at that lower level with 1,128 units through June against 1,310 in the same six months of 2025, a decline of roughly 14 percent.
Porsche Cayenne, Canada calendar-year unit sales, 2004–2026. 2026 is January–Jun (partial).
Annual sales
| Year | Units | YoY |
|---|---|---|
| 2004 | 1,017 | — |
| 2005 | 917 | ▼ 9.8% |
| 2006 | 572 | ▼ 37.6% |
| 2007 | 823 | ▲ 43.9% |
| 2008 | 778 | ▼ 5.5% |
| 2009 | 718 | ▼ 7.7% |
| 2010 | 839 | ▲ 16.9% |
| 2011 | 1,105 | ▲ 31.7% |
| 2012 | 1,628 | ▲ 47.3% |
| 2013 | 2,050 | ▲ 25.9% |
| 2014 | 1,904 | ▼ 7.1% |
| 2015 | 2,389 | ▲ 25.5% |
| 2016 | 2,325 | ▼ 2.7% |
| 2017 | 2,079 | ▼ 10.6% |
| 2018 | 2,107 | ▲ 1.3% |
| 2019 | 3,129 | ▲ 48.5% |
| 2020 | 2,342 | ▼ 25.2% |
| 2021 | 2,443 | ▲ 4.3% |
| 2022 | 2,872 | ▲ 17.6% |
| 2023 | 2,940 | ▲ 2.4% |
| 2024 | 2,949 | ▲ 0.3% |
| 2025 | 2,551 | ▼ 13.5% |
| 2026 (Jan–Jun) | 1,128 | ▼ 13.9% YTD |
Monthly sales
| Year | Jan | Feb | Mar | Apr | May | Jun | Jul | Aug | Sep | Oct | Nov | Dec | Total |
|---|---|---|---|---|---|---|---|---|---|---|---|---|---|
| 2004 | 72 | 61 | 86 | 91 | 103 | 92 | 68 | 95 | 91 | 103 | 90 | 65 | 1,017 |
| 2005 | 61 | 54 | 70 | 75 | 115 | 74 | 74 | 83 | 75 | 104 | 70 | 62 | 917 |
| 2006 | 35 | 31 | 47 | 62 | 71 | 51 | 25 | 51 | 52 | 65 | 51 | 31 | 572 |
| 2007 | 55 | 21 | 45 | 82 | 79 | 82 | 96 | 80 | 80 | 79 | 62 | 62 | 823 |
| 2008 | 75 | 57 | 58 | 81 | 52 | 66 | 44 | 59 | 72 | 76 | 81 | 57 | 778 |
| 2009 | 63 | 33 | 54 | 88 | 55 | 61 | 77 | 62 | 76 | 48 | 58 | 43 | 718 |
| 2010 | 46 | 26 | 48 | 41 | 37 | 67 | 109 | 66 | 112 | 103 | 88 | 96 | 839 |
| 2011 | 101 | 90 | 104 | 181 | 149 | 90 | 89 | 78 | 93 | 49 | 50 | 31 | 1,105 |
| 2012 | 68 | 92 | 123 | 183 | 131 | 116 | 100 | 138 | 219 | 160 | 155 | 143 | 1,628 |
| 2013 | 88 | 116 | 164 | 173 | 204 | 183 | 167 | 199 | 184 | 209 | 201 | 162 | 2,050 |
| 2014 | 129 | 158 | 166 | 222 | 215 | 192 | 198 | 148 | 117 | 61 | 167 | 131 | 1,904 |
| 2015 | 100 | 82 | 176 | 237 | 272 | 281 | 277 | 216 | 189 | 206 | 178 | 175 | 2,389 |
| 2016 | 78 | 98 | 244 | 219 | 215 | 290 | 238 | 151 | 196 | 181 | 204 | 211 | 2,325 |
| 2017 | 83 | 110 | 183 | 203 | 210 | 170 | 184 | 163 | 193 | 213 | 192 | 175 | 2,079 |
| 2018 | 119 | 144 | 164 | 137 | 112 | 96 | 120 | 54 | 272 | 300 | 239 | 350 | 2,107 |
| 2019 | 237 | 216 | 228 | 287 | 287 | 261 | 314 | 314 | 288 | 250 | 217 | 230 | 3,129 |
| 2020 | 103 | 94 | 104 | 159 | 145 | 160 | 295 | 281 | 283 | 246 | 224 | 248 | 2,342 |
| 2021 | 129 | 129 | 150 | 301 | 274 | 303 | 271 | 284 | 272 | 108 | 108 | 114 | 2,443 |
| 2022 | 203 | 194 | 224 | 264 | 264 | 277 | 255 | 293 | 268 | 210 | 210 | 210 | 2,872 |
| 2023 | 221 | 201 | 233 | 277 | 305 | 307 | 191 | 220 | 192 | 276 | 264 | 253 | 2,940 |
| 2024 | 166 | 158 | 159 | 296 | 296 | 270 | 237 | 237 | 216 | 328 | 285 | 301 | 2,949 |
| 2025 | 197 | 179 | 189 | 256 | 244 | 245 | 194 | 186 | 187 | 242 | 200 | 232 | 2,551 |
| 2026 | 162 | 145 | 160 | 217 | 223 | 221 | — | — | — | — | — | — | 1,128 |







