
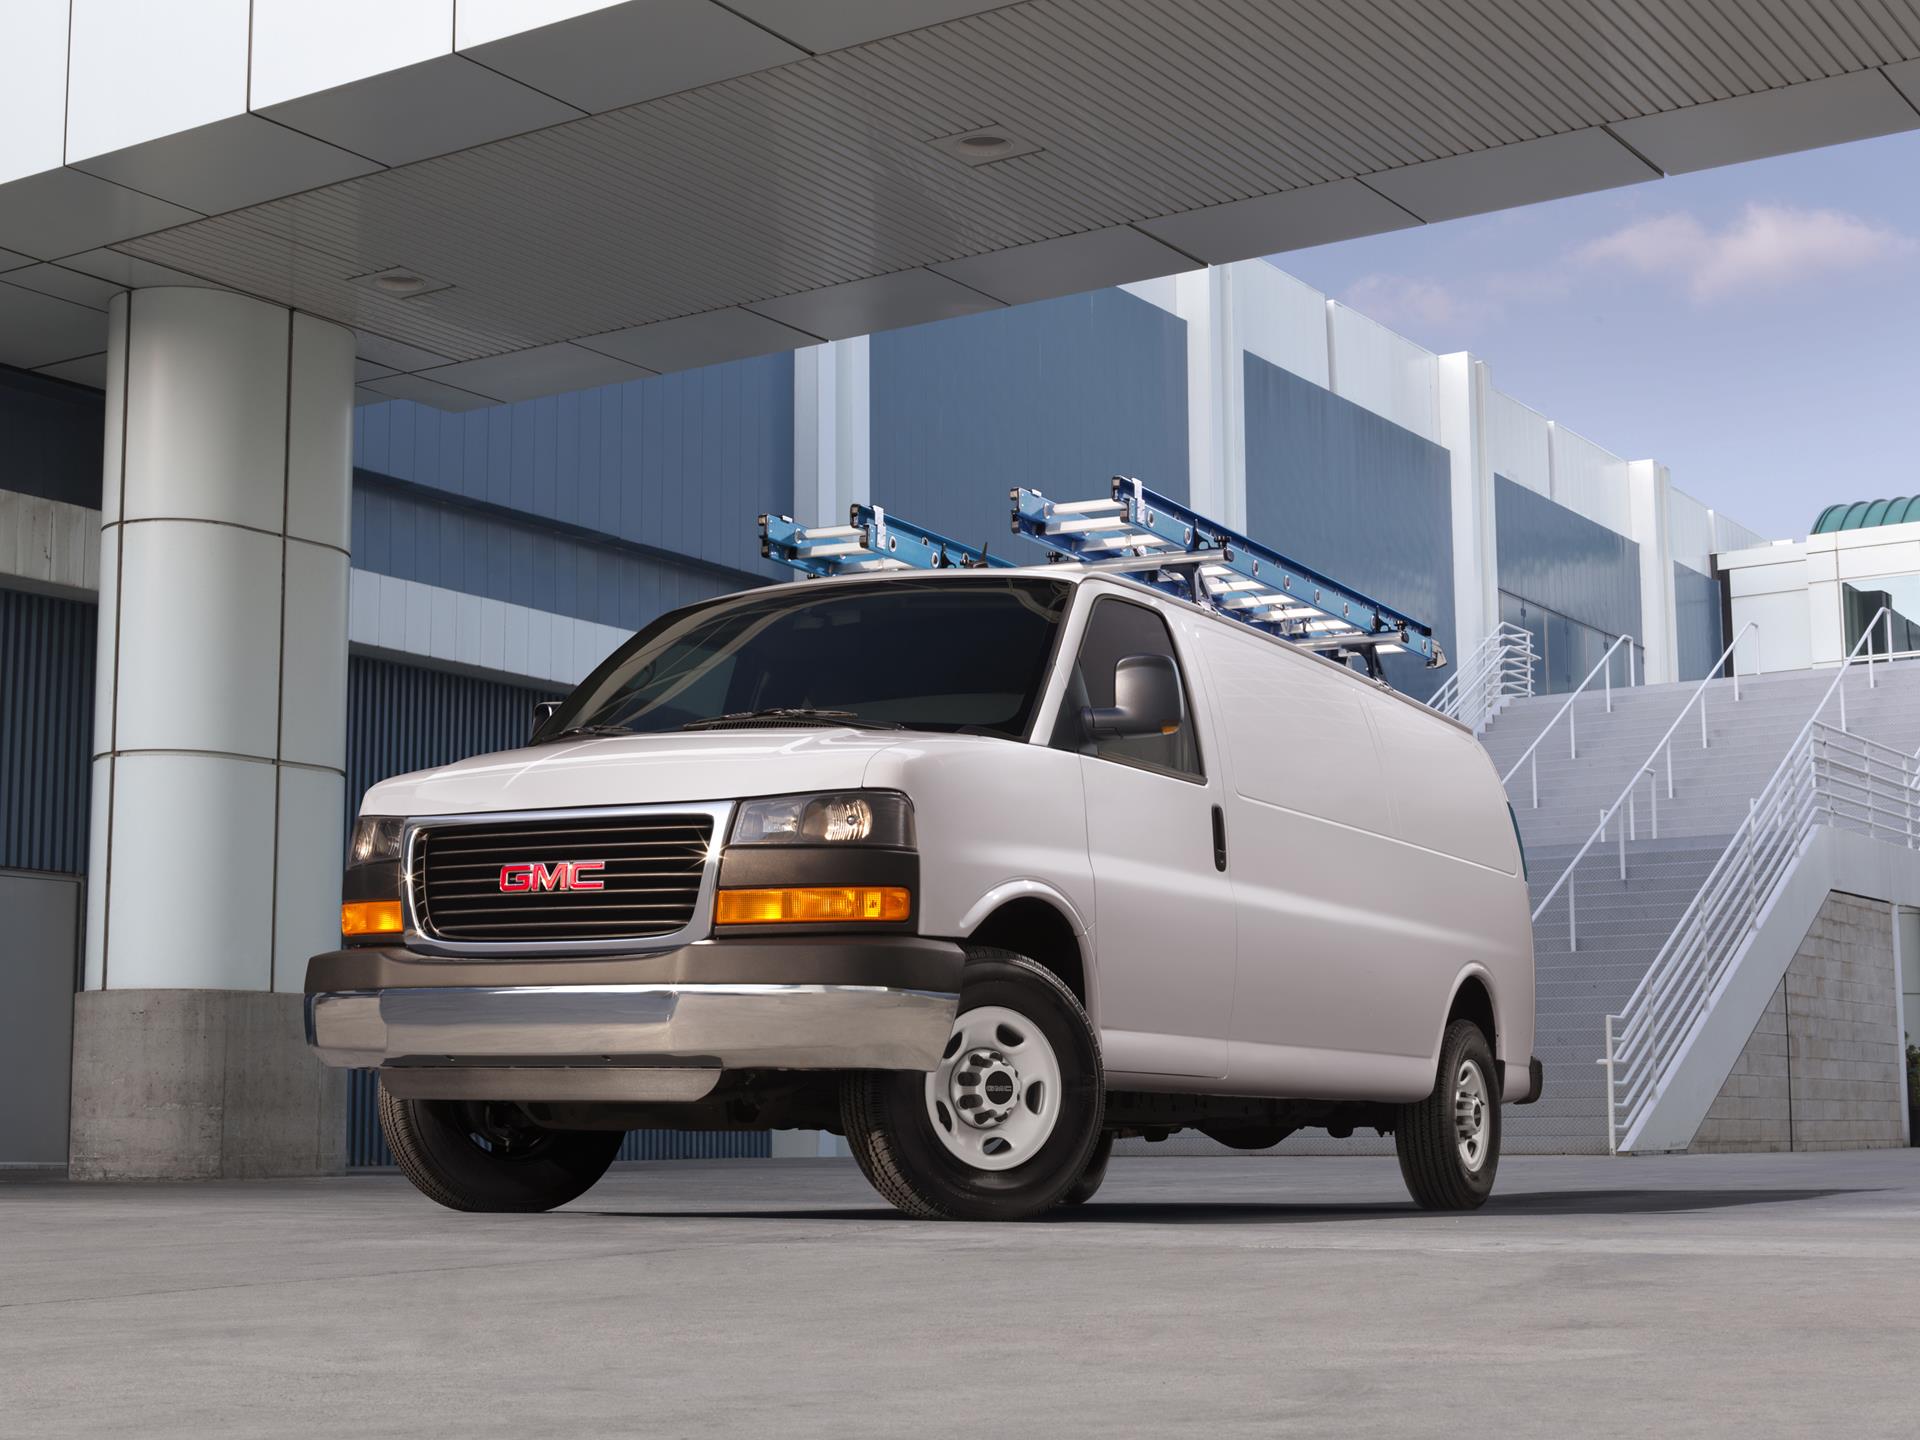
GMC Savana
Here you will find monthly and yearly United States and Canadian sales figures for the GMC Savana. The Savana is General Motors’ full-size van, introduced for 1996 alongside its Chevrolet Express twin and still on sale today, which makes it one of the longest-running nameplates in North America. It is overwhelmingly a commercial and fleet vehicle, sold as a cargo van, a passenger van and a cutaway chassis, and its sales pattern reflects fleet ordering cycles far more than retail demand.
- Class: Full-size commercial van, offered as cargo van, passenger van and cutaway
- Engines: 4.3L V6, 276 hp and 298 lb-ft; available 6.6L V8, 401 hp and 464 lb-ft
- Transmission: Automatic
- Configurations: 2500 and 3500 series in regular or extended wheelbase
- Capacity: Up to 283.6 cubic feet of cargo volume, or 12- and 15-passenger seating layouts
- Payload and towing: Up to 4,280 pounds of payload and up to 10,000 pounds of maximum available trailering in cargo form, 9,600 pounds in passenger form
- Pricing: From $42,200
- Chief rivals: Chevrolet Express, Ford Transit, Ram ProMaster, Mercedes-Benz Sprinter
GMC does not currently publish a transmission speed count or a drivetrain breakdown for the Savana on its consumer model pages, so both are stated only as far as the manufacturer confirms them.
GMC Savana Sales in the United States
GMC Savana volume in the United States moves in large steps because it tracks fleet orders. The van ran between roughly 20,000 and 30,000 units a year through the 2010s, fell to 15,108 units in 2020 when plants shut, then jumped to 36,008 units in 2021. GMC recorded 20,460 units in 2025 and 5,751 units through June 2026. One figure on this chart should not be read at face value: April 2024 is recorded as 26,035 units against a trend near 2,200 units on either side, and that single month accounts for more than half of the 42,541-unit 2024 total. That total is almost certainly a data error rather than a real spike, so the 2024 column and any 2024 to 2025 comparison drawn from it are unreliable. Excluding it, 2025 sits within the Savana’s normal recent range.
GMC Savana, United States calendar-year unit sales, 2005–2026. 2026 is January–Jun (partial).
Annual sales
| Year | Units | YoY |
|---|---|---|
| 2005 | 34,765 | — |
| 2006 | 29,973 | ▼ 13.8% |
| 2007 | 25,706 | ▼ 14.2% |
| 2008 | 22,437 | ▼ 12.7% |
| 2009 | 12,164 | ▼ 45.8% |
| 2010 | 13,942 | ▲ 14.6% |
| 2011 | 17,268 | ▲ 23.9% |
| 2012 | 22,776 | ▲ 31.9% |
| 2013 | 16,705 | ▼ 26.7% |
| 2014 | 26,641 | ▲ 59.5% |
| 2015 | 21,992 | ▼ 17.5% |
| 2016 | 20,607 | ▼ 6.3% |
| 2017 | 29,679 | ▲ 44.0% |
| 2018 | 19,685 | ▼ 33.7% |
| 2019 | 24,227 | ▲ 23.1% |
| 2020 | 15,108 | ▼ 37.6% |
| 2021 | 36,008 | ▲ 138.3% |
| 2022 | 25,569 | ▼ 29.0% |
| 2023 | 21,788 | ▼ 14.8% |
| 2024 | 42,541 | ▲ 95.2% |
| 2025 | 20,460 | ▼ 51.9% |
| 2026 (Jan–Jun) | 5,751 | ▼ 45.1% YTD |
Monthly sales
| Year | Jan | Feb | Mar | Apr | May | Jun | Jul | Aug | Sep | Oct | Nov | Dec | Total |
|---|---|---|---|---|---|---|---|---|---|---|---|---|---|
| 2005 | 2,654 | 2,422 | 4,452 | 4,967 | 3,938 | 3,065 | 3,208 | 1,920 | 2,055 | 1,738 | 1,732 | 2,614 | 34,765 |
| 2006 | 2,237 | 2,837 | 3,136 | 3,231 | 3,554 | 3,095 | 2,612 | 2,037 | 1,831 | 1,626 | 1,783 | 1,994 | 29,973 |
| 2007 | 1,490 | 2,440 | 2,466 | 2,754 | 2,237 | 2,917 | 2,913 | 1,947 | 1,529 | 1,405 | 1,561 | 2,047 | 25,706 |
| 2008 | 1,320 | 1,490 | 3,908 | 2,386 | 961 | 1,731 | 2,020 | 2,142 | 3,315 | 1,060 | 807 | 1,297 | 22,437 |
| 2009 | 1,220 | 787 | 1,217 | 1,950 | 1,619 | 721 | 749 | 825 | 616 | 764 | 650 | 1,046 | 12,164 |
| 2010 | 502 | 720 | 1,446 | 1,228 | 1,494 | 1,249 | 1,748 | 1,291 | 923 | 1,242 | 949 | 1,150 | 13,942 |
| 2011 | 718 | 673 | 1,300 | 2,784 | 2,826 | 1,835 | 1,219 | 895 | 846 | 910 | 732 | 2,530 | 17,268 |
| 2012 | 838 | 4,252 | 2,074 | 2,342 | 2,571 | 2,105 | 2,653 | 1,545 | 1,005 | 1,047 | 1,014 | 1,330 | 22,776 |
| 2013 | 1,044 | 886 | 955 | 1,529 | 1,906 | 1,890 | 1,400 | 1,128 | 820 | 1,027 | 1,532 | 2,588 | 16,705 |
| 2014 | 1,936 | 2,194 | 1,927 | 1,755 | 4,124 | 4,333 | 3,593 | 1,923 | 1,402 | 1,013 | 716 | 1,725 | 26,641 |
| 2015 | 1,489 | 1,999 | 1,800 | 3,438 | 2,636 | 2,577 | 981 | 744 | 728 | 1,380 | 1,439 | 2,781 | 21,992 |
| 2016 | 1,500 | 1,380 | 1,244 | 3,412 | 2,341 | 1,597 | 726 | 692 | 1,004 | 760 | 1,635 | 4,316 | 20,607 |
| 2017 | 1,235 | 1,843 | 3,689 | 3,629 | 2,618 | 3,726 | 2,095 | 1,868 | 3,465 | 1,845 | 1,712 | 1,954 | 29,679 |
| 2018 | 700 | 1,478 | 2,619 | 2,389 | 2,389 | 2,389 | 1,521 | 1,711 | 1,584 | 981 | 943 | 981 | 19,685 |
| 2019 | 2,160 | 2,073 | 2,333 | 3,088 | 3,564 | 2,851 | 1,652 | 1,850 | 1,520 | 1,033 | 1,070 | 1,033 | 24,227 |
| 2020 | 1,358 | 1,759 | 1,065 | 537 | 1,194 | 1,253 | 1,698 | 1,510 | 1,635 | 1,045 | 859 | 1,195 | 15,108 |
| 2021 | 20,133 | 1,871 | 2,105 | 1,838 | 1,768 | 1,838 | 748 | 720 | 748 | 1,413 | 1,413 | 1,413 | 36,008 |
| 2022 | 955 | 955 | 1,075 | 2,325 | 2,239 | 2,239 | 2,857 | 2,967 | 2,857 | 2,367 | 2,272 | 2,461 | 25,569 |
| 2023 | 1,578 | 1,515 | 1,704 | 2,454 | 2,360 | 2,454 | 2,306 | 2,491 | 2,399 | 831 | 831 | 865 | 21,788 |
| 2024 | 355 | 355 | 369 | 26,035 | 2,161 | 2,161 | 2,262 | 2,533 | 2,081 | 1,247 | 1,464 | 1,518 | 42,541 |
| 2025 | 858 | 824 | 893 | 2,668 | 2,770 | 2,463 | 2,330 | 2,038 | 2,206 | 1,065 | 1,081 | 1,264 | 20,460 |
| 2026 | 764 | 705 | 764 | 1,188 | 1,142 | 1,188 | — | — | — | — | — | — | 5,751 |
GMC Savana Sales in Canada
Canada has been a proportionally larger market for the Savana than for most GMC nameplates. Sales peaked at 7,687 units in 2007 and held between 4,500 and 7,000 units for most of the 2010s before falling to a low of 2,382 units in 2021 during the semiconductor shortage. Volume has since rebuilt: 3,609 units in 2023, 3,617 in 2024 and 5,029 in 2025, a gain of about 39 percent and the strongest Canadian year since 2019, with July through September each above 520 units. The first half of 2026 has cooled to 1,595 units, about 30 percent behind the same period last year, though monthly volume has been stable in the 220 to 310 range.
GMC Savana, Canada calendar-year unit sales, 2004–2026. 2026 is January–Jun (partial).
Annual sales
| Year | Units | YoY |
|---|---|---|
| 2004 | 6,752 | — |
| 2005 | 6,552 | ▼ 3.0% |
| 2006 | 7,238 | ▲ 10.5% |
| 2007 | 7,687 | ▲ 6.2% |
| 2008 | 4,640 | ▼ 39.6% |
| 2009 | 4,259 | ▼ 8.2% |
| 2010 | 4,649 | ▲ 9.2% |
| 2011 | 4,631 | ▼ 0.4% |
| 2012 | 4,638 | ▲ 0.2% |
| 2013 | 5,792 | ▲ 24.9% |
| 2014 | 6,644 | ▲ 14.7% |
| 2015 | 6,809 | ▲ 2.5% |
| 2016 | 7,012 | ▲ 3.0% |
| 2017 | 6,478 | ▼ 7.6% |
| 2018 | 6,543 | ▲ 1.0% |
| 2019 | 5,565 | ▼ 14.9% |
| 2020 | 4,688 | ▼ 15.8% |
| 2021 | 2,382 | ▼ 49.2% |
| 2022 | 2,489 | ▲ 4.5% |
| 2023 | 3,609 | ▲ 45.0% |
| 2024 | 3,617 | ▲ 0.2% |
| 2025 | 5,029 | ▲ 39.0% |
| 2026 (Jan–Jun) | 1,595 | ▼ 30.2% YTD |
Monthly sales
| Year | Jan | Feb | Mar | Apr | May | Jun | Jul | Aug | Sep | Oct | Nov | Dec | Total |
|---|---|---|---|---|---|---|---|---|---|---|---|---|---|
| 2004 | 447 | 539 | 747 | 698 | 687 | 872 | 389 | 447 | 465 | 463 | 554 | 444 | 6,752 |
| 2005 | 316 | 495 | 760 | 931 | 657 | 510 | 469 | 457 | 433 | 424 | 486 | 614 | 6,552 |
| 2006 | 507 | 540 | 834 | 883 | 873 | 584 | 474 | 442 | 432 | 567 | 514 | 588 | 7,238 |
| 2007 | 549 | 349 | 760 | 711 | 1,271 | 1,242 | 636 | 264 | 424 | 480 | 470 | 531 | 7,687 |
| 2008 | 446 | 366 | 528 | 387 | 298 | 394 | 383 | 267 | 267 | 417 | 340 | 547 | 4,640 |
| 2009 | 166 | 320 | 714 | 571 | 598 | 524 | 278 | 181 | 294 | 216 | 159 | 238 | 4,259 |
| 2010 | 198 | 221 | 357 | 570 | 684 | 705 | 480 | 475 | 189 | 281 | 255 | 234 | 4,649 |
| 2011 | 167 | 193 | 351 | 551 | 730 | 768 | 365 | 331 | 225 | 356 | 273 | 321 | 4,631 |
| 2012 | 176 | 272 | 437 | 418 | 593 | 484 | 221 | 314 | 300 | 216 | 533 | 674 | 4,638 |
| 2013 | 253 | 139 | 421 | 547 | 894 | 523 | 672 | 124 | 574 | 432 | 388 | 825 | 5,792 |
| 2014 | 182 | 174 | 267 | 440 | 787 | 877 | 543 | 542 | 519 | 713 | 497 | 1,103 | 6,644 |
| 2015 | 172 | 316 | 624 | 620 | 337 | 820 | 830 | 688 | 539 | 471 | 518 | 874 | 6,809 |
| 2016 | 282 | 332 | 664 | 441 | 808 | 630 | 644 | 465 | 798 | 592 | 620 | 736 | 7,012 |
| 2017 | 262 | 431 | 439 | 706 | 567 | 890 | 638 | 418 | 408 | 557 | 569 | 593 | 6,478 |
| 2018 | 314 | 365 | 630 | 984 | 988 | 603 | 667 | 301 | 522 | 331 | 392 | 446 | 6,543 |
| 2019 | 360 | 327 | 345 | 518 | 518 | 473 | 640 | 640 | 582 | 417 | 363 | 382 | 5,565 |
| 2020 | 441 | 401 | 443 | 277 | 252 | 278 | 430 | 411 | 412 | 461 | 419 | 463 | 4,688 |
| 2021 | 278 | 278 | 320 | 218 | 198 | 219 | 107 | 113 | 109 | 177 | 177 | 188 | 2,382 |
| 2022 | 78 | 74 | 87 | 216 | 216 | 228 | 300 | 345 | 315 | 210 | 210 | 210 | 2,489 |
| 2023 | 192 | 175 | 203 | 207 | 228 | 230 | 397 | 457 | 398 | 391 | 374 | 357 | 3,609 |
| 2024 | 223 | 213 | 215 | 225 | 225 | 207 | 359 | 359 | 328 | 453 | 394 | 416 | 3,617 |
| 2025 | 314 | 286 | 302 | 475 | 453 | 454 | 553 | 527 | 529 | 408 | 337 | 391 | 5,029 |
| 2026 | 248 | 221 | 243 | 289 | 288 | 306 | — | — | — | — | — | — | 1,595 |







