
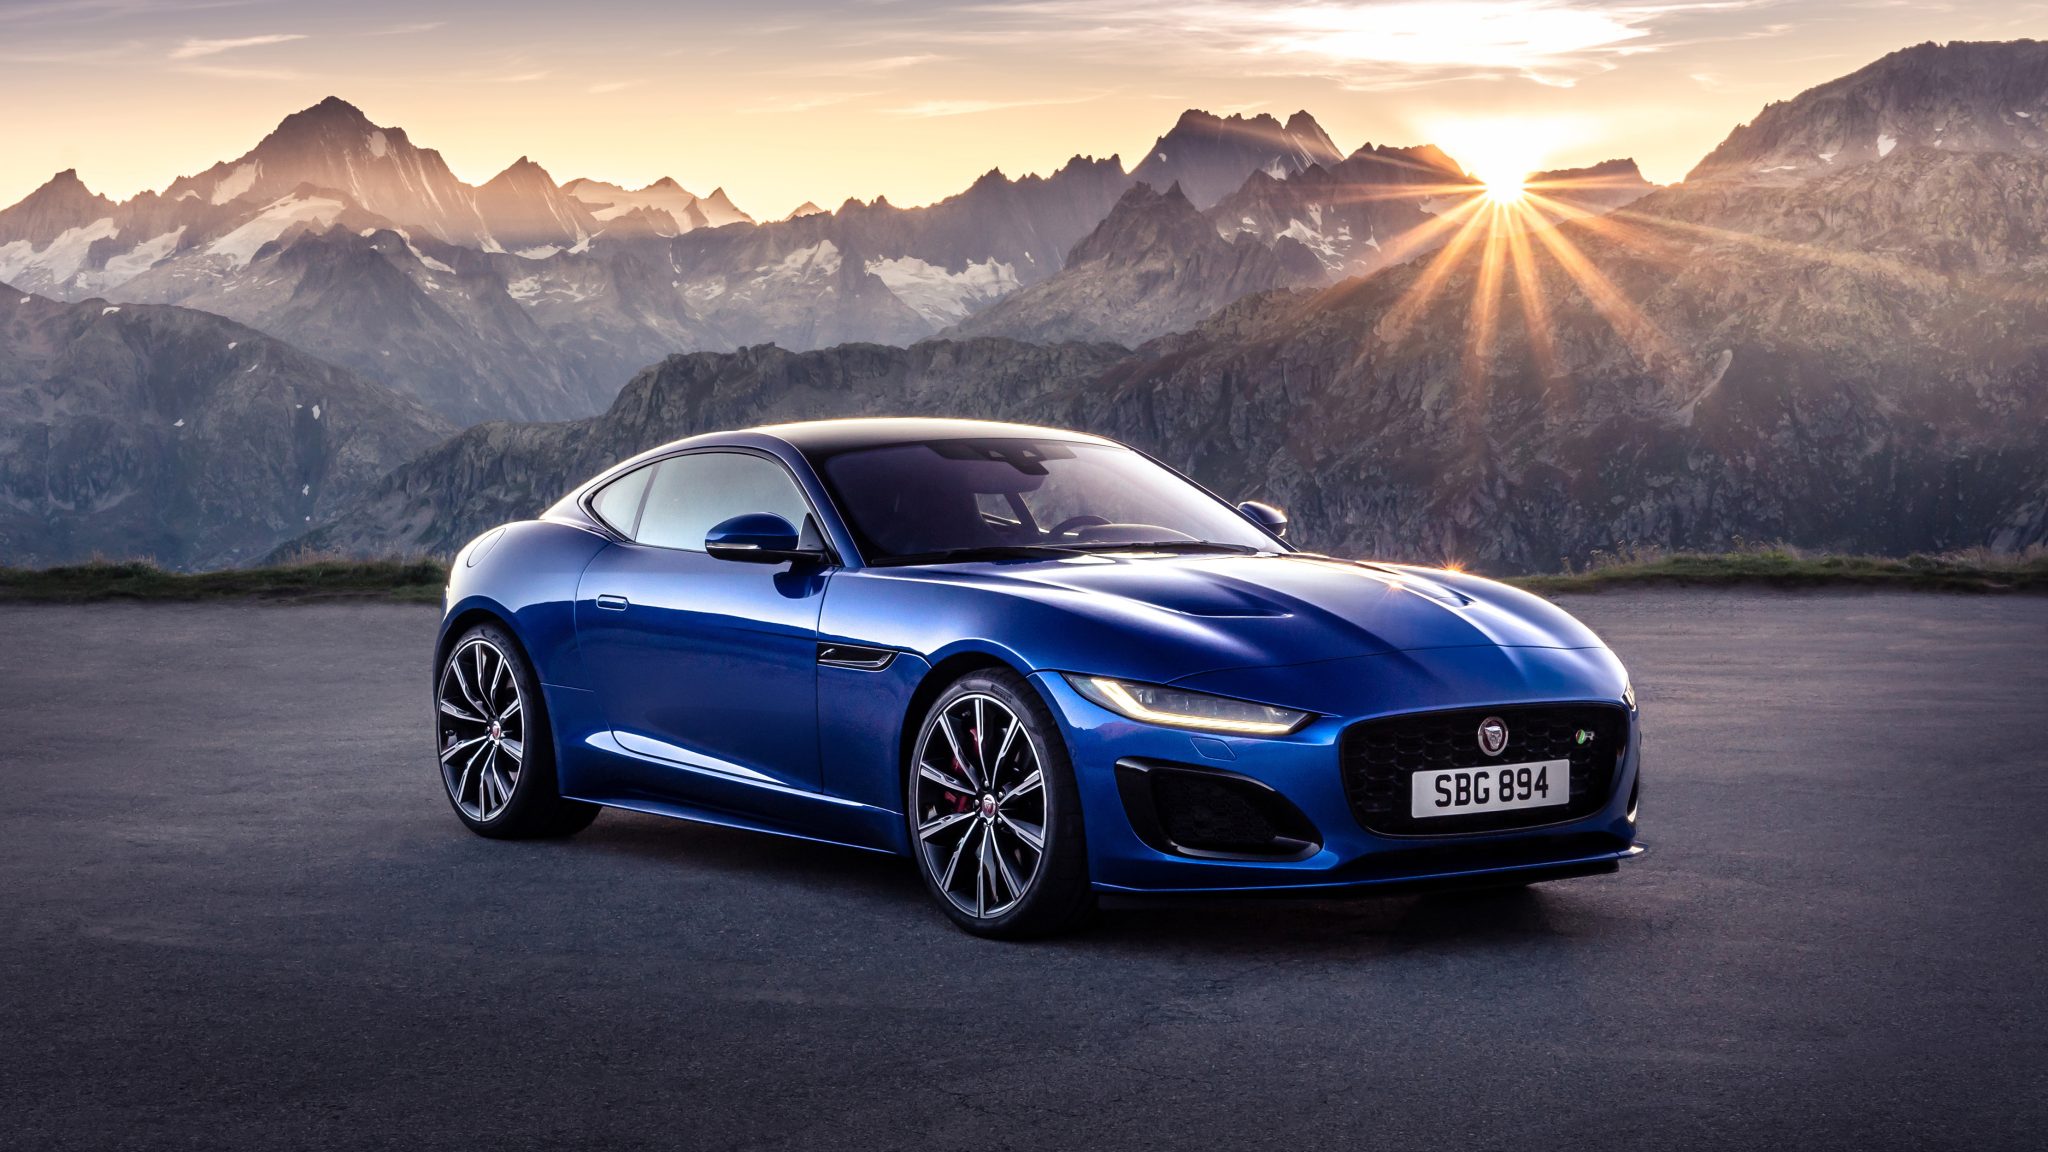
Jaguar F-Type
Here you will find monthly and yearly United States and Canadian sales figures for the Jaguar F-Type. The F-Type was Jaguar’s two-seat sports car, sold as a convertible from 2013 and as a coupe from the following year, and it was the brand’s first two-seater in almost 40 years. The F-Type was built at Jaguar’s Castle Bromwich plant in the UK. The 2024 model year was the last, and Jaguar says it also marks the final time one of its sports cars will be offered with an internal combustion engine; the last F-Type off the line, a V8 convertible, went into the Jaguar Heritage collection in June 2024.
- Class: Two-seat luxury sports car, coupe and convertible
- Engines (2024): 5.0-liter supercharged V8 in two outputs: 444 hp and 428 lb-ft (P450), or 575 hp and 516 lb-ft (P575 R75). Earlier model years also offered four-cylinder and V6 engines
- Transmission: 8-speed Quickshift automatic with paddle shifters
- Drivetrain: Rear-wheel drive on the P450 R-Dynamic; all-wheel drive on the F-Type 75 and R75
- Trims (2024): R-Dynamic, 75 and R75 (final model year)
- Chief rivals: Porsche 911, Chevrolet Corvette, Mercedes-AMG GT
Jaguar F-Type Sales in the United States
The U.S. chart begins in May 2013, when the F-Type convertible went on sale, and 2013 closed at 2,250. The arrival of the coupe lifted sales 82.8 percent to 4,112 in 2014, with July 2014 the best month on the chart at 501, and 2015 set the peak at 4,659. Volume held near 4,100 in 2016 and 2017, then fell 44.8 percent to 2,268 in 2018. Sales stayed between 1,701 and 2,279 a year from 2018 to 2021 before easing to 1,366 in 2022, 1,119 in 2023 and 1,156 in 2024. Jaguar said the F-Type would remain available until early 2025. 2025 finished at 337, down 70.8 percent, and January to June 2026 recorded 90 sales, against 161 a year earlier.
Jaguar F-Type, United States calendar-year unit sales, 2013–2026. 2026 is January–Jun (partial).
Annual sales
| Year | Units | YoY |
|---|---|---|
| 2013 | 2,250 | — |
| 2014 | 4,112 | ▲ 82.8% |
| 2015 | 4,659 | ▲ 13.3% |
| 2016 | 4,069 | ▼ 12.7% |
| 2017 | 4,108 | ▲ 1.0% |
| 2018 | 2,268 | ▼ 44.8% |
| 2019 | 2,279 | ▲ 0.5% |
| 2020 | 1,701 | ▼ 25.4% |
| 2021 | 2,112 | ▲ 24.2% |
| 2022 | 1,366 | ▼ 35.3% |
| 2023 | 1,119 | ▼ 18.1% |
| 2024 | 1,156 | ▲ 3.3% |
| 2025 | 337 | ▼ 70.8% |
| 2026 (Jan–Jun) | 90 | ▼ 44.1% YTD |
Monthly sales
| Year | Jan | Feb | Mar | Apr | May | Jun | Jul | Aug | Sep | Oct | Nov | Dec | Total |
|---|---|---|---|---|---|---|---|---|---|---|---|---|---|
| 2013 | — | — | — | — | 159 | 417 | 341 | 401 | 172 | 353 | 222 | 185 | 2,250 |
| 2014 | 177 | 322 | 287 | 92 | 431 | 428 | 501 | 378 | 329 | 342 | 377 | 448 | 4,112 |
| 2015 | 301 | 422 | 335 | 274 | 369 | 451 | 425 | 436 | 354 | 400 | 432 | 460 | 4,659 |
| 2016 | 333 | 365 | 426 | 295 | 281 | 306 | 354 | 386 | 273 | 393 | 269 | 388 | 4,069 |
| 2017 | 330 | 344 | 492 | 406 | 409 | 327 | 232 | 247 | 279 | 275 | 376 | 391 | 4,108 |
| 2018 | 310 | 224 | 207 | 148 | 155 | 175 | 129 | 202 | 189 | 186 | 146 | 197 | 2,268 |
| 2019 | 282 | 280 | 176 | 177 | 171 | 169 | 238 | 158 | 152 | 133 | 187 | 156 | 2,279 |
| 2020 | 181 | 161 | 168 | 52 | 116 | 122 | 140 | 125 | 135 | 169 | 139 | 193 | 1,701 |
| 2021 | 195 | 195 | 220 | 170 | 163 | 170 | 101 | 98 | 101 | 233 | 233 | 233 | 2,112 |
| 2022 | 128 | 128 | 144 | 97 | 93 | 93 | 129 | 134 | 129 | 97 | 93 | 101 | 1,366 |
| 2023 | 119 | 115 | 129 | 71 | 68 | 71 | 91 | 99 | 95 | 86 | 86 | 89 | 1,119 |
| 2024 | 113 | 113 | 117 | 74 | 77 | 77 | 112 | 125 | 103 | 72 | 85 | 88 | 1,156 |
| 2025 | 40 | 38 | 42 | 14 | 14 | 13 | 34 | 30 | 33 | 24 | 25 | 30 | 337 |
| 2026 | 14 | 13 | 13 | 16 | 18 | 16 | — | — | — | — | — | — | 90 |
Jaguar F-Type Sales in Canada
In Canada the chart also begins in May 2013, at 229 for the year. Sales doubled to 457 in 2014 and climbed to a peak of 522 in 2016, with March 2016 the best month on the chart at 83. Volume then slipped most years, from 417 in 2017 to 190 in 2020 and 130 in 2022, with a brief lift to 144 in 2023. 2024 finished at 111 and 2025 at 92, down 17.1 percent, and January to June 2026 recorded 33 sales, against 45 a year earlier.
Jaguar F-Type, Canada calendar-year unit sales, 2013–2026. 2026 is January–Jun (partial).
Annual sales
| Year | Units | YoY |
|---|---|---|
| 2013 | 229 | — |
| 2014 | 457 | ▲ 99.6% |
| 2015 | 462 | ▲ 1.1% |
| 2016 | 522 | ▲ 13.0% |
| 2017 | 417 | ▼ 20.1% |
| 2018 | 373 | ▼ 10.6% |
| 2019 | 268 | ▼ 28.2% |
| 2020 | 190 | ▼ 29.1% |
| 2021 | 171 | ▼ 10.0% |
| 2022 | 130 | ▼ 24.0% |
| 2023 | 144 | ▲ 10.8% |
| 2024 | 111 | ▼ 22.9% |
| 2025 | 92 | ▼ 17.1% |
| 2026 (Jan–Jun) | 33 | ▼ 26.7% YTD |
Monthly sales
| Year | Jan | Feb | Mar | Apr | May | Jun | Jul | Aug | Sep | Oct | Nov | Dec | Total |
|---|---|---|---|---|---|---|---|---|---|---|---|---|---|
| 2013 | 0 | 0 | 0 | 0 | 18 | 47 | 51 | 39 | 31 | 14 | 18 | 11 | 229 |
| 2014 | 21 | 27 | 47 | 26 | 57 | 78 | 35 | 42 | 33 | 18 | 46 | 27 | 457 |
| 2015 | 12 | 28 | 59 | 30 | 60 | 73 | 60 | 31 | 29 | 20 | 31 | 29 | 462 |
| 2016 | 31 | 34 | 83 | 62 | 60 | 48 | 50 | 56 | 27 | 19 | 35 | 17 | 522 |
| 2017 | 16 | 22 | 49 | 37 | 44 | 54 | 25 | 47 | 40 | 36 | 31 | 16 | 417 |
| 2018 | 14 | 47 | 83 | 15 | 42 | 38 | 17 | 22 | 69 | 13 | 10 | 3 | 373 |
| 2019 | 30 | 27 | 31 | 24 | 24 | 23 | 26 | 26 | 24 | 11 | 10 | 12 | 268 |
| 2020 | 16 | 14 | 17 | 17 | 15 | 18 | 12 | 11 | 13 | 19 | 17 | 21 | 190 |
| 2021 | 16 | 16 | 20 | 21 | 19 | 23 | 9 | 10 | 11 | 8 | 8 | 10 | 171 |
| 2022 | 9 | 8 | 11 | 14 | 14 | 15 | 8 | 10 | 10 | 10 | 10 | 11 | 130 |
| 2023 | 9 | 8 | 11 | 17 | 18 | 20 | 10 | 12 | 11 | 9 | 9 | 10 | 144 |
| 2024 | 9 | 8 | 10 | 17 | 17 | 16 | 6 | 6 | 8 | 5 | 4 | 5 | 111 |
| 2025 | 5 | 5 | 7 | 9 | 9 | 10 | 8 | 8 | 10 | 7 | 6 | 8 | 92 |
| 2026 | 11 | 10 | 10 | 0 | 1 | 1 | — | — | — | — | — | — | 33 |







