
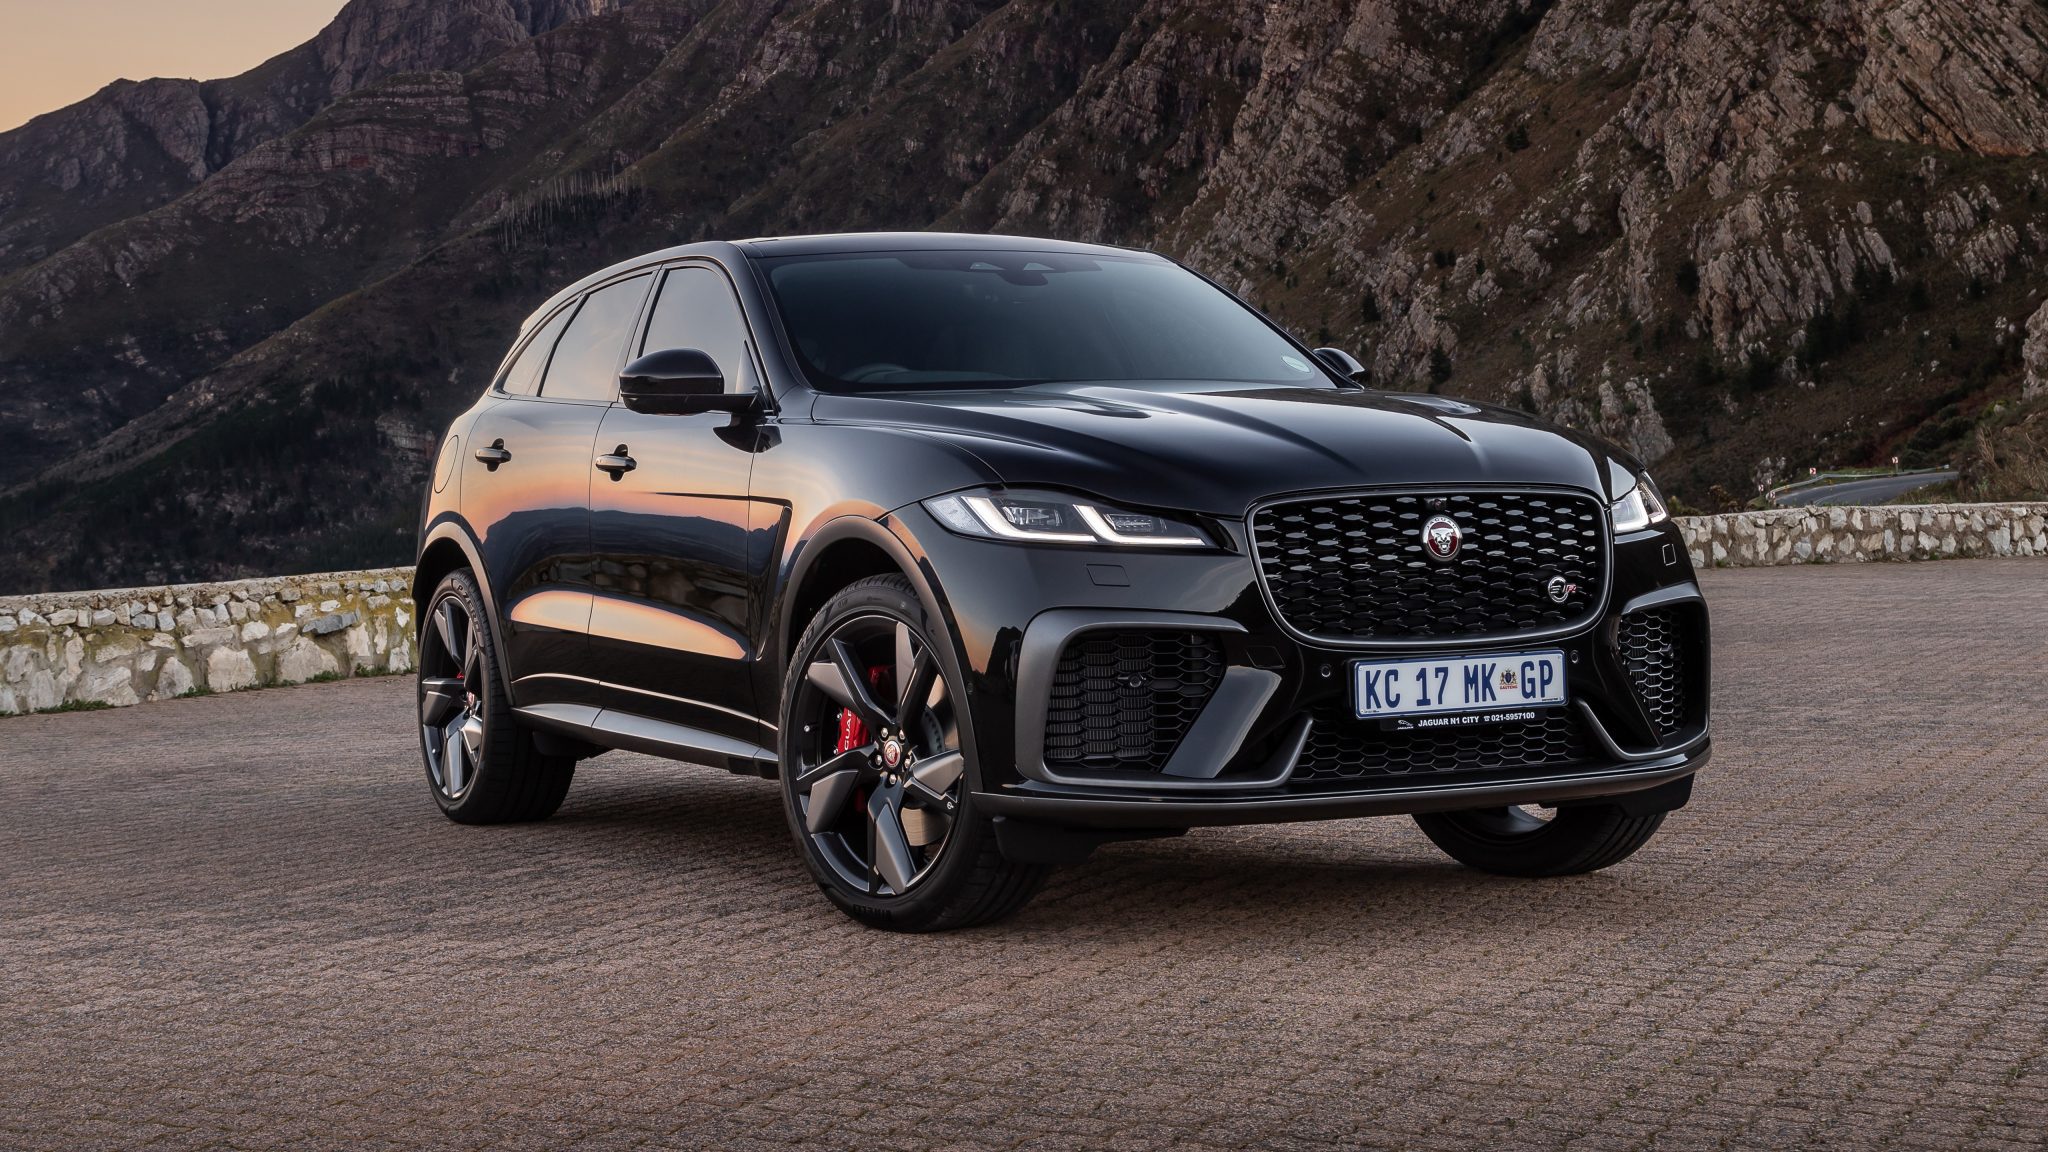
Jaguar F-Pace
Here you will find monthly and yearly United States and Canadian sales figures for the Jaguar F-Pace. The F-Pace was Jaguar’s first SUV when it went on sale in 2016. The current United States range runs from a 246-horsepower four-cylinder P250 through a 395-horsepower mild-hybrid inline-six P400 to the 567-horsepower supercharged V8 SVR 575 Edition, all with all-wheel drive.
- Class: Luxury midsize SUV, five seats
- Engines: P250: 2.0-liter turbocharged four-cylinder, 246 hp. P400: 3.0-liter inline-six mild hybrid, 395 hp. SVR 575 Edition: 5.0-liter supercharged V8, 567 hp
- Transmission: Eight-speed automatic
- Drivetrain: All-wheel drive on every version
- Trims: P250 R-Dynamic S, P400 R-Dynamic S and SVR 575 Edition
- Chief rivals: BMW X3, Mercedes-Benz GLC, Porsche Macan, Audi Q5
Jaguar F-Pace Sales in the United States
The Jaguar F-Pace chart for the United States starts with 10,016 sales in 2016, its launch year, and reaches its peak of 19,238 in 2017. Sales held at 12,997 in 2018, a total that is missing March, and 15,491 in 2019, then drifted lower each year to 5,258 in 2023. A small rise to 6,010 in 2024 was followed by 3,459 in 2025, down 42.4 percent, with the second quarter of 2025 the weakest full quarter on the chart at 446. The first half of 2026 totals 1,260, down 18.5 percent from 1,546 a year earlier. Jaguar reports its sales quarterly, so quarter totals are the most reliable way to read this line.
Jaguar F-Pace, United States calendar-year unit sales, 2016–2026. 2026 is January–Jun (partial).
Annual sales
| Year | Units | YoY |
|---|---|---|
| 2016 | 10,016 | — |
| 2017 | 19,238 | ▲ 92.1% |
| 2018 | 12,997 | ▼ 32.4% |
| 2019 | 15,491 | ▲ 19.2% |
| 2020 | 10,891 | ▼ 29.7% |
| 2021 | 9,237 | ▼ 15.2% |
| 2022 | 5,979 | ▼ 35.3% |
| 2023 | 5,258 | ▼ 12.1% |
| 2024 | 6,010 | ▲ 14.3% |
| 2025 | 3,459 | ▼ 42.4% |
| 2026 (Jan–Jun) | 1,260 | ▼ 18.5% YTD |
Monthly sales
| Year | Jan | Feb | Mar | Apr | May | Jun | Jul | Aug | Sep | Oct | Nov | Dec | Total |
|---|---|---|---|---|---|---|---|---|---|---|---|---|---|
| 2016 | — | — | — | — | 666 | 1,123 | 1,609 | 1,222 | 809 | 1,240 | 1,525 | 1,822 | 10,016 |
| 2017 | 1,458 | 1,888 | 2,187 | 1,377 | 1,440 | 1,501 | 1,748 | 1,681 | 1,356 | 1,444 | 1,450 | 1,708 | 19,238 |
| 2018 | 1,186 | 1,002 | — | 1,059 | 1,157 | 1,093 | 808 | 1,124 | 904 | 1,437 | 1,632 | 1,595 | 12,997 |
| 2019 | 1,465 | 1,345 | 1,730 | 1,038 | 903 | 828 | 862 | 1,169 | 1,021 | 1,325 | 1,787 | 2,018 | 15,491 |
| 2020 | 1,418 | 1,261 | 1,313 | 342 | 760 | 798 | 701 | 623 | 675 | 1,012 | 831 | 1,157 | 10,891 |
| 2021 | 660 | 660 | 743 | 939 | 900 | 936 | 641 | 618 | 641 | 833 | 833 | 833 | 9,237 |
| 2022 | 352 | 352 | 396 | 321 | 321 | 309 | 573 | 595 | 573 | 729 | 700 | 758 | 5,979 |
| 2023 | 530 | 509 | 572 | 387 | 372 | 387 | 333 | 359 | 346 | 481 | 481 | 501 | 5,258 |
| 2024 | 518 | 518 | 538 | 319 | 331 | 331 | 658 | 737 | 605 | 429 | 504 | 522 | 6,010 |
| 2025 | 367 | 352 | 381 | 151 | 156 | 139 | 377 | 330 | 358 | 265 | 269 | 314 | 3,459 |
| 2026 | 239 | 221 | 240 | 182 | 198 | 180 | — | — | — | — | — | — | 1,260 |
Jaguar F-Pace Sales in Canada
In Canada the F-Pace chart opens with 1,289 sales in 2016 and peaks at 2,612 in 2017. Volume stayed above 2,200 through 2019, then fell to about 1,400 a year in 2020 and 2021 and to 821 in 2022. Canada held up better than the United States after that, with 858 in 2023, 972 in 2024 and 847 in 2025, down 12.9 percent against a 42.4 percent drop south of the border. The first half of 2026 totals 242, down 43.9 percent from 431 a year earlier.
Jaguar F-Pace, Canada calendar-year unit sales, 2016–2026. 2026 is January–Jun (partial).
Annual sales
| Year | Units | YoY |
|---|---|---|
| 2016 | 1,289 | — |
| 2017 | 2,612 | ▲ 102.6% |
| 2018 | 2,417 | ▼ 7.5% |
| 2019 | 2,211 | ▼ 8.5% |
| 2020 | 1,445 | ▼ 34.6% |
| 2021 | 1,428 | ▼ 1.2% |
| 2022 | 821 | ▼ 42.5% |
| 2023 | 858 | ▲ 4.5% |
| 2024 | 972 | ▲ 13.3% |
| 2025 | 847 | ▼ 12.9% |
| 2026 (Jan–Jun) | 242 | ▼ 43.9% YTD |
Monthly sales
| Year | Jan | Feb | Mar | Apr | May | Jun | Jul | Aug | Sep | Oct | Nov | Dec | Total |
|---|---|---|---|---|---|---|---|---|---|---|---|---|---|
| 2016 | 0 | 0 | 0 | 0 | 22 | 222 | 179 | 159 | 129 | 203 | 195 | 180 | 1,289 |
| 2017 | 159 | 170 | 359 | 202 | 228 | 270 | 247 | 207 | 222 | 183 | 209 | 156 | 2,612 |
| 2018 | 167 | 174 | 328 | 180 | 181 | 217 | 168 | 208 | 213 | 191 | 238 | 152 | 2,417 |
| 2019 | 235 | 214 | 226 | 185 | 185 | 171 | 167 | 167 | 154 | 182 | 158 | 167 | 2,211 |
| 2020 | 181 | 164 | 182 | 102 | 93 | 104 | 95 | 90 | 92 | 117 | 106 | 119 | 1,445 |
| 2021 | 115 | 115 | 134 | 187 | 170 | 187 | 139 | 146 | 140 | 31 | 31 | 33 | 1,428 |
| 2022 | 46 | 44 | 52 | 57 | 57 | 61 | 71 | 82 | 76 | 91 | 91 | 93 | 821 |
| 2023 | 57 | 52 | 61 | 80 | 89 | 90 | 61 | 71 | 63 | 81 | 78 | 75 | 858 |
| 2024 | 104 | 100 | 101 | 93 | 93 | 87 | 73 | 73 | 67 | 65 | 56 | 60 | 972 |
| 2025 | 70 | 63 | 68 | 79 | 75 | 76 | 78 | 75 | 76 | 67 | 55 | 65 | 847 |
| 2026 | 49 | 44 | 48 | 29 | 31 | 41 | — | — | — | — | — | — | 242 |







