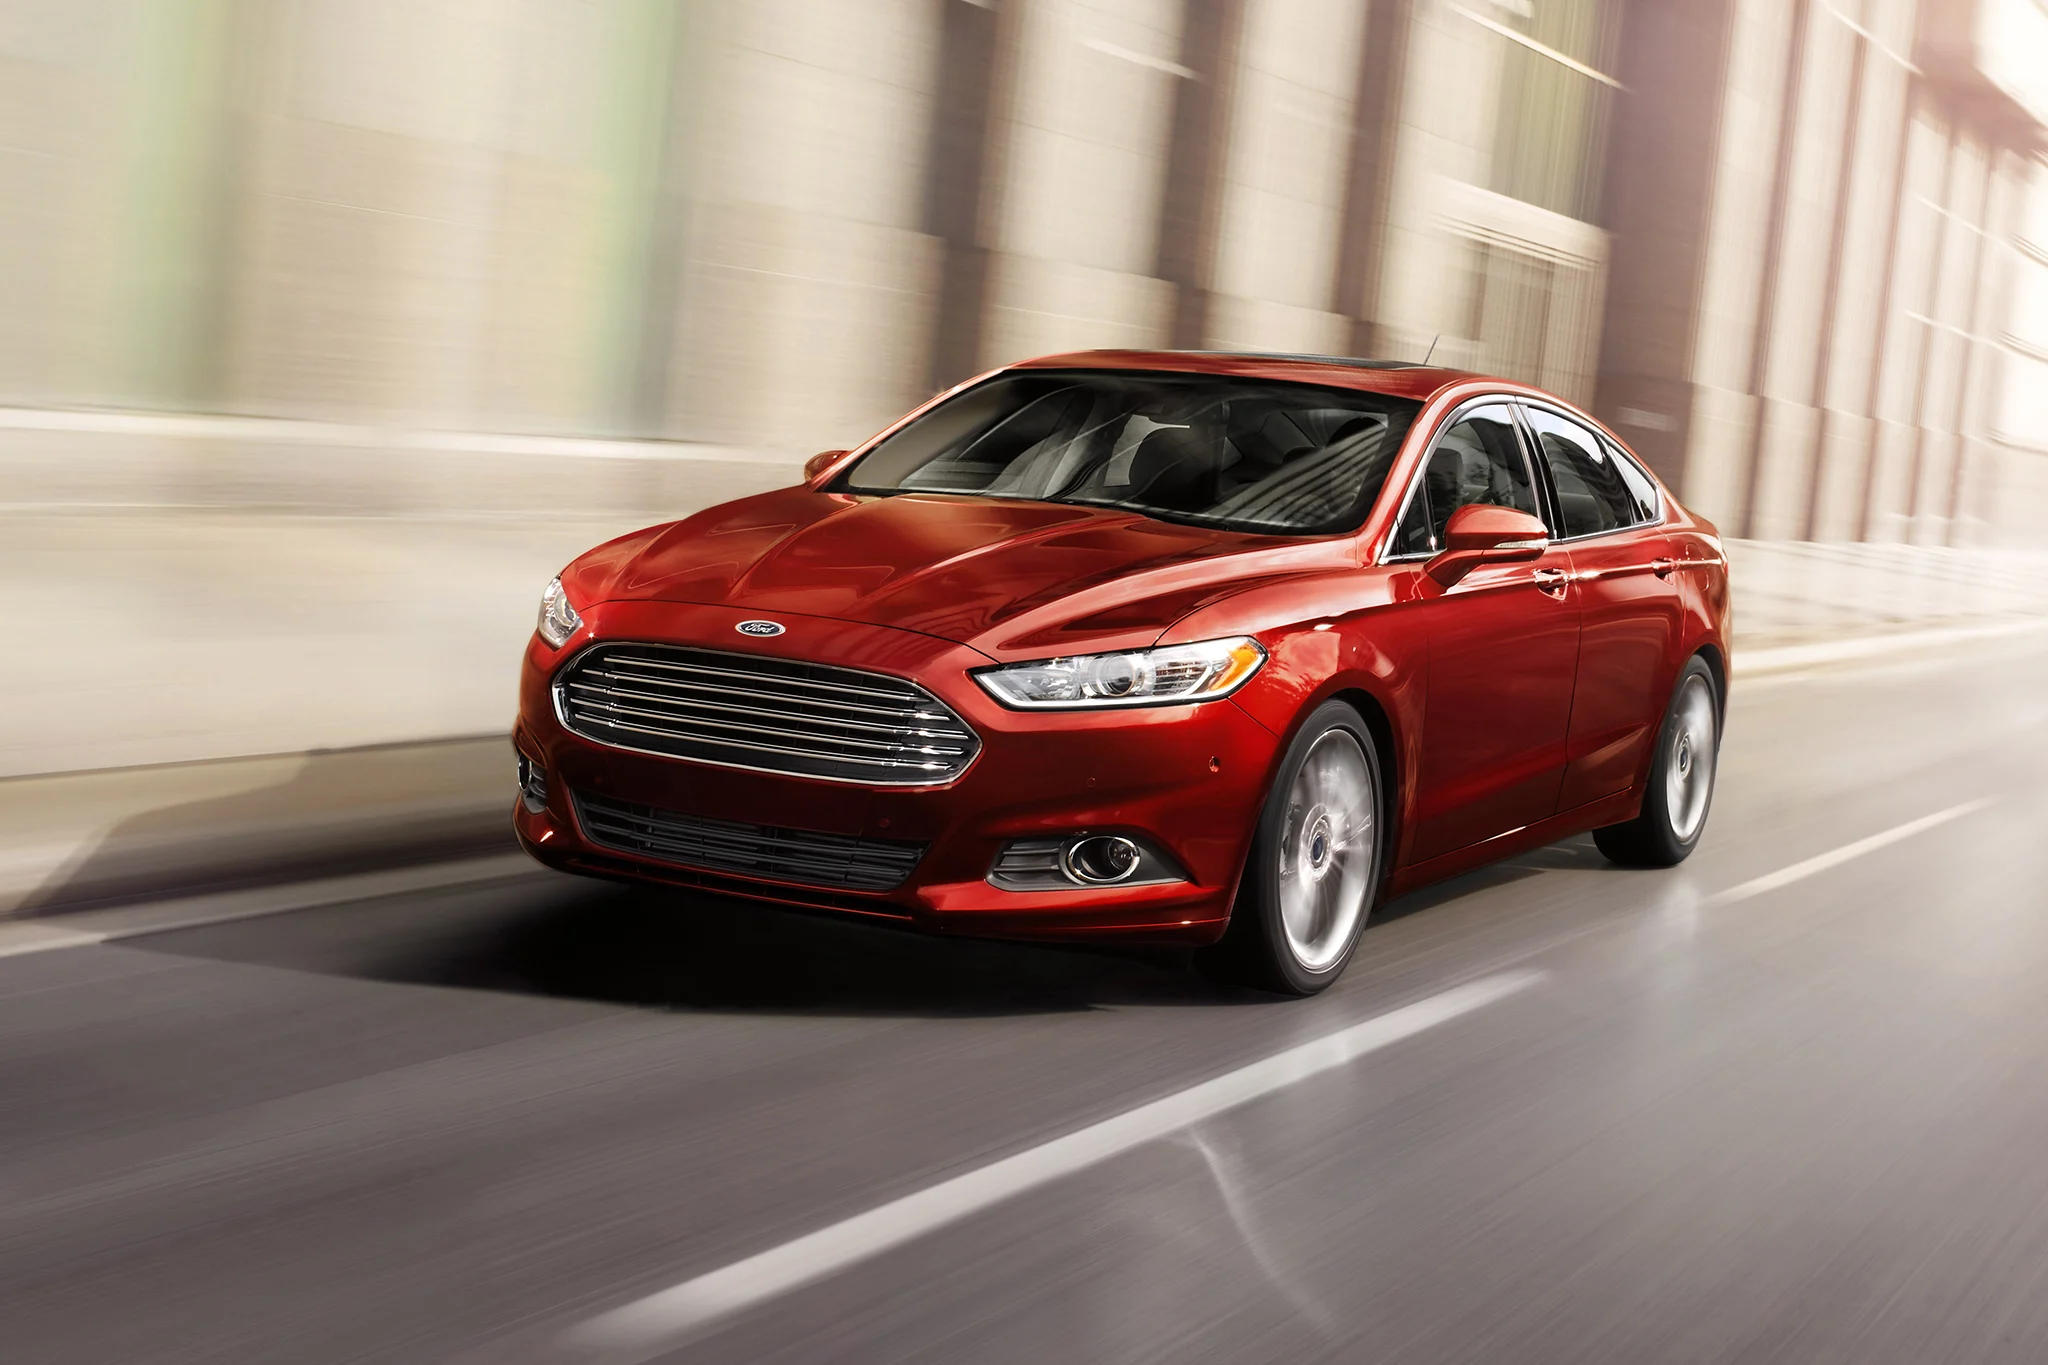
In a stagnant passenger car market, subcompacts and even smaller cars represented a growth market in Canada in 2014.
• Canada Vehicle Sales Rankings By Model – 2014 Year End
• Canada Car Sales Rankings By Model – December & 2014 Year End
![]() |
Click Chart To Expand |
Compact car sales, for example, declined 1% in 2014 despite increases from the category’s best-selling car (Canada’s best-selling car overall, the Honda Civic), and the third, fourth, fifth, and sixth-best-selling cars in the country. So great were the declines reported by the Dodge Dart, Ford Focus, Hyundai Elantra, Mitsubishi Lancer, and Toyota Matrix – and the loss of the Suzuki SX4 – that the compact car category declined, as a whole.
But subcompact volume, powered by the perennially best-selling Hyundai Accent and its best sales in four years, jumped 4% to 93,780 units. In other words, subcompacts accounted for 12% of the new cars sold in Canada in 2014, up from 11.6% in 2013.
Moreover, subcompact cars may have been slowed by the arrival of a new high-volume city car, the Nissan Micra. The Micra swallowed up 7815 sales, many of which may have otherwise gone to the Nissan Versa Note, or its prime competitor, the Mitsubishi Mirage. The Micra and Mirage combined for 11,863 sales in 2014, more than the Ford Fiesta and Mazda 2 combined.
You can click any model name in the tables below to find historical monthly and yearly Canadian auto sales data. You can also select a make and model at GCBC’s Sales Stats page. These tables are now sortable, so you can rank small cars of all kinds any which way you like. Suggestions on how GCBC should break down segments can be passed on through the Contact page.
Click Column Headers To Sort • December 2015 • January 2015 • November 2014 • December 2013
Compact
|
December
2014 |
December
2013 |
%
Change |
2014
|
2013
|
%
Change |
---|---|---|---|---|---|---|
163
|
202 | -19.3% | 2752 | 3192 | -13.8% | |
347
|
208 | 66.8% | 7161 | 5573 | 28.5% | |
2594
|
2483 | 4.5% | 34,421 | 33,184 | 3.7% | |
325
|
373 | -12.9% | 7623 | 9870 | -22.8% | |
1426
|
1043 | 36.7% | 22,392 | 25,781 | -13.1% | |
4031
|
3412 | 18.1% | 66,057 | 64,063 | 3.1% | |
2641
|
2789 | -5.3% | 50,420 | 54,760 | -7.9% | |
588
|
526 | 11.8% | 11,867 | 11,400 | 4.1% | |
2156
|
2763 | -22.0% | 40,974 | 40,466 | 1.3% | |
361
|
311 | 16.1% | 6623 | 7404 | -10.5% | |
949
|
862 | 10.1% | 15,021 | 14,407 | 4.3% | |
714
|
613 | 16.5% | 10,157 | 9911 | 2.5% | |
—
|
74 | -100% | — | 1557 | -100% | |
2409
|
2442 | -1.4% | 48,881 | 44,449 | 10.0% | |
215
|
377 | -43.0% | 7130 | 10,689 | -33.3% | |
1246
|
792 | 57.3% | 12,184 | 11,871 | 2.6% | |
1717
|
1558 | 10.2% | 31,042 | 30,413 | 2.1% | |
—
|
—
|
— | — | — | — | — |
Total
|
21,882
|
20,828 | 5.1% | 374,705 | 378,990 | -1.1% |
Subcompact
|
December
2014 |
December
2013 |
%
Change |
2014
|
2013
|
%
Change |
---|---|---|---|---|---|---|
655
|
386 | 69.7% | 8036 | 9400 | -14.5% | |
630
|
378 | 66.7% | 9312 | 9851 | -5.5% | |
898
|
1909 | -53.0% | 11,732 | 9512 | 23.3% | |
1399
|
661 | 112% | 23,173 | 18,884 | 22.7% | |
506
|
506 | 0.0% | 14,458 | 15,601 | -7.3% | |
147
|
246 | -40.2% | 2449 | 4072 | -39.9% | |
611
|
870 | -29.8% | 13,314 | 12,297 | 8.3% | |
160
|
101 | 58.4% | 2776 | 2816 | -1.4% | |
361
|
317 | 13.9% | 8530 | 7632 | 11.8% | |
—
|
—
|
— | — | — | — | — |
Total
|
5367
|
5374 | -0.1% | 93,780 | 90,065 | 4.1% |
City Car
|
December
2014 |
December
2013 |
%
Change |
2014
|
2013
|
%
Change |
---|---|---|---|---|---|---|
27
|
162 | -83.3% | 1577 | 2550 | -38.2% | |
271
|
117 | 132% | 4048 | 614 | 559% | |
828
|
— | 0.0% | 7815 | — | 0.0% | |
9
|
20 | -55.0% | 315 | 493 | -36.1% | |
205
|
164 | 25.0% | 2550 | 2237 | 14.0% | |
—
|
—
|
— | — | — | — | — |
Total
|
1340
|
463 | 189% | 16,305 | 5894 | 177% |
Warm Hatches
|
December
2014 |
December
2013 |
%
Change |
2014
|
2013
|
%
Change |
---|---|---|---|---|---|---|
Fiat 500 *
|
228
|
257 | -11.3% | 5566 | 6811 | -18.3% |
109
|
285 | -61.8% | 3444 | 4704 | -26.8% | |
360
|
375 | -4.0% | 3365 | 3946 | -14.7% | |
Scion tC *
|
48
|
79 | -39.2% | 1179 | 1485 | -20.6% |
153
|
200 | -23.5% | 2044 | 2399 | -14.8% | |
—
|
—
|
— | — | — | — | — |
Total
|
898
|
1196 | -24.9% | 15,598 | 19,345 | -19.4% |
Tall Hatchbacks & Crossovers
|
December
2014 |
December
2013 |
%
Change |
2014
|
2013
|
%
Change |
---|---|---|---|---|---|---|
647
|
292 | 122% | 5683 | 3550 | 60.1% | |
470
|
468 | 0.4% | 8533 | 7013 | 21.7% | |
—
|
— | 0.0% | — | 7 | -100% | |
203
|
56 | 263% | 2461 | 899 | 174% | |
614
|
291 | 111% | 9944 | 7618 | 30.5% | |
181
|
200 | -9.5% | 2695 | 3207 | -16.0% | |
95
|
249 | -61.8% | 2018 | 2067 | -2.4% | |
429
|
419 | 2.4% | 6594 | 7653 | -13.8% | |
—
|
6 | -100% | 15 | 183 | -91.8% | |
178
|
269 | -33.8% | 3641 | 4077 | -10.7% | |
35
|
31 | 12.9% | 651 | 808 | -19.4% | |
5
|
17 | -70.6% | 258 | 367 | -29.7% | |
349
|
462 | -24.5% | 6922 | 6115 | 13.2% | |
—
|
—
|
— | — | — | — | — |
Total
|
3206
|
2760 | 16.2% | 49,415 | 43,564 | 13.4% |
Source: Automakers & ANDC
* indicates a vehicle which is also shown in another GCBC segment breakdown.
GCBC isn’t here to break down segments, an impossible task for any group, but to display sales data for the sake of comparison. The more ways sales data can be displayed, the better. This explains why you’ll see the Encore and XV Crosstrek are listed with small SUVs, too, and the Acura ILX shown with mainstream cars is also displayed with luxury cars… because readers have wanted it both ways. You can always find the sales results for EVERY vehicle and form your own competitive sets by using the All Vehicle Rankings posts.
RECOMMENDED READING
Small Car Sales In Canada – December 2015 & Year End
Small Car Sales In Canada – January 2015
Small Car Sales In Canada – November 2014 YTD
Small Car Sales In Canada – December 2013 & Year End
Top 20 Best-Selling Cars In Canada – December 2014
Canada Auto Sales Brand Rankings – December 2014 & Year End
Midsize Car Sales In Canada – December & 2014 Year End