
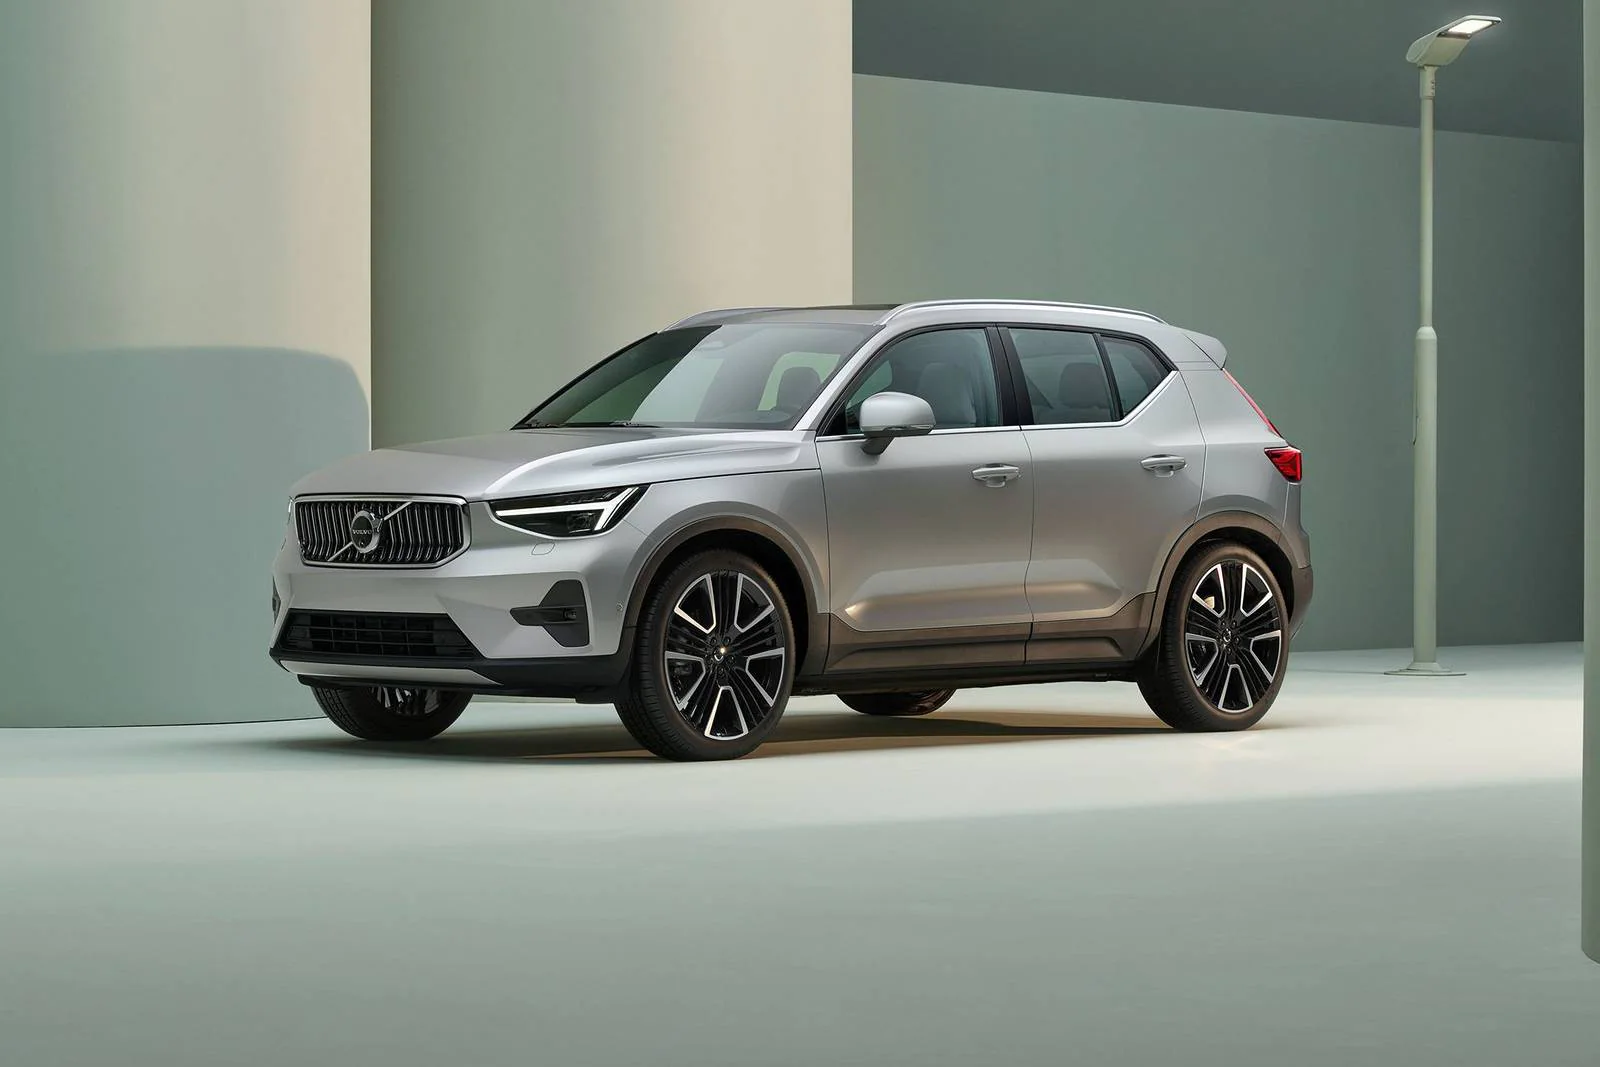
Volvo XC40
Here you will find monthly and yearly Volvo XC40 sales figures for the United States and Canada. The XC40 is Volvo’s smallest SUV, launched in 2018 on the Compact Modular Architecture platform and positioned below the XC60 and XC90. In the United States the XC40 name now covers the gasoline mild hybrid B4 and B5 models, with the battery electric version listed separately as the EX40. The XC40 competes with the Audi Q3, BMW X1, Mercedes-Benz GLA and Lexus UX.
- Class: Subcompact luxury SUV
- Engines: 2.0L turbocharged four with mild hybrid assistance, rated at up to 194 horsepower in the front-drive B4 and up to 247 horsepower in the all-wheel drive B5
- Transmission: Eight-speed automatic
- Drivetrain: Front-wheel drive on the B4, all-wheel drive on the B5
- Acceleration: 8.1 seconds to 60 mph for the B4 and 6.1 seconds for the B5
- Fuel economy: 27 mpg combined for the B4 and 26 mpg for the B5
- Trims: Core, Plus, Ultra and Black Edition, from $41,295
- Chief rivals: Audi Q3, BMW X1, Mercedes-Benz GLA, Lexus UX
Volvo XC40 Sales in the United States
The XC40 arrived in 2018 and took 12,420 units in its first year, then grew every year through 2021 to reach 26,802. A supply-constrained 2022 knocked the line back to 18,558 before the American record of 28,143 units arrived in 2023. Volume has fallen in each year since, to 26,959 in 2024 and 22,852 in 2025, a drop of about 15 percent. 2026 has been sharply weaker again: 8,863 units through June against 12,398 over the same six months of 2025, down about 29 percent, with the first quarter at 3,403 units versus 6,469. The second quarter was much closer to the prior year at 5,460 against 5,929, so most of the shortfall was concentrated in the opening months.
Volvo XC40, United States calendar-year unit sales, 2018–2026. 2026 is January–Jun (partial).
Annual sales
| Year | Units | YoY |
|---|---|---|
| 2018 | 12,420 | — |
| 2019 | 17,647 | ▲ 42.1% |
| 2020 | 23,778 | ▲ 34.7% |
| 2021 | 26,802 | ▲ 12.7% |
| 2022 | 18,558 | ▼ 30.8% |
| 2023 | 28,143 | ▲ 51.6% |
| 2024 | 26,959 | ▼ 4.2% |
| 2025 | 22,852 | ▼ 15.2% |
| 2026 (Jan–Jun) | 8,863 | ▼ 28.5% YTD |
Monthly sales
| Year | Jan | Feb | Mar | Apr | May | Jun | Jul | Aug | Sep | Oct | Nov | Dec | Total |
|---|---|---|---|---|---|---|---|---|---|---|---|---|---|
| 2018 | — | 71 | 1,001 | 1,404 | 1,105 | 1,510 | 1,521 | 1,310 | 1,104 | 1,056 | 1,022 | 1,316 | 12,420 |
| 2019 | 1,042 | 985 | 1,550 | 1,824 | 1,715 | 1,437 | 2,072 | 1,501 | 1,090 | 1,048 | 1,404 | 1,979 | 17,647 |
| 2020 | 1,303 | 1,615 | 1,052 | 930 | 2,305 | 2,315 | 2,216 | 1,933 | 1,911 | 2,504 | 2,344 | 3,350 | 23,778 |
| 2021 | 1,756 | 1,886 | 2,162 | 2,704 | 3,486 | 2,872 | 2,513 | 2,640 | 2,070 | 1,987 | 1,244 | 1,482 | 26,802 |
| 2022 | 861 | 1,530 | 1,596 | 1,312 | 1,836 | 1,686 | 955 | 1,069 | 974 | 1,908 | 2,064 | 2,767 | 18,558 |
| 2023 | 1,641 | 2,178 | 2,264 | 1,759 | 2,115 | 2,193 | 2,443 | 2,495 | 2,540 | 2,764 | 2,684 | 3,067 | 28,143 |
| 2024 | 2,096 | 1,627 | 3,593 | 2,426 | 1,764 | 1,768 | 2,761 | 2,474 | 1,715 | 2,144 | 2,000 | 2,591 | 26,959 |
| 2025 | 1,201 | 2,564 | 2,704 | 2,073 | 2,073 | 1,783 | 1,590 | 1,780 | 1,518 | 1,900 | 1,700 | 1,966 | 22,852 |
| 2026 | 817 | 1,050 | 1,536 | 1,774 | 1,930 | 1,756 | — | — | — | — | — | — | 8,863 |
Volvo XC40 Sales in Canada
Canada has taken the opposite path over the last two years. The XC40 opened at 1,252 units in 2018, reached 3,296 in 2021 and 3,866 in 2023, dipped to 3,420 in 2024, then set a Canadian record of 3,974 units in 2025, a gain of about 16 percent in a year when American volume fell. The Canadian series also runs one month ahead of the American one in our database. Through July 2026 Canada has taken 2,168 units against 2,306 over the same seven months of 2025, a decline of only about 6 percent, which leaves Canada tracking close to its record year while the United States runs well below its own.
Volvo XC40, Canada calendar-year unit sales, 2018–2026. 2026 is January–Sep (partial).
Annual sales
| Year | Units | YoY |
|---|---|---|
| 2018 | 1,252 | — |
| 2019 | 2,132 | ▲ 70.3% |
| 2020 | 2,264 | ▲ 6.2% |
| 2021 | 3,296 | ▲ 45.6% |
| 2022 | 2,833 | ▼ 14.0% |
| 2023 | 3,866 | ▲ 36.5% |
| 2024 | 3,420 | ▼ 11.5% |
| 2025 | 3,974 | ▲ 16.2% |
| 2026 (Jan–Sep) | 2,698 | ▼ 11.8% YTD |
Monthly sales
| Year | Jan | Feb | Mar | Apr | May | Jun | Jul | Aug | Sep | Oct | Nov | Dec | Total |
|---|---|---|---|---|---|---|---|---|---|---|---|---|---|
| 2018 | 22 | 20 | 24 | 151 | 141 | 119 | 182 | 171 | 158 | 111 | 51 | 102 | 1,252 |
| 2019 | 157 | 143 | 152 | 177 | 177 | 162 | 173 | 173 | 160 | 236 | 205 | 217 | 2,132 |
| 2020 | 136 | 124 | 137 | 150 | 137 | 152 | 281 | 268 | 270 | 209 | 190 | 210 | 2,264 |
| 2021 | 220 | 220 | 254 | 390 | 354 | 391 | 254 | 267 | 256 | 226 | 226 | 238 | 3,296 |
| 2022 | 176 | 168 | 194 | 235 | 235 | 247 | 234 | 269 | 246 | 276 | 276 | 277 | 2,833 |
| 2023 | 294 | 268 | 309 | 234 | 258 | 259 | 272 | 313 | 274 | 483 | 461 | 441 | 3,866 |
| 2024 | 275 | 262 | 264 | 339 | 339 | 310 | 261 | 261 | 240 | 312 | 271 | 286 | 3,420 |
| 2025 | 268 | 244 | 258 | 392 | 375 | 376 | 393 | 375 | 377 | 329 | 271 | 316 | 3,974 |
| 2026 | 199 | 230 | 298 | 302 | 359 | 359 | 421 | 277 | 253 | — | — | — | 2,698 |







