2022 European Automotive Sales by Brand – The Best-Selling Automotive Brands By Sales Volume
The overall European auto market in 2022 was down 4.1% from the previous year, due to a number of factors, including the ongoing COVID-19 pandemic, the war in Ukraine, and supply chain disruptions. However, there were a few bright spots, such as the electric vehicle market, which grew by 20% in 2022.
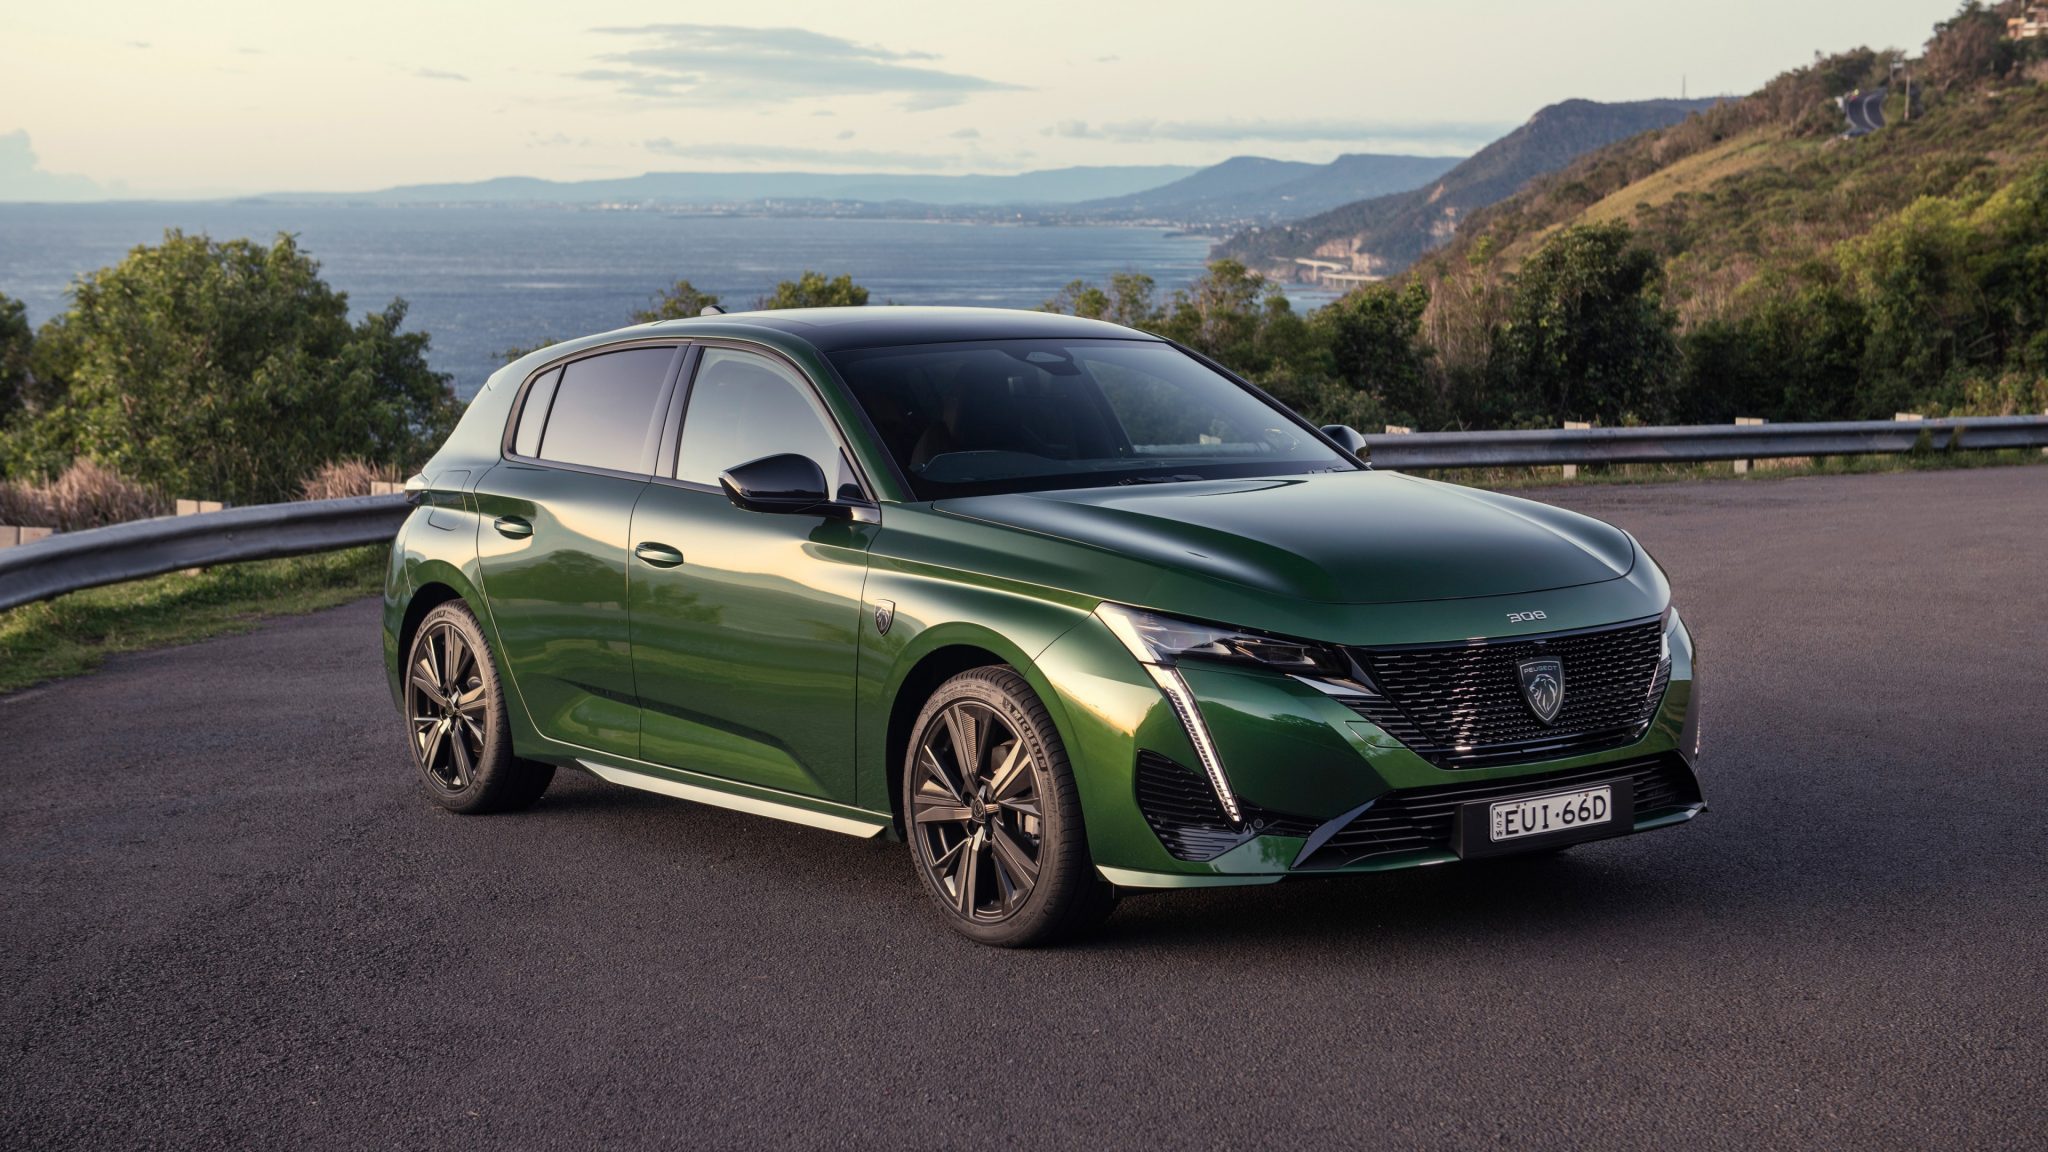
The best-selling auto brands in Europe in 2022 were Peugeot, Dacia, Volkswagen, Fiat, Toyota, Renault, BMW, Mercedes-Benz, Ford and Audi. These ten brands accounted for over 50% of all new car sales in Europe in 2022. The Peugeot 208 was the best-selling car model in Europe in 2022, followed by the Dacia Sandero and the Volkswagen T-Roc. The popularity of these brands and models is due to a number of factors, including their affordability, fuel efficiency, reliability, and safety features.
2022 Best Selling Car Brands In Europe
This data table looks at last month’s total automotive brand volumes in Europe by model. We compare European automotive brand sales with last year. With these sales numbers we also calculate a growth rate column so you can better gauge an individual automotive brands sales success in the Canadian market.
| Brand | Month | LY | Change | YTD | YTD Last Year | YTD Change | Month Share | YTD Share |
|---|---|---|---|---|---|---|---|---|
| Aiways | 1,237 | 996 | 24.20 | 1,237 | 996 | 24.20 | 0.08 | 0.01 |
| Alfa Romeo | 32,850 | 25,933 | 26.67 | 32,850 | 25,933 | 26.67 | 2.05 | 0.19 |
| Alpine | 3,269 | 2,427 | 34.69 | 3,269 | 2,427 | 34.69 | 0.20 | 0.02 |
| Aston Martin | 1,968 | 1,944 | 1.23 | 1,968 | 1,944 | 1.23 | 0.12 | 0.01 |
| Audi | 569,448 | 592,531 | -3.90 | 569,448 | 592,531 | -3.90 | 35.46 | 3.30 |
| Bentley | 3,752 | 2,857 | 31.33 | 3,752 | 2,857 | 31.33 | 0.23 | 0.02 |
| BMW | 592,145 | 654,232 | -9.49 | 592,145 | 654,232 | -9.49 | 36.87 | 3.43 |
| BYD | 4,083 | 1,068 | 282.30 | 4,083 | 1,068 | 282.30 | 0.25 | 0.02 |
| Cadillac | 684 | 496 | 37.90 | 684 | 496 | 37.90 | 0.04 | 0.00 |
| Chevrolet | 789 | 499 | 58.12 | 789 | 499 | 58.12 | 0.05 | 0.00 |
| Chrysler | 103 | 94 | 9.57 | 103 | 94 | 9.57 | 0.01 | 0.00 |
| Citroen | 365,667 | 451,676 | -19.04 | 365,667 | 451,676 | -19.04 | 22.77 | 2.12 |
| Dacia | 467,700 | 403,469 | 15.92 | 467,700 | 403,469 | 15.92 | 29.12 | 2.71 |
| Dodge | 809 | 956 | -15.38 | 809 | 956 | -15.38 | 0.05 | 0.00 |
| DR Motor | 21,736 | 5,194 | 318.48 | 21,736 | 5,194 | 318.48 | 1.35 | 0.13 |
| DS | 49,510 | 43,970 | 12.60 | 49,510 | 43,970 | 12.60 | 3.08 | 0.29 |
| Ferrari | 4,737 | 5,441 | -12.94 | 4,737 | 5,441 | -12.94 | 0.29 | 0.03 |
| Fiat | 222,722 | 544,054 | -59.06 | 222,722 | 544,054 | -59.06 | 13.87 | 1.29 |
| Ford | 544,497 | 584,614 | -6.86 | 544,497 | 584,614 | -6.86 | 33.90 | 3.16 |
| Genesis | 2,825 | 405 | 597.53 | 2,825 | 405 | 597.53 | 0.18 | 0.02 |
| Haval | 40 | 0 | 0.00 | 40 | 0 | 0.00 | 0.00 | 0.00 |
| Honda | 65,947 | 62,235 | 5.96 | 65,947 | 62,235 | 5.96 | 4.11 | 0.38 |
| Hongqi | 2,090 | 0 | 0.00 | 2,090 | 0 | 0.00 | 0.13 | 0.01 |
| Hyundai | 504,945 | 420,940 | 19.96 | 504,945 | 420,940 | 19.96 | 31.44 | 2.93 |
| JAC | 50 | 127 | -60.63 | 50 | 127 | -60.63 | 0.00 | 0.00 |
| Jaguar | 23,923 | 37,548 | -36.29 | 23,923 | 37,548 | -36.29 | 1.49 | 0.14 |
| Jeep | 104,061 | 127,315 | -18.26 | 104,061 | 127,315 | -18.26 | 6.48 | 0.60 |
| Kia | 512,701 | 482,748 | 6.20 | 512,701 | 482,748 | 6.20 | 31.92 | 2.97 |
| Lada | 801 | 1,386 | -42.21 | 801 | 1,386 | -42.21 | 0.05 | 0.00 |
| Lamborghini | 2,538 | 2,157 | 17.66 | 2,538 | 2,157 | 17.66 | 0.16 | 0.01 |
| Lancia | 41,018 | 87,724 | -53.24 | 41,018 | 87,724 | -53.24 | 2.55 | 0.24 |
| Land Rover | 85,848 | 97,128 | -11.61 | 85,848 | 97,128 | -11.61 | 5.35 | 0.50 |
| Leapmotor | 0 | 0 | 0.00 | 0 | 0 | 0.00 | 0.00 | 0.00 |
| Lexus | 38,366 | 46,250 | -17.05 | 38,366 | 46,250 | -17.05 | 2.39 | 0.22 |
| Lotus | 367 | 634 | -42.11 | 367 | 634 | -42.11 | 0.02 | 0.00 |
| Lucid | 15 | 0 | 0.00 | 15 | 0 | 0.00 | 0.00 | 0.00 |
| Lynk and Co | 26,396 | 7,917 | 233.41 | 26,396 | 7,917 | 233.41 | 1.64 | 0.15 |
| Mahindra | 773 | 0 | 0.00 | 773 | 0 | 0.00 | 0.05 | 0.00 |
| Maserati | 6,330 | 1,779 | 255.82 | 6,330 | 1,779 | 255.82 | 0.39 | 0.04 |
| Maxus | 1,463 | 5,424 | -73.03 | 1,463 | 5,424 | -73.03 | 0.09 | 0.01 |
| Mazda | 137,561 | 176,197 | -21.93 | 137,561 | 176,197 | -21.93 | 8.57 | 0.80 |
| McLaren | 373 | 0 | 0.00 | 373 | 0 | 0.00 | 0.02 | 0.00 |
| Mercedes-Benz | 642,015 | 580,499 | 10.60 | 642,015 | 580,499 | 10.60 | 39.98 | 3.72 |
| MG | 96,527 | 37,168 | 159.70 | 96,527 | 37,168 | 159.70 | 6.01 | 0.56 |
| Mini | 170,488 | 58,887 | 189.52 | 170,488 | 58,887 | 189.52 | 10.62 | 0.99 |
| Mitsubishi | 56,297 | 80,262 | -29.86 | 56,297 | 80,262 | -29.86 | 3.51 | 0.33 |
| NIO | 1,350 | 200 | 575.00 | 1,350 | 200 | 575.00 | 0.08 | 0.01 |
| Nissan | 233,755 | 292,717 | -20.14 | 233,755 | 292,717 | -20.14 | 14.56 | 1.36 |
| Opel | 425,220 | 431,303 | -1.41 | 425,220 | 431,303 | -1.41 | 26.48 | 2.47 |
| Peugeot | 614,506 | 727,841 | -15.57 | 614,506 | 727,841 | -15.57 | 38.26 | 3.56 |
| Polestar | 31,940 | 8,807 | 262.67 | 31,940 | 8,807 | 262.67 | 1.99 | 0.19 |
| Porsche | 86,311 | 74,786 | 15.41 | 86,311 | 74,786 | 15.41 | 5.37 | 0.50 |
| Renault | 575,946 | 685,989 | -16.04 | 575,946 | 685,989 | -16.04 | 35.86 | 3.34 |
| Rolls Royce | 912 | 613 | 48.78 | 912 | 613 | 48.78 | 0.06 | 0.01 |
| Seat | 223,006 | 349,105 | -36.12 | 223,006 | 349,105 | -36.12 | 13.89 | 1.29 |
| Seres | 809 | 0 | 0.00 | 809 | 0 | 0.00 | 0.05 | 0.00 |
| Skoda | 523,792 | 552,996 | -5.28 | 523,792 | 552,996 | -5.28 | 32.62 | 3.04 |
| Smart | 21,193 | 35,692 | -40.62 | 21,193 | 35,692 | -40.62 | 1.32 | 0.12 |
| Soueast | 15,565 | 4,906 | 217.26 | 15,565 | 4,906 | 217.26 | 0.97 | 0.09 |
| Subaru | 11,077 | 27,608 | -59.88 | 11,077 | 27,608 | -59.88 | 0.69 | 0.06 |
| Suzuki | 128,841 | 131,705 | -2.17 | 128,841 | 131,705 | -2.17 | 8.02 | 0.75 |
| SWM Motor | 49 | 6,073 | -99.19 | 49 | 6,073 | -99.19 | 0.00 | 0.00 |
| Tesla | 232,066 | 170,507 | 36.10 | 232,066 | 170,507 | 36.10 | 14.45 | 1.35 |
| Toyota | 485,561 | 653,622 | -25.71 | 610,710 | 653,622 | -6.57 | 30.23 | 3.54 |
| Volkswagen | 1,010,272 | 1,028,089 | -1.73 | 1,010,272 | 1,028,089 | -1.73 | 62.91 | 5.86 |
| Volvo | 242,939 | 247,517 | -1.85 | 242,939 | 247,517 | -1.85 | 15.13 | 1.41 |
| Voyah | 396 | 0 | 0.00 | 396 | 0 | 0.00 | 0.02 | 0.00 |
| XPeng | 722 | 7,905 | -90.87 | 722 | 7,905 | -90.87 | 0.04 | 0.00 |
| ∑ = 10,277,692 | ∑ = 11,075,162 | ∑ = 10,402,841 | ∑ = 11,075,162 |
2022 Auto Brand Market Share Dynamics in Europe
This data table looks at total automotive sales and specific brand volumes in Europe. We compare European automotive brand sales with last year. You can see the market share breakout visually for all the automotive brands selling in Europe.
2022 vs 2021 Auto Brand Sales in Europe
This chart simply takes each brand and compares their year to date sales with the year to date sales for the same time last year. Brands where the current bar is lower than the prior year bar have seen declines in sales year on year whereas brands with a larger current bar and lower prior bar are seeing growth in volumes year on year.
2022 Automotive Brand Sales Analysis
This chart might seem a little complicated at first but once you understand it is very helpful. First, the size of the area for each brand refers to their market share (i.e size). The bigger the circle the larger the brand in terms of sales volumes (YTD). The position of the circle in the chart along the left axis looks at the year to date growth of that brand. The higher the brand is on the chart, the more year to date growth it is seeing in sales volumes. Along the bottom axis you can see the total volumes shipped by that brand year to date.
European car sales statistics are from the following countries: Austria, Belgium, Bulgaria, Croatia, Cyprus, Czech Republic, Denmark, Estonia, Finland, France, Germany, Greece, Hungary, Iceland, Ireland, Italy, Latvia, Lithuania, Luxembourg, Netherlands, Norway, Poland, Portugal, Romania, Slovakia, Slovenia, Spain, Sweden, Switzerland, United Kingdom. They exclude vehicles registered as commercial vehicles.
Source: ANDC, JATO Dynamics