2022 Chinese Automotive Sales by Brand – The Best-Selling Automotive Brands By Sales Volume
The best-selling automotive brands in China for 2022 were Wuling (SAIC-GM-Wuling), Tesla, BYD Auto, Volkswagen, Geely, SAIC-GM, GAC Toyota, Dongfeng Nissan, Changan Automobile and Chery Automobile. These ten brands accounted for over 60% of all new car sales in China in 2022.
Wuling remained the best-selling automotive brand in China in 2022, thanks to its popular Hongguang MINIEV microcar. Tesla was in second place, followed by BYD Auto, Volkswagen, and Geely. The popularity of these brands and models is due to a number of factors, including their affordability, fuel efficiency, reliability, and safety features. The popularity of these brands reflects the current trends in the Chinese auto market. Electric vehicles are becoming increasingly popular in China, and consumers are looking for vehicles that are affordable, fuel-efficient, and reliable.
Please note these figures are factory shipments for locally produced models only, they exclude imported cars, which make up only a small portion (around 5%) of sales in China. Locally produced cars which are exported from China are included.
2022 Best Selling Car Brands In China
This data table looks at last month’s total automotive brand volumes in China by brand. We compare Chinese automotive brand sales with last year. With these sales numbers we also calculate a growth rate column so you can better gauge an individual automotive brands sales success in the Canadian market.
| Brand | Month | LY | Change | YTD | YTD Last Year | YTD Change | Month Share | YTD Share |
|---|---|---|---|---|---|---|---|---|
| Acura | 1,897 | 5,762 | -67.08 | 1,897 | 5,762 | -67.08 | 0.12 | 0.01 |
| Aion | 271,156 | 120,155 | 125.67 | 271,156 | 120,155 | 125.67 | 16.88 | 1.57 |
| Aito | 78,081 | 352 | 22,082.10 | 78,081 | 352 | 22,082.10 | 4.86 | 0.45 |
| Aiways | 2,404 | 3,011 | -20.16 | 2,404 | 3,011 | -20.16 | 0.15 | 0.01 |
| Audi | 584,028 | 532,247 | 9.73 | 584,028 | 532,247 | 9.73 | 36.37 | 3.39 |
| Baojun | 104,624 | 221,695 | -52.81 | 104,624 | 221,695 | -52.81 | 6.51 | 0.61 |
| BAW | 33,958 | 27,362 | 24.11 | 33,958 | 27,362 | 24.11 | 2.11 | 0.20 |
| Bestune | 36,501 | 47,624 | -23.36 | 36,501 | 47,624 | -23.36 | 2.27 | 0.21 |
| BMW | 618,021 | 629,554 | -1.83 | 618,021 | 629,554 | -1.83 | 38.48 | 3.58 |
| Buick | 653,122 | 828,432 | -21.16 | 653,122 | 828,432 | -21.16 | 40.67 | 3.79 |
| BYD | 1,795,459 | 784,297 | 128.93 | 1,795,459 | 784,297 | 128.93 | 111.80 | 10.41 |
| Cadillac | 185,174 | 233,119 | -20.57 | 185,174 | 233,119 | -20.57 | 11.53 | 1.07 |
| Changan | 1,083,758 | 998,836 | 8.50 | 1,083,758 | 998,836 | 8.50 | 67.48 | 6.29 |
| Changhe | 60 | 385 | -84.42 | 60 | 385 | -84.42 | 0.00 | 0.00 |
| Chery | 716,786 | 710,151 | 0.93 | 716,786 | 710,151 | 0.93 | 44.63 | 4.16 |
| Chevrolet | 222,965 | 181,006 | 23.18 | 222,965 | 181,006 | 23.18 | 13.88 | 1.29 |
| Citroen | 53,784 | 41,662 | 29.10 | 53,784 | 41,662 | 29.10 | 3.35 | 0.31 |
| COS | 167,591 | 194,381 | -13.78 | 167,591 | 194,381 | -13.78 | 10.44 | 0.97 |
| Dayun | 18,725 | 2,753 | 580.17 | 18,725 | 2,753 | 580.17 | 1.17 | 0.11 |
| Denza | 9,978 | 4,783 | 108.61 | 9,978 | 4,783 | 108.61 | 0.62 | 0.06 |
| Dongfeng | 425,613 | 335,517 | 26.85 | 425,613 | 335,517 | 26.85 | 26.50 | 2.47 |
| DS | 1,373 | 1,853 | -25.90 | 1,373 | 1,853 | -25.90 | 0.09 | 0.01 |
| Everus | 2,871 | 5,026 | -42.88 | 2,871 | 5,026 | -42.88 | 0.18 | 0.02 |
| FAW | 30,938 | 20,343 | 52.08 | 30,938 | 20,343 | 52.08 | 1.93 | 0.18 |
| Ford | 219,248 | 256,426 | -14.50 | 219,248 | 256,426 | -14.50 | 13.65 | 1.27 |
| Foton | 5,701 | 9,736 | -41.44 | 5,701 | 9,736 | -41.44 | 0.35 | 0.03 |
| Geely | 895,907 | 1,100,641 | -18.60 | 895,907 | 1,100,641 | -18.60 | 55.79 | 5.20 |
| Geometry | 112,101 | 23,075 | 385.81 | 112,101 | 23,075 | 385.81 | 6.98 | 0.65 |
| Haima | 10,611 | 13,311 | -20.28 | 10,611 | 13,311 | -20.28 | 0.66 | 0.06 |
| Haval | 545,482 | 681,869 | -20.00 | 545,482 | 681,869 | -20.00 | 33.97 | 3.16 |
| Honda | 1,393,287 | 1,542,227 | -9.66 | 1,393,287 | 1,542,227 | -9.66 | 86.76 | 8.08 |
| Hongqi | 296,344 | 300,661 | -1.44 | 296,344 | 300,661 | -1.44 | 18.45 | 1.72 |
| Hyundai | 246,539 | 402,088 | -38.69 | 246,539 | 402,088 | -38.69 | 15.35 | 1.43 |
| Infiniti | 5,669 | 8,696 | -34.81 | 5,669 | 8,696 | -34.81 | 0.35 | 0.03 |
| JAC | 15,541 | 33,539 | -53.66 | 15,541 | 33,539 | -53.66 | 0.97 | 0.09 |
| Jaguar | 21,292 | 19,232 | 10.71 | 21,292 | 19,232 | 10.71 | 1.33 | 0.12 |
| Jeep | 2,793 | 20,357 | -86.28 | 2,793 | 20,357 | -86.28 | 0.17 | 0.02 |
| Jetour | 145,882 | 154,077 | -5.32 | 145,882 | 154,077 | -5.32 | 9.08 | 0.85 |
| Jetta | 146,280 | 220,381 | -33.62 | 146,280 | 220,381 | -33.62 | 9.11 | 0.85 |
| JMC | 5,420 | 3,078 | 76.09 | 5,420 | 3,078 | 76.09 | 0.34 | 0.03 |
| Karry | 1,488 | 2,587 | -42.48 | 1,488 | 2,587 | -42.48 | 0.09 | 0.01 |
| Kia | 110,987 | 150,126 | -26.07 | 110,987 | 150,126 | -26.07 | 6.91 | 0.64 |
| Land Rover | 29,543 | 36,389 | -18.81 | 29,543 | 36,389 | -18.81 | 1.84 | 0.17 |
| Leading Ideal | 157,992 | 0 | 0.00 | 157,992 | 0 | 0.00 | 9.84 | 0.92 |
| Leapmotor | 111,168 | 44,906 | 147.56 | 111,168 | 44,906 | 147.56 | 6.92 | 0.64 |
| Lincoln | 69,027 | 14,256 | 384.20 | 69,027 | 14,256 | 384.20 | 4.30 | 0.40 |
| Lingbao | 34,190 | 24,977 | 36.89 | 34,190 | 24,977 | 36.89 | 2.13 | 0.20 |
| Lynk and Co | 170,072 | 221,878 | -23.35 | 170,072 | 221,878 | -23.35 | 10.59 | 0.99 |
| Maple | 51,866 | 8,283 | 526.17 | 51,866 | 8,283 | 526.17 | 3.23 | 0.30 |
| Maxus | 34,899 | 55,879 | -37.55 | 34,899 | 55,879 | -37.55 | 2.17 | 0.20 |
| Mazda | 92,748 | 61,486 | 50.84 | 92,748 | 61,486 | 50.84 | 5.78 | 0.54 |
| Mercedes-Benz | 615,356 | 341,036 | 80.44 | 615,356 | 341,036 | 80.44 | 38.32 | 3.57 |
| MG | 253,246 | 535,896 | -52.74 | 253,246 | 535,896 | -52.74 | 15.77 | 1.47 |
| Mitsubishi | 35,299 | 71,344 | -50.52 | 35,299 | 71,344 | -50.52 | 2.20 | 0.20 |
| Neta | 147,838 | 69,674 | 112.19 | 147,838 | 69,674 | 112.19 | 9.21 | 0.86 |
| NIO | 122,485 | 91,429 | 33.97 | 122,485 | 91,429 | 33.97 | 7.63 | 0.71 |
| Nissan | 821,161 | 1,006,584 | -18.42 | 821,161 | 1,006,584 | -18.42 | 51.13 | 4.76 |
| Ora | 83,995 | 135,028 | -37.79 | 83,995 | 135,028 | -37.79 | 5.23 | 0.49 |
| Peugeot | 57,764 | 51,056 | 13.14 | 57,764 | 51,056 | 13.14 | 3.60 | 0.34 |
| Roewe | 299,119 | 368,716 | -18.88 | 299,119 | 368,716 | -18.88 | 18.63 | 1.74 |
| Sehol | 47,033 | 27,391 | 71.71 | 47,033 | 27,391 | 71.71 | 2.93 | 0.27 |
| Seres | 48 | 8,257 | -99.42 | 48 | 8,257 | -99.42 | 0.00 | 0.00 |
| Skoda | 44,062 | 56,000 | -21.32 | 44,062 | 56,000 | -21.32 | 2.74 | 0.26 |
| Skyworth | 16,118 | 4,088 | 294.28 | 16,118 | 4,088 | 294.28 | 1.00 | 0.09 |
| Sol | 46,236 | 93,259 | -50.42 | 46,236 | 93,259 | -50.42 | 2.88 | 0.27 |
| Soueast | 5,390 | 8,426 | -36.03 | 5,390 | 8,426 | -36.03 | 0.34 | 0.03 |
| Suzuki | 10,468 | 10,818 | -3.24 | 10,468 | 10,818 | -3.24 | 0.65 | 0.06 |
| SWM Motor | 32,323 | 30,506 | 5.96 | 32,323 | 30,506 | 5.96 | 2.01 | 0.19 |
| Tank | 122,993 | 84,588 | 45.40 | 122,993 | 84,588 | 45.40 | 7.66 | 0.71 |
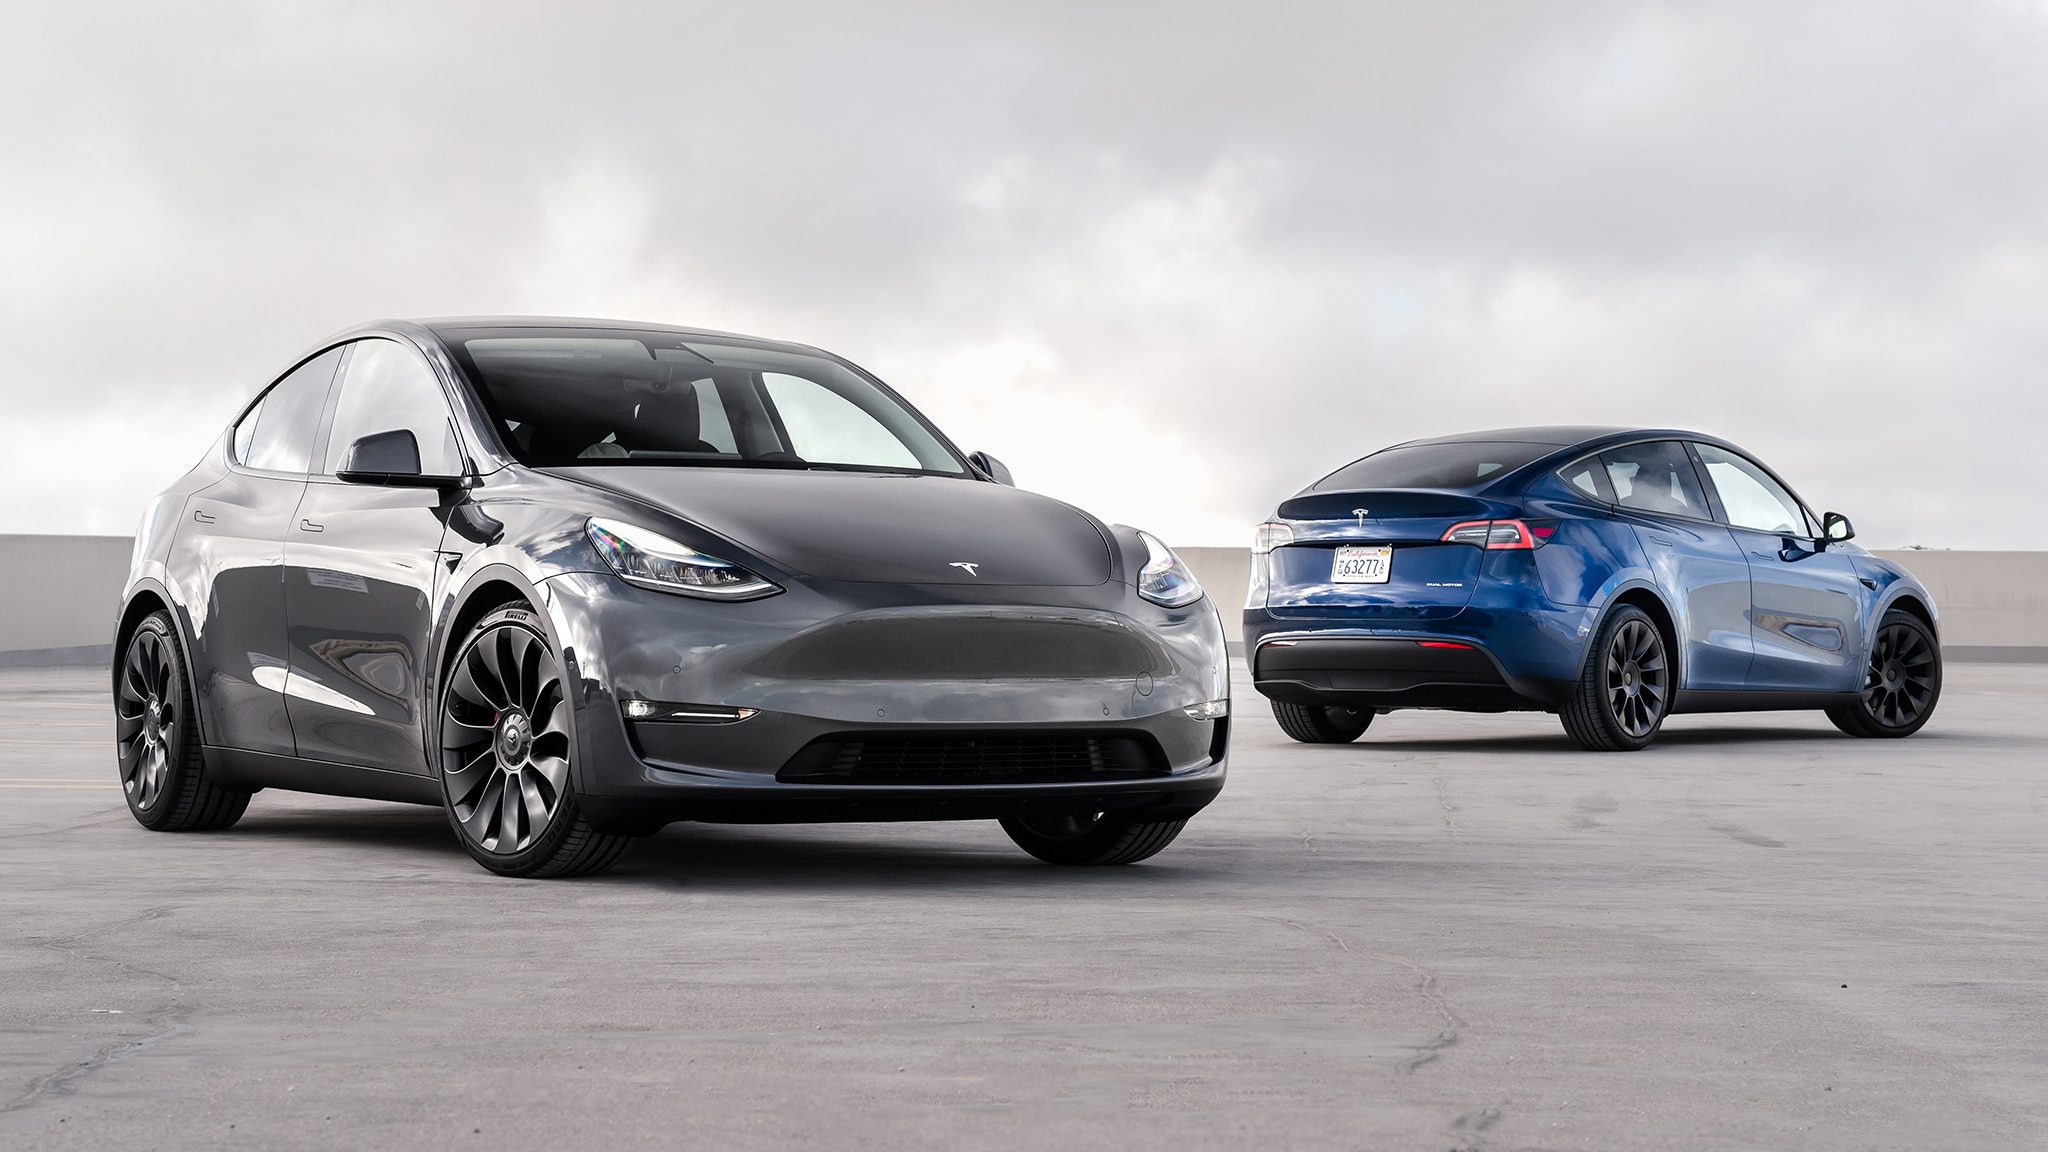
| Tesla | 555,740 | 473,103 | 17.47 | 555,740 | 473,103 | 17.47 | 34.60 | 3.22 |
| Toyota | 1,563,599 | 1,807,545 | -13.50 | 1,824,024 | 1,807,545 | 0.91 | 97.36 | 10.58 |
| Trumpchi | 342,750 | 320,340 | 7.00 | 342,750 | 320,340 | 7.00 | 21.34 | 1.99 |
| Venucia | 59,195 | 79,928 | -25.94 | 59,195 | 79,928 | -25.94 | 3.69 | 0.34 |
| VGV | 7,417 | 11,660 | -36.39 | 7,417 | 11,660 | -36.39 | 0.46 | 0.04 |
| Volkswagen | 2,201,195 | 2,074,562 | 6.10 | 2,201,195 | 2,074,562 | 6.10 | 137.06 | 12.77 |
| Volvo | 145,294 | 112,892 | 28.70 | 145,294 | 112,892 | 28.70 | 9.05 | 0.84 |
| Voyah | 19,387 | 6,431 | 201.46 | 19,387 | 6,431 | 201.46 | 1.21 | 0.11 |
| Weltmeister | 26,296 | 44,157 | -40.45 | 26,296 | 44,157 | -40.45 | 1.64 | 0.15 |
| Wey | 35,953 | 58,363 | -38.40 | 35,953 | 58,363 | -38.40 | 2.24 | 0.21 |
| Wuling | 724,841 | 818,041 | -11.39 | 724,841 | 818,041 | -11.39 | 45.13 | 4.20 |
| XPeng | 120,757 | 30,159 | 300.40 | 120,757 | 30,159 | 300.40 | 7.52 | 0.70 |
| Yema | 11,445 | 14,942 | -23.40 | 11,445 | 14,942 | -23.40 | 0.71 | 0.07 |
| Zedriv | 105 | 1,780 | -94.10 | 105 | 1,780 | -94.10 | 0.01 | 0.00 |
| Zeekr | 71,941 | 6,007 | 1,097.62 | 71,941 | 6,007 | 1,097.62 | 4.48 | 0.42 |
| ∑ = 20,677,793 | ∑ = 20,194,473 | ∑ = 20,938,218 | ∑ = 20,194,473 |
2022 Auto Brand Market Share Dynamics in China
This data table looks at total automotive sales and specific brand volumes in China. We compare Chinese automotive brand sales with last year. You can see the market share breakout visually for all the automotive brands selling in China.
2022 vs 2021 Auto Brand Sales in China
This chart simply takes each brand and compares their year to date sales with the year to date sales for the same time last year. Brands where the current bar is lower than the prior year bar have seen declines in sales year on year whereas brands with a larger current bar and lower prior bar are seeing growth in volumes year on year.
2022 Automotive Brand Sales Analysis in China
This chart might seem a little complicated at first but once you understand it is very helpful. First, the size of the area for each brand refers to their market share (i.e size). The bigger the circle the larger the brand in terms of sales volumes (YTD). The position of the circle in the chart along the left axis looks at the year to date growth of that brand. The higher the brand is on the chart, the more year to date growth it is seeing in sales volumes. Along the bottom axis you can see the total volumes shipped by that brand year to date.
Sources: Manufacturers, Chooseauto