
The Top-Selling Vehicles in the U.S Automotive Market for 2019
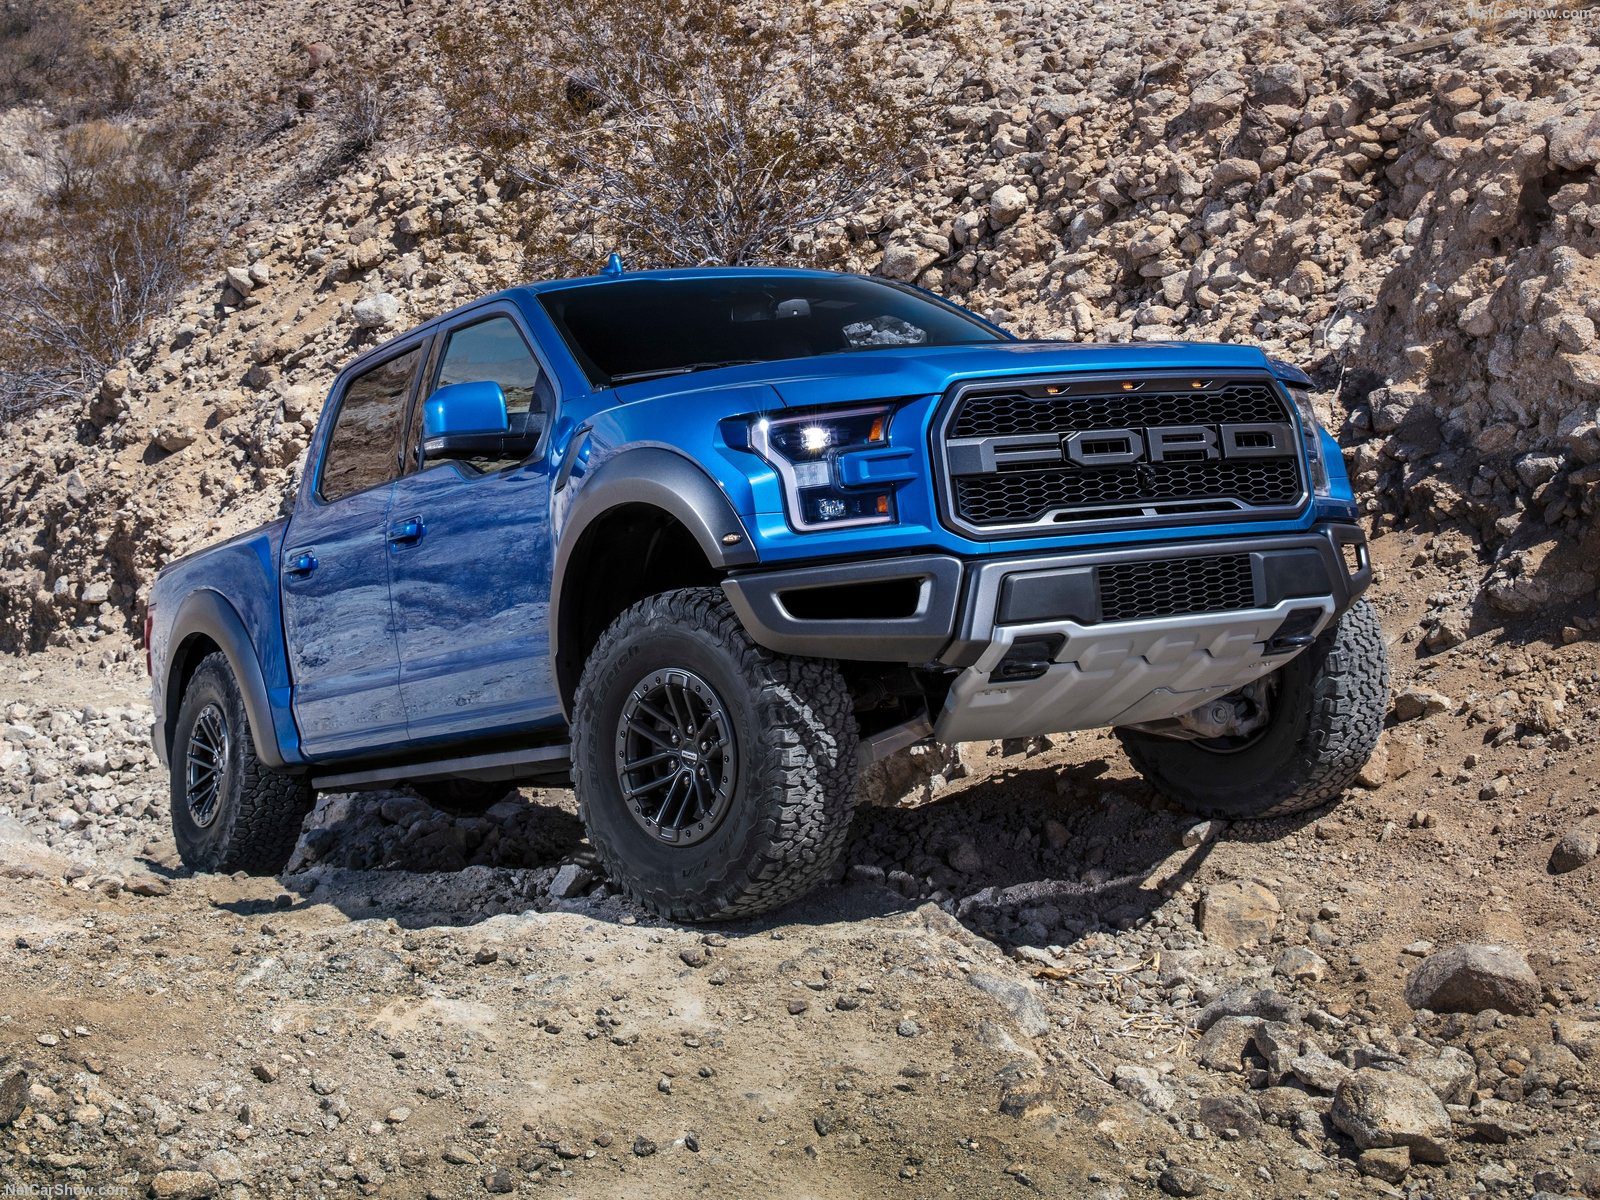
The best-selling car in America in 2019 was the Ford F-Series pickup truck. The Ford F-Series has been the top-selling vehicle in the United States for several years, and 2019 was no exception. The F-Series includes popular models such as the F-150, F-250, and F-350.
The F-Series has a long-standing reputation for its durability, capability, and versatility, making it a popular choice among American consumers. It offers a range of configurations, including different bed lengths, cab sizes, and engine options, allowing buyers to choose the truck that best suits their needs.
In 2019, the Ford F-Series sold over 896,000 units, solidifying its position as the best-selling vehicle in the country. The F-Series has consistently dominated the pickup truck market and has even outsold many popular passenger cars, showcasing the strong demand for trucks in the American automotive market.
The success of the Ford F-Series can be attributed to factors such as its powerful engines, towing and hauling capabilities, advanced technology features, and a reputation for reliability. Additionally, Ford’s extensive dealership network and marketing efforts have contributed to its widespread popularity. It’s worth noting that the best-selling car overall in the United States in 2019 was the Toyota Camry, a midsize sedan. However, when considering all vehicle types, including trucks and SUVs, the Ford F-Series emerged as the top-selling vehicle, highlighting the American preference for larger, more versatile vehicles.
Top 20 Best Selling Vehicles (All Segments) in the U.S for 2019
TABLE COMING SOON
CHART COMING SOON
Top 10 Best Selling Passenger Cars in the U.S for 2019
TABLE COMING SOON
CHART COMING SOON
Top 10 Best Selling SUVs in the U.S for 2019
TABLE COMING SOON
CHART COMING SOON
Top 10 Best Selling Minivans in the U.S for 2019
TABLE COMING SOON
CHART COMING SOON
Top 10 Best Selling Pickup Trucks in the U.S for 2019
TABLE COMING SOON
CHART COMING SOON


