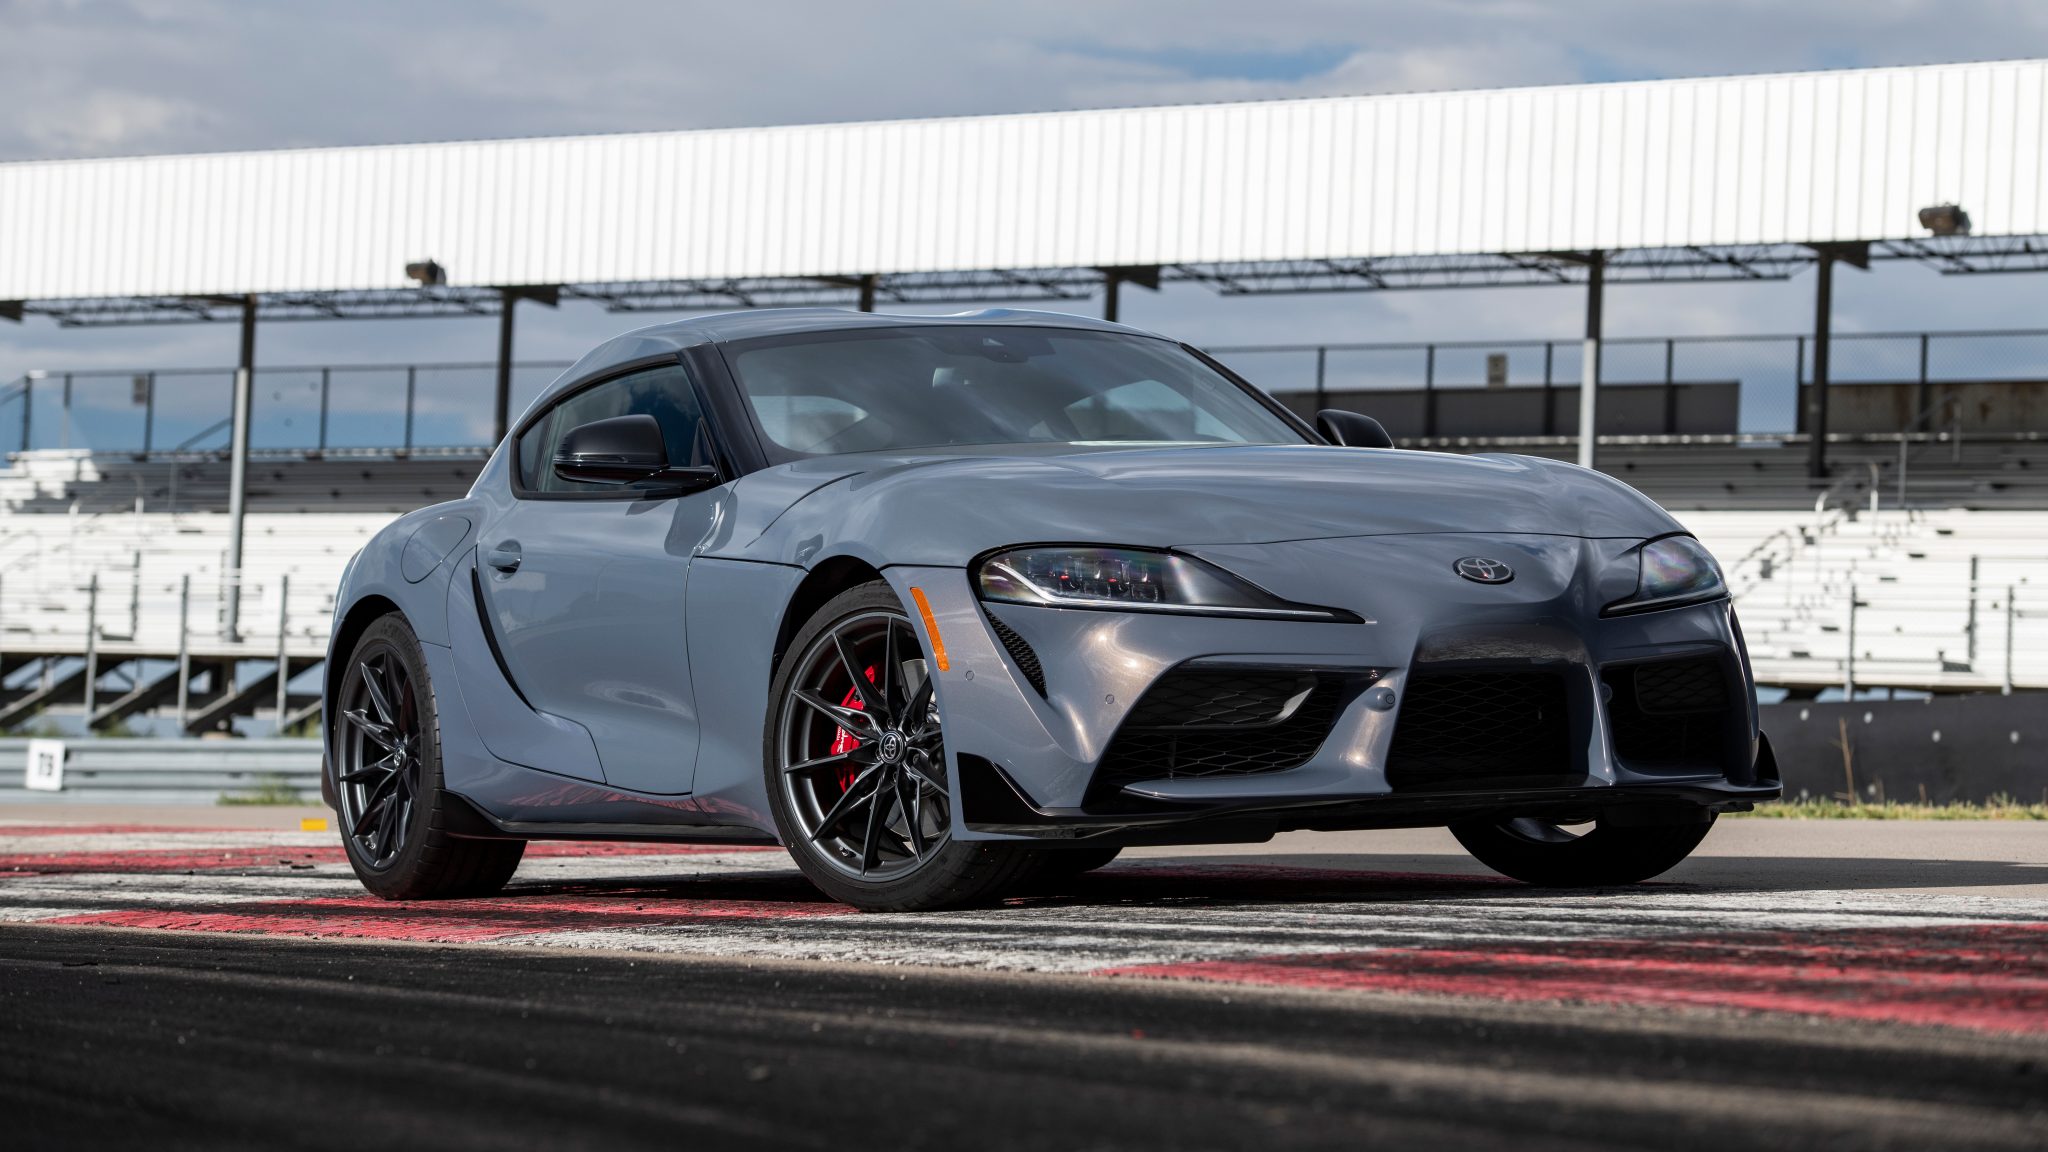
Toyota Supra
Here you will find monthly and yearly United States and Canadian sales figures for the Toyota Supra. The fifth-generation GR Supra brought the name back in 2019 after a 17-year absence, developed alongside the BMW Z4 and powered in its current form by a 382-horsepower turbocharged inline-six. Toyota has said production of this generation ends in spring 2026, and the MkV Final Edition closes it out.
- Class: Two-seat sports coupe
- Engine: 3.0-liter turbocharged inline-six, 382 hp and 368 lb-ft
- Transmissions: Six-speed manual or eight-speed automatic
- Drivetrain: Rear-wheel drive
- Trims: GR Supra 3.0, 3.0 Premium and MkV Final Edition
- Chief rivals: BMW Z4, Nissan Z, Ford Mustang, Porsche 718 Cayman
Toyota Supra Sales in the United States
The Toyota Supra chart for the United States opens in July 2019 with 2,884 sales over that half year. Volume climbed to 5,887 in 2020 and peaked at 6,830 in 2021, helped by a spring 2021 run of four straight months above 780. From there the line fell to 4,952 in 2022 and settled around 2,600 in 2023 and 2024 (2,652 and 2,615). 2025 broke that slide with 2,953 sales, up 12.9 percent, and the fourth quarter of 2025 was its strongest at 944. The first half of 2026 was stronger still, with the second quarter’s 1,197 the best quarter since 2022, before volume tapered to 242 in July and 58 in August as production of this generation wound down. January to August 2026 totals 2,416, up 35.1 percent from 1,788 a year earlier.
Toyota Supra, United States calendar-year unit sales, 2019–2026. 2026 is January–Oct (partial).
Annual sales
| Year | Units | YoY |
|---|---|---|
| 2019 | 2,884 | — |
| 2020 | 5,887 | ▲ 104.1% |
| 2021 | 6,830 | ▲ 16.0% |
| 2022 | 4,952 | ▼ 27.5% |
| 2023 | 2,652 | ▼ 46.4% |
| 2024 | 2,615 | ▼ 1.4% |
| 2025 | 2,953 | ▲ 12.9% |
| 2026 (Jan–Oct) | 2,455 | ▲ 5.4% YTD |
Monthly sales
| Year | Jan | Feb | Mar | Apr | May | Jun | Jul | Aug | Sep | Oct | Nov | Dec | Total |
|---|---|---|---|---|---|---|---|---|---|---|---|---|---|
| 2019 | — | — | — | — | — | — | 320 | 643 | 514 | 516 | 487 | 404 | 2,884 |
| 2020 | 342 | 398 | 273 | 231 | 512 | 538 | 515 | 500 | 489 | 677 | 708 | 704 | 5,887 |
| 2021 | 394 | 503 | 828 | 987 | 1,049 | 787 | 537 | 304 | 436 | 294 | 228 | 483 | 6,830 |
| 2022 | 370 | 298 | 439 | 474 | 540 | 563 | 538 | 413 | 220 | 486 | 353 | 258 | 4,952 |
| 2023 | 307 | 317 | 247 | 276 | 228 | 246 | 157 | 134 | 185 | 85 | 225 | 245 | 2,652 |
| 2024 | 161 | 121 | 202 | 333 | 406 | 272 | 308 | 309 | 217 | 143 | 73 | 70 | 2,615 |
| 2025 | 110 | 132 | 179 | 177 | 325 | 308 | 246 | 311 | 221 | 320 | 347 | 277 | 2,953 |
| 2026 | 275 | 287 | 357 | 344 | 404 | 449 | 242 | 58 | 21 | 18 | — | — | 2,455 |
Toyota Supra Sales in Canada
In Canada the Supra chart starts in July 2019 with 252 sales for that half year. Volume rose every year to a peak of 438 in 2023, dipped to 314 in 2024, then recovered to 427 in 2025, up 36.0 percent. Canada has not shared the American run-out surge: January to August 2026 totals 107, down 66.8 percent from 322 a year earlier, with no month above 26.
Toyota Supra, Canada calendar-year unit sales, 2019–2026. 2026 is January–Sep (partial).
Annual sales
| Year | Units | YoY |
|---|---|---|
| 2019 | 252 | — |
| 2020 | 333 | ▲ 32.1% |
| 2021 | 410 | ▲ 23.1% |
| 2022 | 423 | ▲ 3.2% |
| 2023 | 438 | ▲ 3.5% |
| 2024 | 314 | ▼ 28.3% |
| 2025 | 427 | ▲ 36.0% |
| 2026 (Jan–Sep) | 107 | ▼ 70.5% YTD |
Monthly sales
| Year | Jan | Feb | Mar | Apr | May | Jun | Jul | Aug | Sep | Oct | Nov | Dec | Total |
|---|---|---|---|---|---|---|---|---|---|---|---|---|---|
| 2019 | 0 | 0 | 0 | 0 | 0 | 0 | 70 | 70 | 64 | 17 | 15 | 16 | 252 |
| 2020 | 13 | 12 | 15 | 22 | 20 | 23 | 46 | 43 | 45 | 32 | 29 | 33 | 333 |
| 2021 | 13 | 13 | 18 | 68 | 62 | 70 | 37 | 39 | 39 | 16 | 16 | 19 | 410 |
| 2022 | 5 | 5 | 6 | 65 | 65 | 69 | 28 | 32 | 30 | 39 | 39 | 40 | 423 |
| 2023 | 15 | 14 | 17 | 46 | 51 | 53 | 59 | 68 | 61 | 18 | 18 | 18 | 438 |
| 2024 | 24 | 22 | 24 | 27 | 27 | 25 | 31 | 31 | 29 | 26 | 23 | 25 | 314 |
| 2025 | 33 | 30 | 34 | 49 | 47 | 49 | 41 | 39 | 41 | 23 | 19 | 22 | 427 |
| 2026 | 5 | 15 | 19 | 11 | 26 | 16 | 10 | 5 | 0 | — | — | — | 107 |