Toyota Corolla
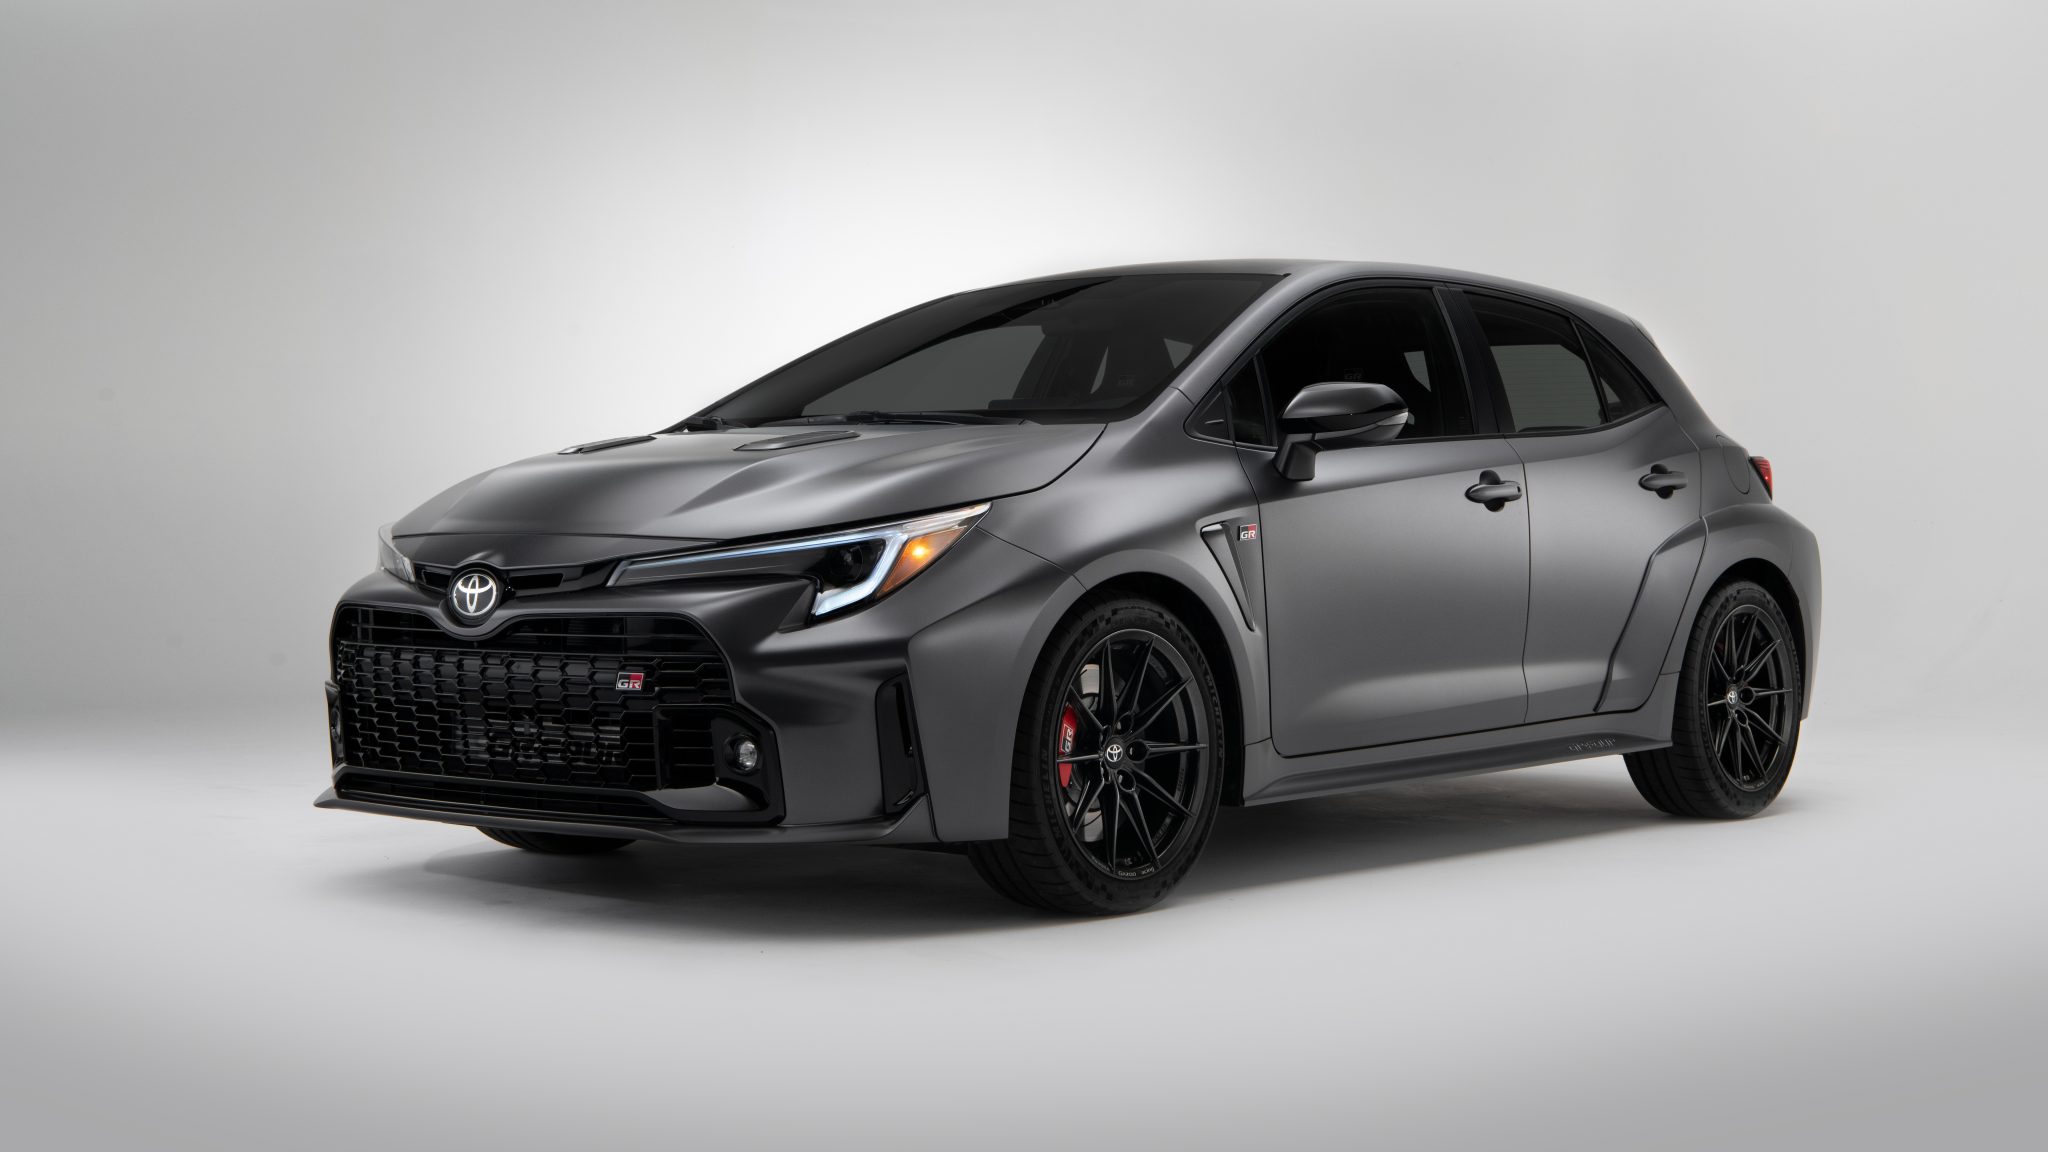
Here you will find monthly and yearly United States, Canadian, European, and Chinese sales figures for the Toyota Corolla, including the Corolla iM. One of the best-selling nameplates in automotive history, with more than 40 million sold worldwide, the Corolla has been a global benchmark for reliable, affordable compact transportation since 1966. It is sold as a sedan and a hatchback and is offered with an efficient hybrid option across many markets.
- Class: Compact car (sedan and hatchback)
- Gas engine: 2.0L Dynamic Force four-cylinder, 169 horsepower and 151 lb-ft
- Transmission: Continuously variable (CVT)
- Drivetrain: Front-wheel drive; a Corolla Hybrid is also offered, including available all-wheel drive
- Fuel economy: Up to a manufacturer-estimated 35 mpg combined (gas)
- Trims: LE, SE, XSE
- Starting MSRP: $22,725
Toyota Corolla Sales in the United States
The Corolla has been a steady high-volume seller in the United States for decades, moving well over 300,000 units a year through much of the 2000s and 2010s and peaking near 387,000 in 2006. As buyers shifted toward crossovers, annual volume settled lower, easing to 222,216 in 2022. It has since firmed up, rising from 232,908 in 2024 to 248,088 in 2025, the best result since 2019. Through June 2026 Toyota had sold 131,403 Corollas in the United States.
Toyota Corolla, United States calendar-year unit sales, 2005–2026. 2026 is January–Aug (partial).
Annual sales
| Year | Units | YoY |
|---|---|---|
| 2005 | 341,290 | — |
| 2006 | 387,388 | ▲ 13.5% |
| 2007 | 368,390 | ▼ 4.9% |
| 2008 | 351,007 | ▼ 4.7% |
| 2009 | 296,874 | ▼ 15.4% |
| 2010 | 266,082 | ▼ 10.4% |
| 2011 | 240,259 | ▼ 9.7% |
| 2012 | 313,092 | ▲ 30.3% |
| 2013 | 302,180 | ▼ 3.5% |
| 2014 | 339,498 | ▲ 12.3% |
| 2015 | 363,332 | ▲ 7.0% |
| 2016 | 356,129 | ▼ 2.0% |
| 2017 | 329,196 | ▼ 7.6% |
| 2018 | 303,732 | ▼ 7.7% |
| 2019 | 304,850 | ▲ 0.4% |
| 2020 | 237,179 | ▼ 22.2% |
| 2021 | 223,215 | ▼ 5.9% |
| 2022 | 222,216 | ▼ 0.4% |
| 2023 | 232,369 | ▲ 4.6% |
| 2024 | 232,908 | ▲ 0.2% |
| 2025 | 248,088 | ▲ 6.5% |
| 2026 (Jan–Aug) | 175,776 | ▲ 8.8% YTD |
Monthly sales
| Year | Jan | Feb | Mar | Apr | May | Jun | Jul | Aug | Sep | Oct | Nov | Dec | Total |
|---|---|---|---|---|---|---|---|---|---|---|---|---|---|
| 2005 | 24,174 | 25,479 | 32,005 | 34,336 | 31,152 | 26,908 | 30,557 | 31,369 | 29,446 | 26,870 | 23,718 | 25,276 | 341,290 |
| 2006 | 24,887 | 25,088 | 32,312 | 36,155 | 41,550 | 37,311 | 41,800 | 34,971 | 32,279 | 24,642 | 27,015 | 29,378 | 387,388 |
| 2007 | 22,519 | 28,321 | 34,355 | 32,289 | 45,238 | 36,499 | 29,719 | 30,491 | 29,550 | 25,815 | 25,012 | 28,582 | 368,390 |
| 2008 | 20,736 | 21,202 | 25,109 | 32,435 | 52,826 | 42,180 | 34,438 | 29,443 | 21,316 | 27,386 | 21,807 | 22,129 | 351,007 |
| 2009 | 19,238 | 18,103 | 22,257 | 18,534 | 23,576 | 19,935 | 29,593 | 43,061 | 20,741 | 25,717 | 21,899 | 34,220 | 296,874 |
| 2010 | 17,121 | 16,996 | 29,623 | 27,932 | 26,953 | 21,876 | 27,345 | 20,280 | 21,060 | 18,636 | 16,202 | 22,058 | 266,082 |
| 2011 | 20,581 | 25,860 | 30,234 | 24,215 | 16,985 | 18,872 | 17,577 | 16,420 | 16,147 | 16,244 | 16,115 | 21,009 | 240,259 |
| 2012 | 17,988 | 44,296 | 28,289 | 24,804 | 31,847 | 26,647 | 23,640 | 24,311 | 23,026 | 20,949 | 22,616 | 24,679 | 313,092 |
| 2013 | 23,822 | 24,999 | 31,423 | 24,273 | 27,997 | 26,458 | 24,463 | 26,861 | 23,251 | 23,637 | 22,434 | 22,562 | 302,180 |
| 2014 | 22,753 | 25,299 | 29,685 | 29,061 | 36,611 | 30,945 | 30,833 | 33,088 | 20,530 | 24,959 | 25,609 | 30,125 | 339,498 |
| 2015 | 27,357 | 27,839 | 35,532 | 31,990 | 36,768 | 30,645 | 30,249 | 31,726 | 26,636 | 27,951 | 24,194 | 32,445 | 363,332 |
| 2016 | 22,362 | 29,342 | 32,556 | 32,111 | 24,872 | 30,950 | 31,717 | 30,741 | 32,272 | 29,735 | 28,262 | 31,209 | 356,129 |
| 2017 | 21,567 | 27,161 | 32,707 | 31,104 | 32,937 | 31,051 | 28,333 | 27,644 | 32,769 | 24,667 | 19,287 | 19,969 | 329,196 |
| 2018 | 21,407 | 25,021 | 31,392 | 25,896 | 29,578 | 28,168 | 26,754 | 26,155 | 20,797 | 22,020 | 21,105 | 25,439 | 303,732 |
| 2019 | 25,113 | 29,016 | 24,479 | 19,679 | 25,712 | 28,869 | 30,635 | 30,121 | 20,354 | 22,378 | 24,752 | 23,742 | 304,850 |
| 2020 | 23,477 | 26,590 | 19,147 | 7,270 | 16,155 | 16,963 | 17,564 | 19,154 | 19,894 | 21,569 | 23,987 | 25,409 | 237,179 |
| 2021 | 19,266 | 22,346 | 30,908 | 31,222 | 30,433 | 21,356 | — | 22,143 | 14,275 | 8,420 | 8,906 | 13,940 | 223,215 |
| 2022 | 15,368 | 15,222 | 16,911 | 24,516 | 25,099 | 19,716 | 18,206 | 17,644 | 18,874 | 16,663 | 16,015 | 17,982 | 222,216 |
| 2023 | 13,049 | 16,398 | 13,528 | 16,729 | 17,308 | 20,485 | 21,382 | 24,134 | 22,679 | 22,272 | 21,005 | 23,400 | 232,369 |
| 2024 | 17,689 | 20,054 | 22,328 | 22,424 | 21,237 | 18,259 | 19,749 | 19,591 | 15,761 | 17,954 | 20,142 | 17,720 | 232,908 |
| 2025 | 17,341 | 16,620 | 21,495 | 22,473 | 23,461 | 18,662 | 20,018 | 21,456 | 18,457 | 21,351 | 23,237 | 23,517 | 248,088 |
| 2026 | 19,420 | 19,944 | 23,210 | 25,312 | 23,644 | 19,873 | 22,601 | 21,772 | — | — | — | — | 175,776 |
Toyota Corolla Sales in Canada
In Canada the Corolla has long been one of the top-selling passenger cars, though volumes have drifted lower with the broader sedan market. After topping 50,000 units in 2008 and again in 2017, annual sales eased to 33,096 in 2022 and 25,988 in 2024. In 2025 the Corolla recorded 25,105 Canadian sales, roughly level with the prior year.
Toyota Corolla, Canada calendar-year unit sales, 2004–2026. 2026 is January–Aug (partial).
Annual sales
| Year | Units | YoY |
|---|---|---|
| 2004 | 44,563 | — |
| 2005 | 46,533 | ▲ 4.4% |
| 2006 | 44,182 | ▼ 5.1% |
| 2007 | 40,474 | ▼ 8.4% |
| 2008 | 57,736 | ▲ 42.6% |
| 2009 | 53,933 | ▼ 6.6% |
| 2010 | 38,680 | ▼ 28.3% |
| 2011 | 36,663 | ▼ 5.2% |
| 2012 | 40,906 | ▲ 11.6% |
| 2013 | 44,449 | ▲ 8.7% |
| 2014 | 48,881 | ▲ 10.0% |
| 2015 | 47,198 | ▼ 3.4% |
| 2016 | 31,988 | ▼ 32.2% |
| 2017 | 50,332 | ▲ 57.3% |
| 2018 | 48,796 | ▼ 3.1% |
| 2019 | 47,596 | ▼ 2.5% |
| 2020 | 33,181 | ▼ 30.3% |
| 2021 | 40,019 | ▲ 20.6% |
| 2022 | 33,096 | ▼ 17.3% |
| 2023 | 28,260 | ▼ 14.6% |
| 2024 | 25,988 | ▼ 8.0% |
| 2025 | 25,105 | ▼ 3.4% |
| 2026 (Jan–Aug) | 20,468 | ▲ 16.1% YTD |
Monthly sales
| Year | Jan | Feb | Mar | Apr | May | Jun | Jul | Aug | Sep | Oct | Nov | Dec | Total |
|---|---|---|---|---|---|---|---|---|---|---|---|---|---|
| 2004 | 2,017 | 2,252 | 3,347 | 4,552 | 6,570 | 4,910 | 4,372 | 3,753 | 3,463 | 3,175 | 3,348 | 2,804 | 44,563 |
| 2005 | 2,253 | 2,477 | 4,077 | 5,102 | 5,126 | 4,368 | 4,013 | 4,772 | 4,962 | 3,734 | 2,946 | 2,703 | 46,533 |
| 2006 | 2,206 | 2,697 | 4,458 | 5,121 | 5,978 | 3,704 | 3,824 | 4,326 | 3,841 | 3,107 | 2,550 | 2,370 | 44,182 |
| 2007 | 1,997 | 2,187 | 3,650 | 4,330 | 5,500 | 4,539 | 4,103 | 3,965 | 3,483 | 2,821 | 1,999 | 1,900 | 40,474 |
| 2008 | 1,932 | 2,824 | 5,534 | 6,790 | 7,435 | 5,991 | 5,574 | 6,770 | 5,457 | 3,999 | 3,229 | 2,201 | 57,736 |
| 2009 | 2,612 | 2,665 | 4,535 | 4,857 | 5,215 | 4,789 | 6,099 | 4,742 | 4,770 | 5,192 | 3,780 | 4,677 | 53,933 |
| 2010 | 1,630 | 2,906 | 4,705 | 3,818 | 4,061 | 3,600 | 3,042 | 2,860 | 3,307 | 3,845 | 2,801 | 2,105 | 38,680 |
| 2011 | 2,146 | 1,975 | 4,445 | 4,914 | 2,945 | 2,428 | 2,721 | 3,108 | 2,926 | 3,508 | 2,859 | 2,688 | 36,663 |
| 2012 | 2,337 | 2,593 | 4,024 | 4,276 | 4,594 | 4,177 | 3,048 | 3,721 | 3,271 | 3,518 | 2,976 | 2,371 | 40,906 |
| 2013 | 2,465 | 2,258 | 3,158 | 4,654 | 5,497 | 3,937 | 3,735 | 3,955 | 4,459 | 4,312 | 3,577 | 2,442 | 44,449 |
| 2014 | 2,210 | 2,631 | 4,321 | 5,620 | 6,107 | 4,656 | 4,401 | 4,680 | 4,409 | 4,067 | 3,370 | 2,409 | 48,881 |
| 2015 | 2,427 | 2,633 | 3,967 | 5,456 | 5,938 | 5,377 | 4,485 | 4,318 | 4,371 | 3,236 | 2,710 | 2,280 | 47,198 |
| 2016 | 2,174 | 2,543 | 3,634 | 5,641 | 5,385 | 4,993 | 3,846 | 3,772 | 0 | 0 | 0 | 0 | 31,988 |
| 2017 | 2,527 | 3,469 | 4,778 | 5,841 | 6,122 | 5,617 | 4,173 | 4,650 | 4,701 | 3,603 | 2,899 | 1,952 | 50,332 |
| 2018 | 2,197 | 3,024 | 4,242 | 4,930 | 5,687 | 5,086 | 3,870 | 4,560 | 4,304 | 4,298 | 3,670 | 2,928 | 48,796 |
| 2019 | 3,231 | 2,938 | 3,086 | 5,282 | 5,282 | 4,803 | 4,374 | 4,374 | 3,979 | 3,682 | 3,202 | 3,363 | 47,596 |
| 2020 | 2,687 | 2,443 | 2,688 | 2,393 | 2,175 | 2,395 | 3,814 | 3,641 | 3,643 | 2,510 | 2,281 | 2,511 | 33,181 |
| 2021 | 2,259 | 2,259 | 2,598 | 4,625 | 4,205 | 4,626 | 4,283 | 4,487 | 4,285 | 2,097 | 2,097 | 2,198 | 40,019 |
| 2022 | 1,544 | 1,470 | 1,693 | 3,376 | 3,376 | 3,539 | 3,603 | 4,144 | 3,785 | 2,188 | 2,188 | 2,190 | 33,096 |
| 2023 | 1,569 | 1,426 | 1,641 | 2,380 | 2,619 | 2,620 | 2,783 | 3,200 | 2,784 | 2,527 | 2,412 | 2,299 | 28,260 |
| 2024 | 2,216 | 2,115 | 2,117 | 2,742 | 2,742 | 2,495 | 2,032 | 2,032 | 1,848 | 2,030 | 1,765 | 1,854 | 25,988 |
| 2025 | 1,799 | 1,635 | 1,718 | 2,851 | 2,721 | 2,722 | 2,137 | 2,040 | 2,041 | 1,955 | 1,615 | 1,871 | 25,105 |
| 2026 | 1,986 | 1,211 | 2,299 | 2,911 | 2,944 | 3,042 | 3,278 | 2,797 | — | — | — | — | 20,468 |
Toyota Corolla Sales in Europe
The Toyota Corolla hatchback was replaced in 2007 by the Toyota Auris, while the Corolla sedan remained on the market as a four-door only. In 2019, the new-generation Corolla was launched as a hatchback, sedan, and station wagon, replacing the Auris after two generations. Toyota reports that hybrid versions make up the large majority of Corolla and Auris sales in Europe, a share that rose as the Auris was phased out. The chart below covers the combined nameplate history in Europe.
Europe Annual Sales
| Year | Sales Units |
|---|---|
| 1997 | 124,947 |
| 1998 | 164,009 |
| 1999 | 137,979 |
| 2000 | 112,072 |
| 2001 | 87,109 |
| 2002 | 138,499 |
| 2003 | 148,529 |
| 2004 | 186,997 |
| 2005 | 203,360 |
| 2006 | 163,649 |
| 2007 | 62,048 |
| 2008 | 26,186 |
| 2009 | 8,534 |
| 2010 | 9,455 |
| 2011 | 8,269 |
| 2012 | 5,475 |
| 2013 | 4,714 |
| 2014 | 12,432 |
| 2015 | 12,713 |
| 2016 | 1,403 |
| 2017 | 14,382 |
| 2018 | 15,041 |
| 2019 | 133,597 |
| 2020 | 137,209 |
| 2021 | 142,720 |
Europe Annual Growth
Toyota Corolla Sales in China
Sales figures for the Toyota Corolla in China, where it has long been one of the market’s best-selling sedans, built locally through Toyota’s joint ventures.
China Annual Sales
| Year | Sales Units |
|---|---|
| 2007 | 65,844 |
| 2008 | 165,271 |
| 2009 | 157,457 |
| 2010 | 172,053 |
| 2011 | 170,467 |
| 2012 | 151,887 |
| 2013 | 146,480 |
| 2014 | 171,487 |
| 2015 | 254,301 |
| 2016 | 307,360 |
| 2017 | 336,763 |
| 2018 | 374,400 |
| 2019 | 357,798 |
| 2020 | 350,310 |
| 2021 | 321,912 |