Mitsubishi Mirage
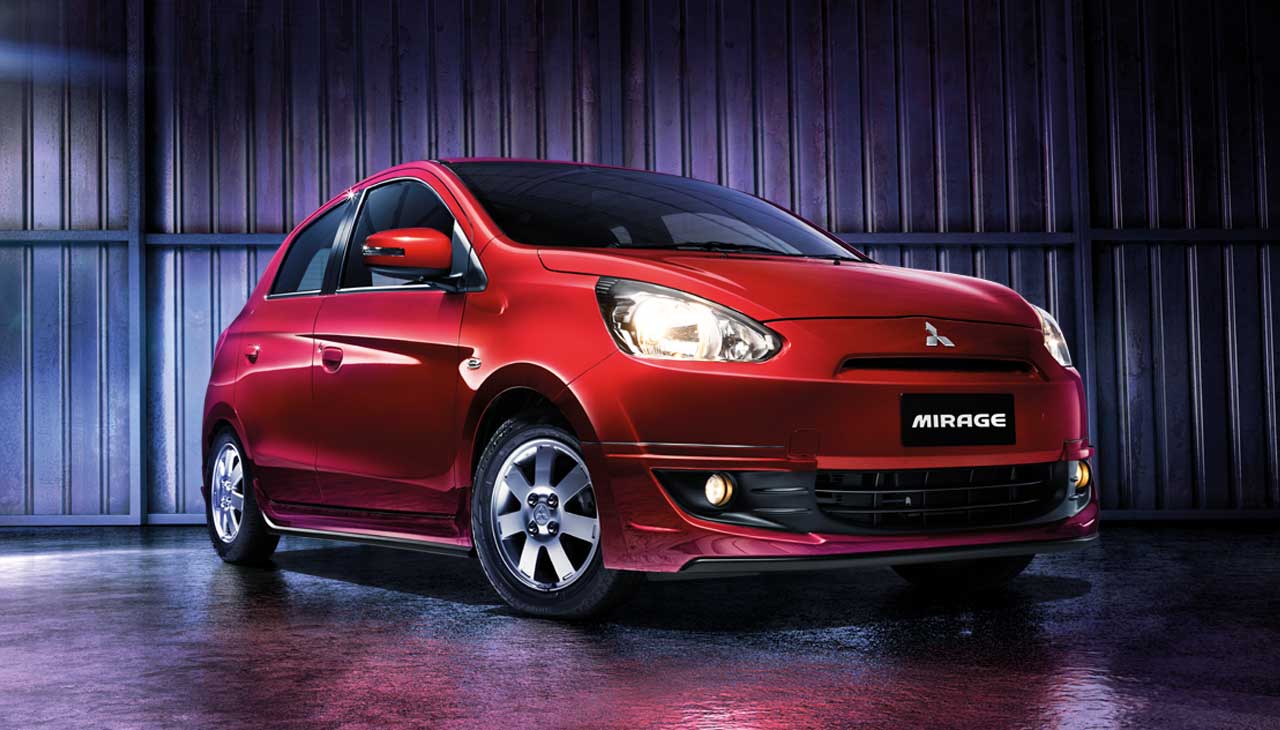
Here you will find monthly and yearly United States and Canadian sales figures for the Mitsubishi Mirage. The Mirage was the cheapest new car sold in America for most of the last decade, a subcompact hatchback and G4 sedan built around low price, high fuel economy and a long warranty rather than performance. Mitsubishi has since confirmed that production has ended, so the charts below cover a nameplate now working through its final inventory. Its closest rivals were the Nissan Versa, Kia Rio and Chevrolet Spark.
- Class: Subcompact hatchback and subcompact sedan (Mirage G4)
- Final engine: 1.2-liter three-cylinder DOHC with variable valve timing, 78 horsepower at 6,000 rpm and 74 lb-ft of torque at 4,000 rpm
- Transmission: Continuously variable transmission, standard
- Drivetrain: Front-wheel drive
- Final trims: Hatchback in ES, LE, Black Edition, SE and RALLIART; G4 sedan in ES, LE, Black Edition and SE
- EPA fuel economy: 36 city / 43 highway / 39 combined mpg for the hatchback, 35 / 41 / 37 mpg for the G4 sedan
- Warranty: 5-year/60,000-mile new vehicle limited and 10-year/100,000-mile powertrain limited coverage
- Chief rivals: Nissan Versa, Kia Rio, Chevrolet Spark, Hyundai Accent
Mitsubishi confirmed with its 2024 year-end results that the Mirage is being discontinued in the United States, that there would be no 2025 model, and that production for the American market ceased in late 2024.
Mitsubishi Mirage Sales in the United States
Mirage sales in the United States opened at 2,935 units in a part-year 2013 debut, then settled into a steady climb that carried the car from 16,708 in 2014 to a first peak of 26,966 in 2019. The pandemic year pulled volume back to 19,135, and after a 22,743 rebound in 2021 the Mirage slid to 15,814 in 2022 and a low of 13,220 in 2023. Then came the outlier: 29,768 units in 2024, the best year the nameplate ever recorded in America and more than double 2023, a figure that matches the 29,766 and 125.3 percent gain Mitsubishi reported in its own year-end release. That surge was a run-out rather than a revival. With production over, 2025 finished at 14,489 as dealers worked through what was left, and the quarterly shape tells the story plainly: roughly 7,300 units in the first quarter, 3,400 in the second, 2,700 in the third and just under 1,100 in the fourth. Through June 2026 only 43 Mirages had been delivered.
Mitsubishi Mirage, United States calendar-year unit sales, 2013–2026. 2026 is January–Jun (partial).
Annual sales
| Year | Units | YoY |
|---|---|---|
| 2013 | 2,935 | — |
| 2014 | 16,708 | ▲ 469.3% |
| 2015 | 21,515 | ▲ 28.8% |
| 2016 | 22,226 | ▲ 3.3% |
| 2017 | 22,386 | ▲ 0.7% |
| 2018 | 24,316 | ▲ 8.6% |
| 2019 | 26,966 | ▲ 10.9% |
| 2020 | 19,135 | ▼ 29.0% |
| 2021 | 22,743 | ▲ 18.9% |
| 2022 | 15,814 | ▼ 30.5% |
| 2023 | 13,220 | ▼ 16.4% |
| 2024 | 29,768 | ▲ 125.2% |
| 2025 | 14,489 | ▼ 51.3% |
| 2026 (Jan–Jun) | 43 | ▼ 99.6% YTD |
Monthly sales
| Year | Jan | Feb | Mar | Apr | May | Jun | Jul | Aug | Sep | Oct | Nov | Dec | Total |
|---|---|---|---|---|---|---|---|---|---|---|---|---|---|
| 2013 | — | — | — | — | — | — | — | — | 20 | 475 | 1,052 | 1,388 | 2,935 |
| 2014 | 1,170 | 1,116 | 1,499 | 1,331 | 1,700 | 1,451 | 1,593 | 1,666 | 1,340 | 1,374 | 1,333 | 1,135 | 16,708 |
| 2015 | 1,705 | 1,863 | 2,488 | 2,407 | 3,369 | 1,669 | 1,553 | 1,569 | 1,348 | 1,197 | 1,085 | 1,262 | 21,515 |
| 2016 | 963 | 1,156 | 4,113 | 3,302 | 2,098 | 1,541 | 1,280 | 1,541 | 1,756 | 1,489 | 1,432 | 1,555 | 22,226 |
| 2017 | 1,311 | 2,835 | 3,324 | 2,136 | 2,342 | 1,739 | 1,560 | 1,557 | 1,583 | 1,768 | 1,208 | 1,023 | 22,386 |
| 2018 | 1,103 | 1,323 | 3,106 | 2,069 | 3,101 | 2,483 | 2,374 | 2,048 | 1,709 | 1,730 | 1,522 | 1,748 | 24,316 |
| 2019 | 1,570 | 1,792 | 2,880 | 2,004 | 2,150 | 2,505 | 3,256 | 2,824 | 2,196 | 2,135 | 1,901 | 1,753 | 26,966 |
| 2020 | 1,511 | 1,852 | 1,283 | 1,352 | 1,202 | 1,252 | 2,047 | 1,820 | 1,972 | 1,634 | 1,342 | 1,868 | 19,135 |
| 2021 | 2,218 | 2,218 | 2,496 | 2,293 | 2,205 | 2,293 | 1,643 | 1,582 | 1,643 | 1,384 | 1,384 | 1,384 | 22,743 |
| 2022 | 1,573 | 1,573 | 1,770 | 1,578 | 1,520 | 1,520 | 1,062 | 1,103 | 1,062 | 1,018 | 977 | 1,058 | 15,814 |
| 2023 | 1,099 | 1,055 | 1,187 | 667 | 641 | 667 | 1,291 | 1,394 | 1,343 | 1,275 | 1,275 | 1,326 | 13,220 |
| 2024 | 1,646 | 1,646 | 1,712 | 1,578 | 1,641 | 1,641 | 3,343 | 3,744 | 3,075 | 2,873 | 3,372 | 3,497 | 29,768 |
| 2025 | 2,434 | 2,336 | 2,531 | 1,154 | 1,199 | 1,065 | 948 | 829 | 899 | 341 | 347 | 406 | 14,489 |
| 2026 | 10 | 9 | 10 | 5 | 5 | 4 | — | — | — | — | — | — | 43 |
Mitsubishi Mirage Sales in Canada
Canada followed a different arc. The Mirage arrived to 614 units in 2013 and immediately posted its Canadian high of 4,048 in 2014, then declined almost every year through to 911 in 2021. From there it recovered strongly, reaching 1,626 in 2022, 2,639 in 2023 and 2,932 in 2024. Canadian buyers did not get the same final-year spike the United States saw; instead 2025 fell to 1,776 as supply ran down, and the monthly series drops to single digits by the fourth quarter. No Mirages have been recorded in Canada in 2026.
Mitsubishi Mirage, Canada calendar-year unit sales, 2013–2026. 2026 is January–Jun (partial).
Annual sales
| Year | Units | YoY |
|---|---|---|
| 2013 | 614 | — |
| 2014 | 4,048 | ▲ 559.3% |
| 2015 | 3,361 | ▼ 17.0% |
| 2016 | 3,112 | ▼ 7.4% |
| 2017 | 2,502 | ▼ 19.6% |
| 2018 | 2,351 | ▼ 6.0% |
| 2019 | 2,270 | ▼ 3.4% |
| 2020 | 1,198 | ▼ 47.2% |
| 2021 | 911 | ▼ 24.0% |
| 2022 | 1,626 | ▲ 78.5% |
| 2023 | 2,639 | ▲ 62.3% |
| 2024 | 2,932 | ▲ 11.1% |
| 2025 | 1,776 | ▼ 39.4% |
| 2026 (Jan–Jun) | 0 | ▼ 100.0% YTD |
Monthly sales
| Year | Jan | Feb | Mar | Apr | May | Jun | Jul | Aug | Sep | Oct | Nov | Dec | Total |
|---|---|---|---|---|---|---|---|---|---|---|---|---|---|
| 2013 | 0 | 0 | 0 | 0 | 0 | 0 | 27 | 27 | 27 | 209 | 207 | 117 | 614 |
| 2014 | 234 | 332 | 233 | 577 | 286 | 470 | 470 | 411 | 247 | 301 | 216 | 271 | 4,048 |
| 2015 | 233 | 180 | 380 | 488 | 326 | 228 | 302 | 342 | 287 | 249 | 187 | 159 | 3,361 |
| 2016 | 118 | 125 | 451 | 352 | 435 | 256 | 184 | 245 | 226 | 237 | 294 | 189 | 3,112 |
| 2017 | 98 | 135 | 221 | 274 | 270 | 197 | 269 | 240 | 224 | 205 | 254 | 115 | 2,502 |
| 2018 | 109 | 135 | 218 | 207 | 221 | 207 | 237 | 236 | 260 | 188 | 169 | 164 | 2,351 |
| 2019 | 265 | 240 | 254 | 206 | 206 | 188 | 187 | 187 | 171 | 131 | 114 | 121 | 2,270 |
| 2020 | 120 | 109 | 122 | 118 | 107 | 120 | 98 | 94 | 95 | 73 | 67 | 75 | 1,198 |
| 2021 | 60 | 60 | 72 | 104 | 94 | 105 | 43 | 46 | 45 | 92 | 92 | 98 | 911 |
| 2022 | 133 | 126 | 147 | 272 | 272 | 285 | 31 | 36 | 35 | 96 | 96 | 97 | 1,626 |
| 2023 | 241 | 219 | 254 | 65 | 71 | 73 | 229 | 264 | 231 | 346 | 330 | 316 | 2,639 |
| 2024 | 159 | 152 | 154 | 137 | 137 | 127 | 447 | 447 | 407 | 274 | 239 | 252 | 2,932 |
| 2025 | 352 | 320 | 336 | 228 | 217 | 219 | 30 | 29 | 30 | 5 | 4 | 6 | 1,776 |
| 2026 | 0 | 0 | 0 | 0 | 0 | 0 | — | — | — | — | — | — | 0 |