
Jaguar Land Rover (JLR) Sales Data, Trends & Analysis for the European Automotive Market
Jaguar Land Rover (JLR) is a British multinational automotive manufacturer headquartered in Gaydon, Warwickshire, England. It is a subsidiary of Tata Motors, which is part of the Tata Group. JLR designs, manufactures, and sells luxury vehicles under the Jaguar and Land Rover brands. Jaguar is a British luxury car manufacturer that produces sports cars and sedans. The company is known for its iconic designs, such as the E-Type and the F-Type. Land Rover is a British luxury SUV and off-road vehicle manufacturer. The company is known for its rugged and capable vehicles, such as the Range Rover and the Defender.
Jaguar Land Rover (JLR) has been selling cars in Europe since the 1950s. The company’s first car sold in Europe was the Jaguar XK120. JLR has since become one of the leading luxury car manufacturers in Europe, and its vehicles are popular among European consumers. In recent years, JLR has performed well in Europe. In 2022, the company sold over 150,000 vehicles in Europe, making it one of the top 10 luxury automakers in the region.
Jaguar Land Rover (JLR) Europe Sales Figures & Recent Highlights
Both Jaguar and Land Rover have been selling vehicles in Canada for several decades, although they became more widely available and recognized over the years as the brands established a stronger presence in North America. Jaguar has been offering its range of luxury sedans and sports cars in Canada for many years, aligning closely with its presence in the United States. Similarly, Land Rover has had a presence in Canada for a considerable time, building on its reputation for creating durable and luxurious SUVs suitable for the diverse Canadian climates and terrains.
The Jaguar I-PACE has garnered attention as a luxury electric vehicle, although the market for electric vehicles in Canada is still developing. The XF and F-TYPE models are available but face stiff competition from other luxury brands like BMW, Mercedes-Benz, and Audi. As in other markets, Jaguar has found it challenging to compete against well-established brands in Canada, especially in the popular SUV segments.
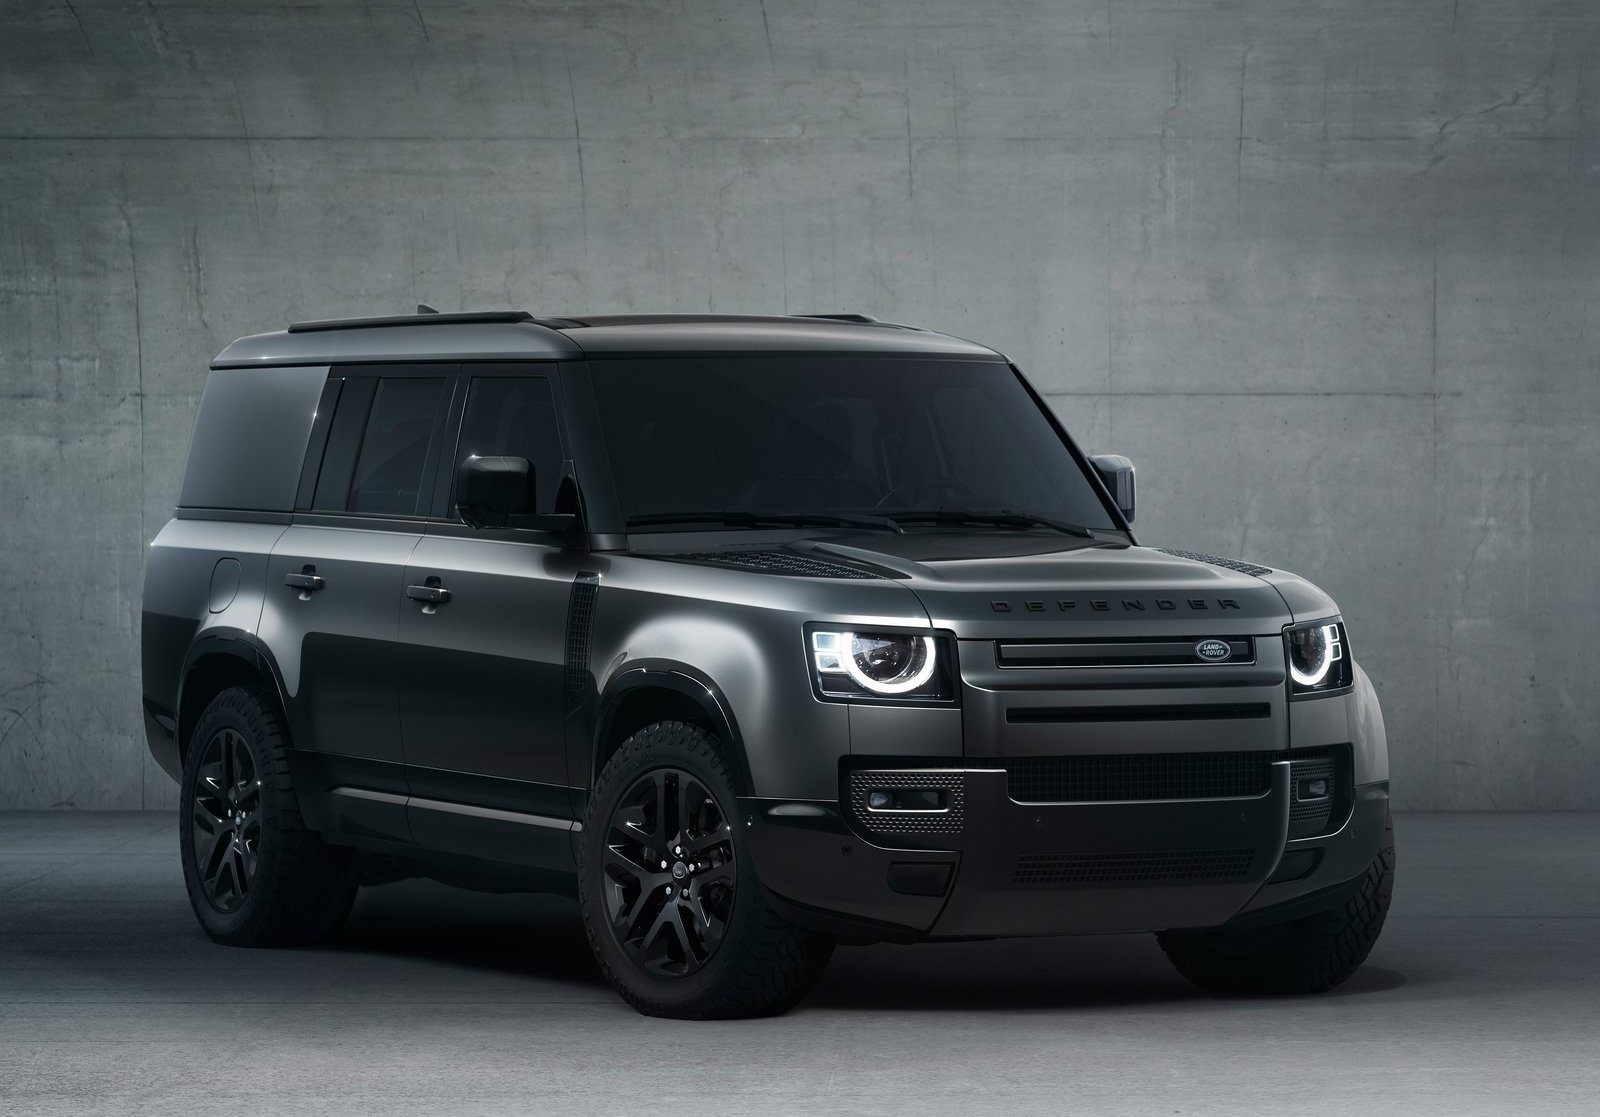
Given Canada’s diverse terrains and climates, Land Rover’s SUVs, renowned for both luxury and off-road capability, have been quite popular. The Range Rover lineup, in particular, holds a strong position in the high-end SUV market. The recently reintroduced Land Rover Defender has created quite a buzz and is expected to boost the brand’s performance in the rugged SUV category.
Jaguar Land Rover has carved out a niche in the Canadian luxury market, especially with the Land Rover brand’s SUVs. The brands face several challenges, including increasing competition and a changing regulatory landscape that favors electrification. JLR’s plans for more electric and hybrid models should align well with future market demands.
Jaguar Land Rover (JLR) Annual Sales, Growth & Market Share in Europe
Below we have a table that shows total Jaguar Land Rover (JLR) sales volumes for the European automotive market, broken out by year. This data captures all Jaguar Land Rover (JLR) sales for the entire European automotive market, including sub-brands.
| Year | Sales | YOY Change | Marketshare | Marketshare Change |
|---|---|---|---|---|
| 1997 | 22,444 | 0.00 | 0.27 | 0.00 |
| 1998 | 62,555 | 178.72 | 0.66 | 58.88 |
| 1999 | 94,460 | 51.00 | 0.83 | 20.76 |
| 2000 | 100,273 | 6.15 | 0.86 | 2.67 |
| 2001 | 101,821 | 1.54 | 0.82 | -4.49 |
| 2002 | 108,147 | 6.21 | 0.86 | 5.18 |
| 2003 | 99,622 | -7.88 | 0.79 | -9.04 |
| 2004 | 114,735 | 15.17 | 0.82 | 3.62 |
| 2005 | 106,831 | -6.89 | 0.77 | -7.34 |
| 2006 | 100,691 | -5.75 | 0.73 | -4.93 |
| 2007 | 107,061 | 6.33 | 0.77 | 5.73 |
| 2008 | 114,558 | 7.00 | 0.89 | 12.87 |
| 2009 | 72,360 | -36.84 | 0.55 | -61.76 |
| 2010 | 78,777 | 8.87 | 0.62 | 11.75 |
| 2011 | 76,746 | -2.58 | 0.61 | -2.12 |
| 2012 | 109,564 | 42.76 | 0.97 | 36.89 |
| 2013 | 116,610 | 6.43 | 1.03 | 6.08 |
| 2014 | 123,480 | 5.89 | 1.02 | -0.41 |
| 2015 | 120,845 | -2.13 | 0.94 | -9.33 |
| 2016 | 186,038 | 53.95 | 1.34 | 30.24 |
| 2017 | 204,676 | 10.02 | 1.41 | 4.76 |
| 2018 | 205,476 | 0.39 | 1.43 | 1.67 |
| 2019 | 199,504 | -2.91 | 1.35 | -6.03 |
| 2020 | 151,071 | -24.28 | 1.35 | -0.43 |
| 2021 | 134,676 | -10.85 | 1.22 | -10.77 |
| 2022 | 109,771 | -18.49 | 1.07 | -13.85 |
Jaguar Land Rover (JLR) Europe Annual Sales Units & Growth Chart
Below is a visual representation of Jaguar Land Rover (JLR)’s European sales units over time. We have both the Jaguar Land Rover (JLR) sales units and the growth in the European market. Click on the items in the legend to see each series by itself.
Jaguar Land Rover (JLR) Europe Growth Rate & Market Share Chart
Below is the annual growth rate for the Jaguar Land Rover (JLR) in Europe, shown against the Jaguar Land Rover (JLR)’s marketshare changes in Europe. This gives you a good look into how the Jaguar Land Rover (JLR) has faired against the other brands in terms of absolute sales and effect on marketshare. Click on the items in the legend to see each series by itself.


