
Ford Motor Company Sales Data, Trends & Analysis for the Chinese Automotive Market
The Ford Motor Company is one of the largest and oldest automakers in the world, founded by Henry Ford on June 16, 1903. The company is headquartered in Dearborn, Michigan, a suburb of Detroit. Ford is the main brand, under which a variety of vehicles are sold ranging from sedans and hatchbacks to trucks, SUVs, and commercial vehicles. The Ford F-150 pickup has been one of the best-selling vehicles in the United States for several decades. Lincoln is Ford’s luxury vehicle division, focusing on premium sedans, SUVs, and crossovers. There is also Ford Performance, a subsidiary responsible for high-performance vehicles, parts, and accessories. Models like the Ford Mustang Shelby GT500 and the Ford GT are developed under this division. Over the years, Ford has also owned several other brands which it has since sold or discontinued, including Aston Martin (sold in 2007), Jaguar and Land Rover (sold to Tata Motors in 2008), Volvo Cars (sold to Geely in 2010) and Mercury (discontinued in 2010).
Ford Motor Company China Sales Figures & Recent Highlights
Ford Motor Company entered the Chinese market much later than some of its global competitors. Ford’s significant efforts in China began around the early 2000s through joint ventures, as is mandated by Chinese law for foreign automakers. The company set up Changan Ford, a 50-50 joint venture with Chongqing Changan Automobile Company, one of China’s largest auto manufacturers, to produce Ford-branded passenger cars.
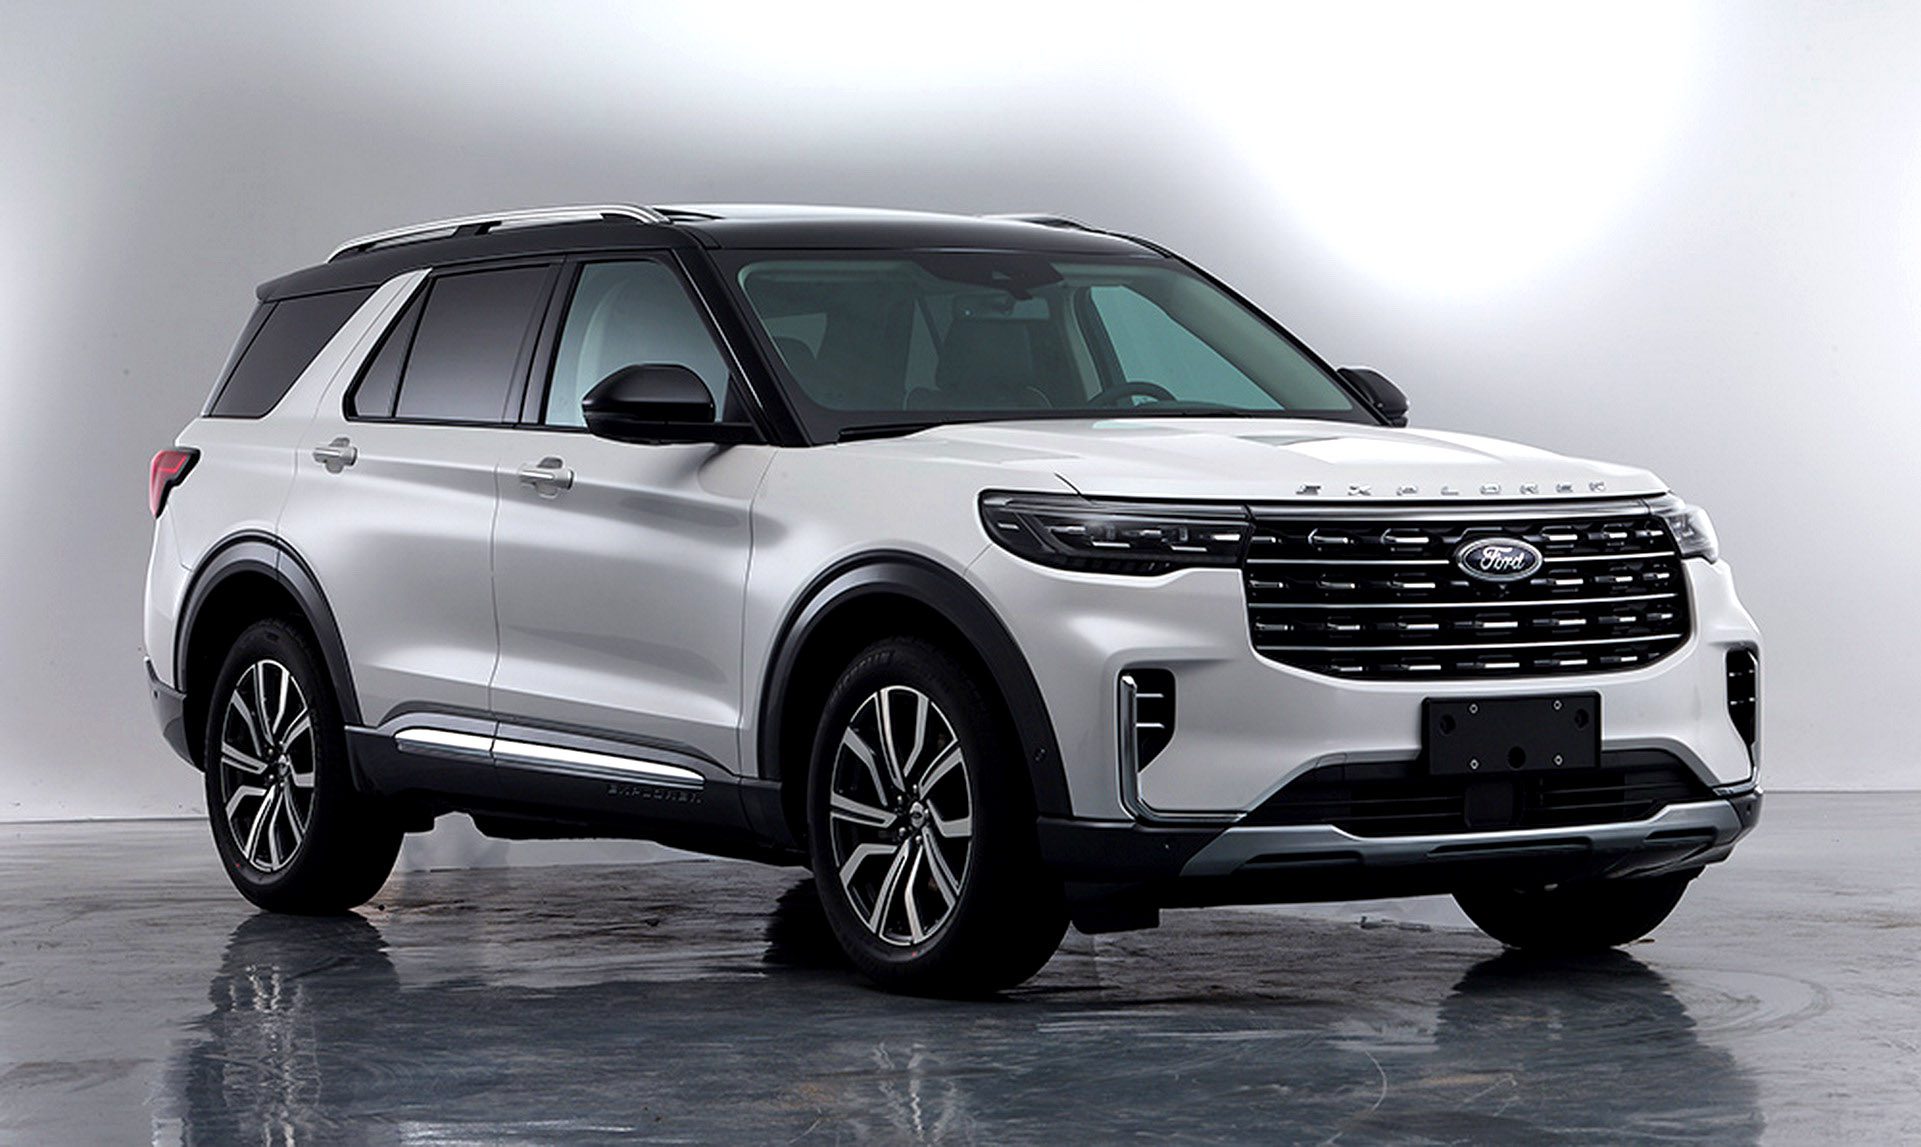
Ford offers a range of vehicles in China, including SUVs like the Ford Explorer and the Ford Escape (known as the Ford Kuga in some markets), as well as sedans like the Ford Focus. However, despite having a comprehensive product line-up, Ford’s market penetration has been relatively limited compared to competitors like General Motors and Volkswagen. Ford has experienced declining sales in China in recent years, which has led to a rethink of its strategy for the Chinese market. This includes a focus on localized designs and manufacturing to cater specifically to Chinese consumer preferences. Recognizing the importance of the rapidly growing EV market in China, Ford has been taking steps to introduce more electric and hybrid vehicles, such as the Territory EV and the Mustang Mach-E.
Ford’s luxury brand, Lincoln, entered the Chinese market in 2014, focusing on sedans and SUVs. While still a niche player, Lincoln has been gaining traction by targeting the growing upper-middle-class and affluent segments in China. Recognizing the potential for luxury cars in China, Lincoln began local production of its vehicles in China to circumvent import duties and better compete with European luxury brands that are locally produced.
Ford is in the midst of a significant restructuring and localization effort to revive its fortunes in China. This includes focusing on sectors with the most growth potential, like electric vehicles and luxury cars, as well as creating vehicles that are better tailored to Chinese consumers’ specific tastes and needs.
Ford Motor Company Annual Sales, Growth & Market Share in China
Below we have a table that shows total Ford Motor Company sales volumes for the Chinese automotive market, broken out by year. This data captures all Ford Motor Company sales for the entire Chinese automotive market, including sub-brands.
| Year | Sales | YOY Change | Marketshare | Marketshare Change |
|---|---|---|---|---|
| 2001 | 137 | 0.00 | 0.02 | 0.00 |
| 2002 | 3,066 | 2,137.96 | 0.27 | 93.92 |
| 2003 | 4,652 | 51.73 | 0.21 | -30.79 |
| 2004 | 37,315 | 702.13 | 1.48 | 86.00 |
| 2005 | 50,534 | 35.43 | 1.59 | 6.90 |
| 2006 | 51,324 | 1.56 | 1.27 | -25.34 |
| 2007 | 49,094 | -4.34 | 0.97 | -31.00 |
| 2008 | 43,538 | -11.32 | 0.83 | -16.99 |
| 2009 | 93,938 | 115.76 | 1.19 | 30.57 |
| 2010 | 131,833 | 40.34 | 1.28 | 6.58 |
| 2011 | 131,694 | -0.11 | 1.18 | -8.26 |
| 2012 | 122,141 | -7.25 | 1.03 | -14.97 |
| 2013 | 215,631 | 76.54 | 1.50 | 31.70 |
| 2014 | 338,069 | 56.78 | 2.09 | 27.94 |
| 2015 | 633,342 | 87.34 | 3.42 | 39.01 |
| 2016 | 853,770 | 34.80 | 3.89 | 11.98 |
| 2017 | 811,687 | -4.93 | 3.54 | -9.90 |
| 2018 | 495,903 | -38.90 | 2.24 | -57.72 |
| 2019 | 316,699 | -36.14 | 1.57 | -43.07 |
| 2020 | 263,192 | -16.90 | 1.41 | -11.26 |
| 2021 | 270,682 | 2.85 | 1.34 | -5.20 |
| 2022 | 288,275 | 6.50 | 1.39 | 3.94 |
Ford Motor Company China Annual Sales Units & Growth Chart
Below is a visual representation of Ford Motor Company’s China sales units over time. We have both the Ford Motor Company sales units and the growth in the Chinese market. Click on the items in the legend to see each series by itself.
Ford Motor Company China Growth Rate & Market Share Chart
Below is the annual growth rate for the Ford Motor Company inChina, shown against the Ford Motor Company’s marketshare changes in China. This gives you a good look into how the Ford Motor Company has faired against the other brands in terms of absolute sales and effect on marketshare. Click on the items in the legend to see each series by itself.


