
Stellantis Sales Data, Trends & Analysis for the U.S Automotive Market
Stellantis N.V. is a multinational automotive company that resulted from the merger of Fiat Chrysler Automobiles (FCA) and the PSA Group (Peugeot S.A.). The merger was finalized in January 2021, creating the world’s fourth-largest automaker by volume. The brands that sit under the Stellantis umbrella include Abarth, Alfa Romeo, Chrysler, Citroën, Dodge, DS Automobiles, Fiat, Jeep, Lancia, Maserati, Opel/Vauxhall, Peugeot and Ram. The merger aimed to leverage the strengths of both FCA and PSA Group, realizing cost savings, and pooling resources and expertise to better address challenges in the automotive industry, such as the push for electrification and autonomous driving. Stellantis has a global presence with operations in Europe, North America, and other parts of the world. Stellantis has a global presence, with manufacturing facilities in 30 countries and sales outlets in more than 130 countries. The company employs over 300,000 people worldwide.
Stellantis U.S Sales Figures & Recent Highlights
Stellantis was formed in 2021, so it has only been selling cars in the US for a little over a year. However, the company’s brands have a long history of selling cars in the US. FCA, which was one-half of the Stellantis merger, sold cars in the US under the Chrysler, Dodge, Jeep, and Ram brands. Groupe PSA, the other half of the merger, sold cars in the US under the Peugeot and Citroën brands. In 2022, Stellantis sold over 1.6 million cars in the US, accounting for over 12% of the total US car market. Stellantis is the fourth-largest automaker in the US market.
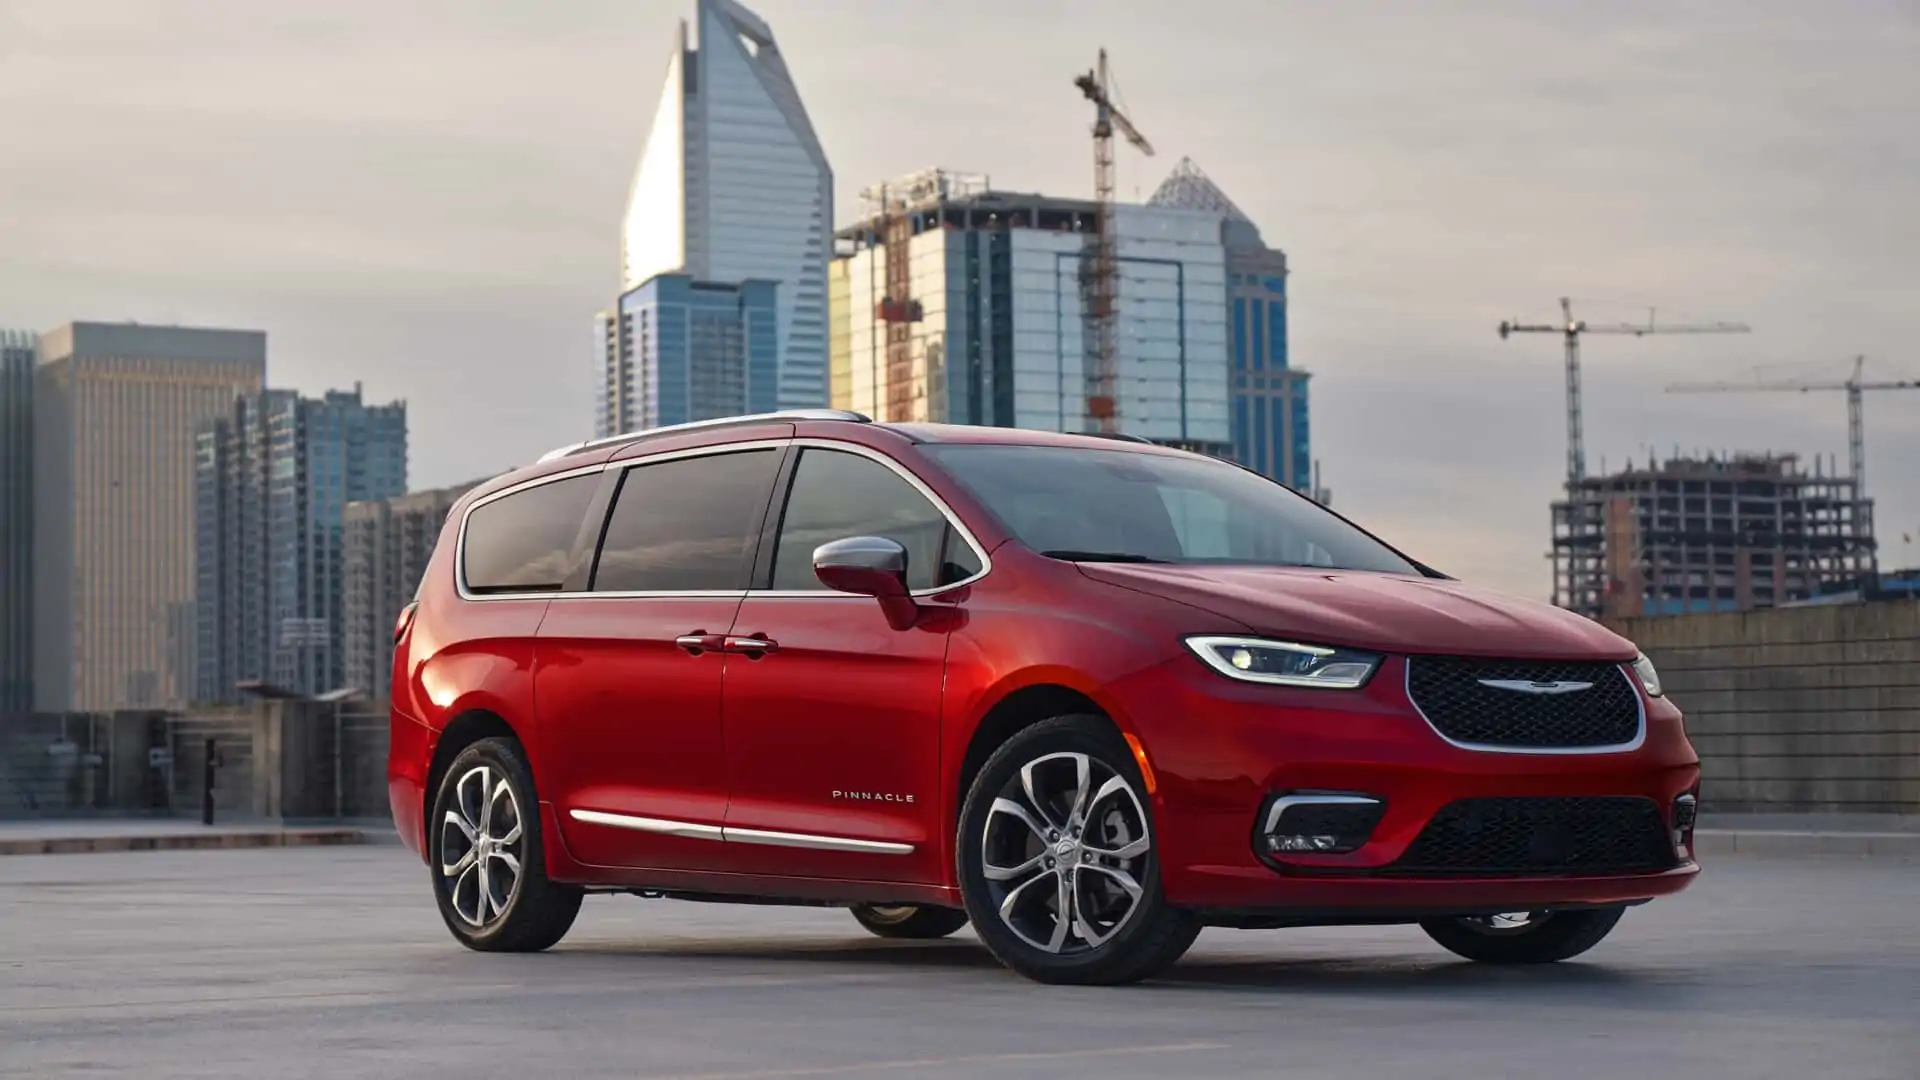
Stellantis’s most popular brands in the US are Jeep and Ram. Jeep is known for its SUVs, while Ram is known for its pickup trucks. Other popular Stellantis brands in the US include Chrysler, Dodge, and Alfa Romeo. Stellantis has performed well in the US market in recent years. The company is well-positioned to continue its growth in the market, thanks to its strong brand portfolio and its commitment to innovation.
Brands like Jeep and Ram remained strong performers in the U.S. market. Jeep, with its lineup of SUVs, benefited from the ongoing trend of consumers preferring SUVs and crossovers. Ram continued to perform well in the competitive truck segment. However, brands like Fiat faced challenges, given the American preference for larger vehicles. Fiat’s small car focus didn’t align as well with market trends.
The COVID-19 pandemic and its associated challenges, such as supply chain disruptions and semiconductor shortages, impacted the entire automotive industry, including Stellantis brands. Despite these challenges, the legacy FCA brands, especially Jeep and Ram, remained robust in terms of sales and market presence.
Stellantis U.S Monthly Sales Data
Below we have a table that shows Stellantis sales for the United States automotive market, but this time it is broken out by month. This is on a unit basis. This is Stellantis new vehicle sales in the US across all its owned brands.
Stellantis Annual Sales, Growth & Market Share in the United States
Below we have a table that shows total Stellantis sales volumes for the US automotive market, broken out by year. This data captures all Stellantis sales for the entire United States automotive market, including sub-brands.
| Year | Sales | YOY Change | Marketshare | Marketshare Change |
|---|---|---|---|---|
| 1971 | 28,381 | 0.00 | 25.54 | 0.00 |
| 1972 | 34,057 | 20.00 | 25.79 | 0.95 |
| 1973 | 35,523 | 4.30 | 16.17 | -59.48 |
| 1974 | 42,925 | 20.84 | 24.32 | 33.51 |
| 1975 | 60,356 | 40.61 | 26.94 | 9.72 |
| 1976 | 78,972 | 30.84 | 31.87 | 15.46 |
| 1977 | 121,262 | 53.55 | 34.72 | 8.22 |
| 1978 | 102,131 | -15.78 | 26.83 | -29.42 |
| 1979 | 138,053 | 35.17 | 29.60 | 9.35 |
| 1980 | 592,800 | 329.40 | 59.75 | 50.46 |
| 1981 | 850,752 | 43.51 | 66.06 | 9.55 |
| 1982 | 813,744 | -4.35 | 66.54 | 0.73 |
| 1983 | 974,085 | 19.70 | 59.07 | -12.64 |
| 1984 | 1,160,326 | 19.12 | 54.97 | -7.46 |
| 1985 | 1,471,887 | 26.85 | 39.69 | -38.51 |
| 1986 | 1,587,804 | 7.88 | 39.86 | 0.44 |
| 1987 | 1,462,566 | -7.89 | 40.11 | 0.61 |
| 1988 | 1,625,417 | 11.13 | 42.13 | 4.81 |
| 1989 | 1,434,377 | -11.75 | 41.15 | -2.38 |
| 1990 | 1,171,025 | -18.36 | 38.91 | -5.78 |
| 1991 | 1,010,508 | -13.71 | 36.87 | -5.51 |
| 1992 | 1,019,553 | 0.90 | 39.27 | 6.10 |
| 1993 | 1,069,222 | 4.87 | 38.86 | -1.06 |
| 1994 | 817,377 | -23.55 | 33.96 | -14.42 |
| 1995 | 649,651 | -20.52 | 23.81 | -42.63 |
| 1996 | 517,007 | -20.42 | 18.74 | -27.07 |
| 1997 | 778,646 | 50.61 | 26.81 | 30.11 |
| 1998 | 1,123,977 | 44.35 | 36.00 | 25.53 |
| 1999 | 931,246 | -17.15 | 31.42 | -14.58 |
| 2000 | 731,583 | -21.44 | 26.10 | -20.38 |
| 2001 | 550,393 | -24.77 | 24.20 | -7.85 |
| 2002 | 424,523 | -22.87 | 17.85 | -35.58 |
| 2003 | 341,950 | -19.45 | 16.91 | -5.58 |
| 2004 | 314,534 | -8.02 | 22.47 | 24.77 |
| 2005 | 2,276,963 | 623.92 | 13.30 | -68.98 |
| 2006 | 2,122,605 | -6.78 | 12.73 | -4.45 |
| 2007 | 2,060,684 | -2.92 | 12.70 | -0.26 |
| 2008 | 1,437,611 | -30.24 | 10.78 | -17.80 |
| 2009 | 924,238 | -35.71 | 8.79 | -22.59 |
| 2010 | 1,086,014 | 17.50 | 9.26 | 5.08 |
| 2011 | 1,364,270 | 25.62 | 10.56 | 12.24 |
| 2012 | 1,780,528 | 30.51 | 11.40 | 7.42 |
| 2013 | 1,799,768 | 1.08 | 11.48 | 0.70 |
| 2014 | 2,090,513 | 16.15 | 12.64 | 9.16 |
| 2015 | 2,243,814 | 7.33 | 12.82 | 1.40 |
| 2016 | 2,259,204 | 0.69 | 12.84 | 0.15 |
| 2017 | 2,073,147 | -8.24 | 12.00 | -7.01 |
| 2018 | 2,238,307 | 7.97 | 12.88 | 6.85 |
| 2019 | 2,203,673 | -1.55 | 12.92 | 0.33 |
| 2020 | 1,820,443 | -17.39 | 12.37 | -4.43 |
| 2021 | 1,767,396 | -2.91 | 11.82 | -4.71 |
| 2022 | 1,547,631 | -12.43 | 11.31 | -4.53 |
| 2023 | 1,525,434 | -1.43 | 9.82 | -15.16 |
| 2024 | 332,538 | 0.00 | 8.77 | 0.00 |
Stellantis U.S Annual Sales Units & Growth Chart
Below is a visual representation of Stellantis’ U.S sales units over time. We have both the Stellantis sales units and the growth in the United States market. Click on the items in the legend to see each series by itself.
Stellantis U.S Growth Rate & Market Share Chart
Below is the annual growth rate for the Stellantis in the United States, shown against the Stellantis’ marketshare changes in the United States. This gives you a good look into how the Stellantis has faired against the other brands in terms of absolute sales and effect on marketshare. Click on the items in the legend to see each series by itself.


